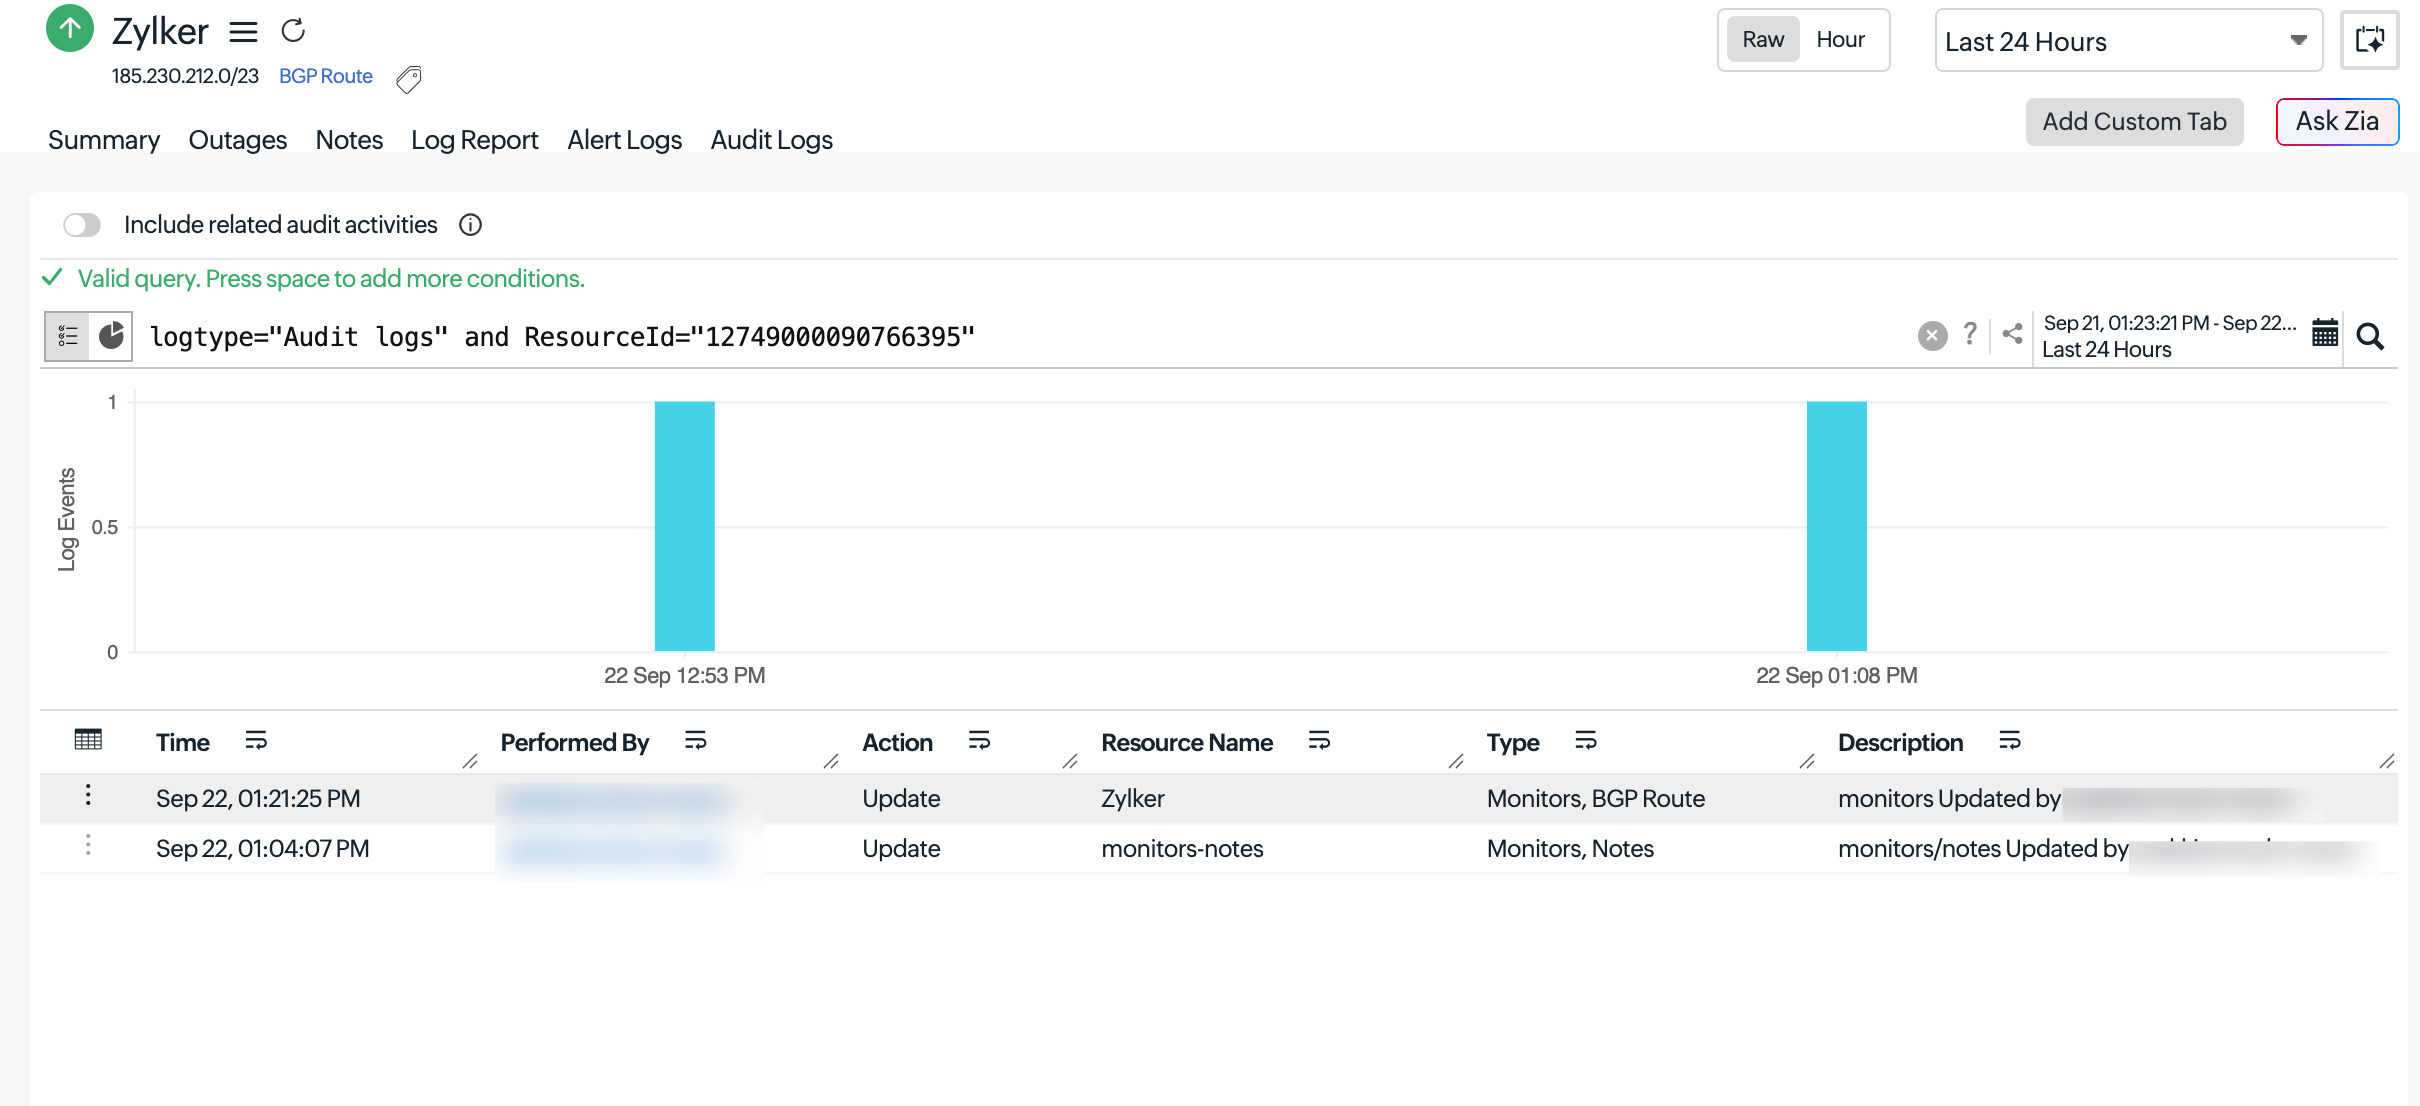
Performance metrics for BGP Route monitors
The Performance Summary page provides an overview of the health and routing status of the monitored IP prefix. It helps you quickly identify BGP routing issues, such as route hijacks, route leaks, Autonomous System (AS) path changes, and resource public key infrastructure (RPKI) validation failures. You can also analyze route visibility trends and inspect routing information collected from multiple global vantage points.
Summary tab
The Summary tab provides an at-a-glance health overview of of the availability and BGP routing health of the monitored IP prefix for the selected time range.
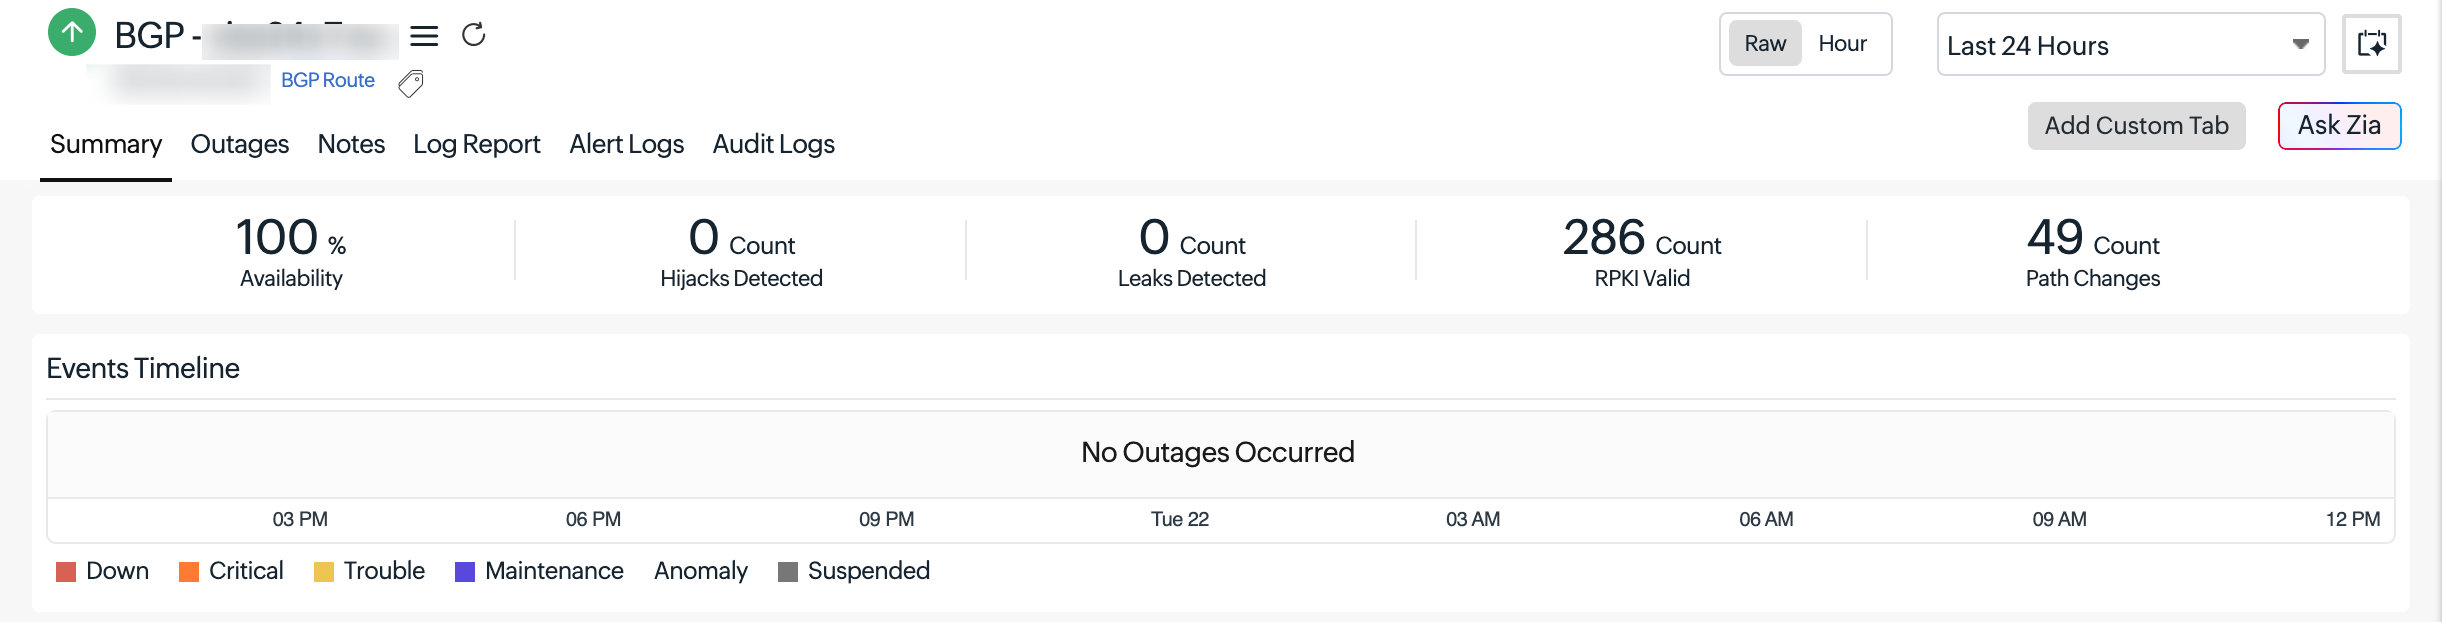
Top-level metrics
The top of the Summary tab displays the following key metrics:
|
Metric |
Description |
|---|---|
|
Availability (%) |
The percentage of time the BGP route was available and visible across the configured vantage points during the selected time range. 100% indicates no outages were detected. |
|
Hijacks Detected |
The number of BGP hijack events identified during the time range. A hijack occurs when an unauthorized AS announces your IP prefix, potentially redirecting your traffic. |
|
Leaks Detected |
The number of route leaks detected for the monitored prefix during the selected time range. |
|
RPKI Valid |
The number of routes that passed RPKI validation.. An RPKI-valid route confirms that the originating AS is authorized to announce the prefix via a Route Origin Authorization (ROA). |
|
Path Changes |
The number of AS path changes detected for the monitored prefix during the selected time range.. Frequent path changes may indicate network instability or BGP route flapping. |
Events Timeline
The Events Timeline provides a chronological view of monitor status changes during the selected time range. Use the timeline to quickly identify when routing issues or availability changes occurred.
When no routing anomalies occurred in the selected window, the timeline displays a No Outages Occurred message.
Event states are color-coded for quick identification:
- Down (red): The monitored prefix became completely unreachable.
- Critical (orange): A severe routing anomaly (e.g., hijack or major path divergence) was detected.
- Trouble (yellow): A minor anomaly or degraded visibility was recorded.
- Maintenance (purple): A scheduled maintenance window was active.
- Anomaly (white): An unusual routing pattern was detected that does not meet the threshold for Trouble or Critical.
- Suspended (gray): Monitoring was suspended for the prefix during this period.
- Click any event segment in the timeline to drill into its details, including the exact start and end time, duration, and contributing factors.
- Use the zoom controls to adjust the timeline and investigate events within a specific time period.
Domain Prefixes
The Domain Prefixes section displays the configured IP prefix and its associated Origin AS.
For example:
Origin AS: AS56201
IP Prefix: 169.148.148.0/23
Route Visibility Trend
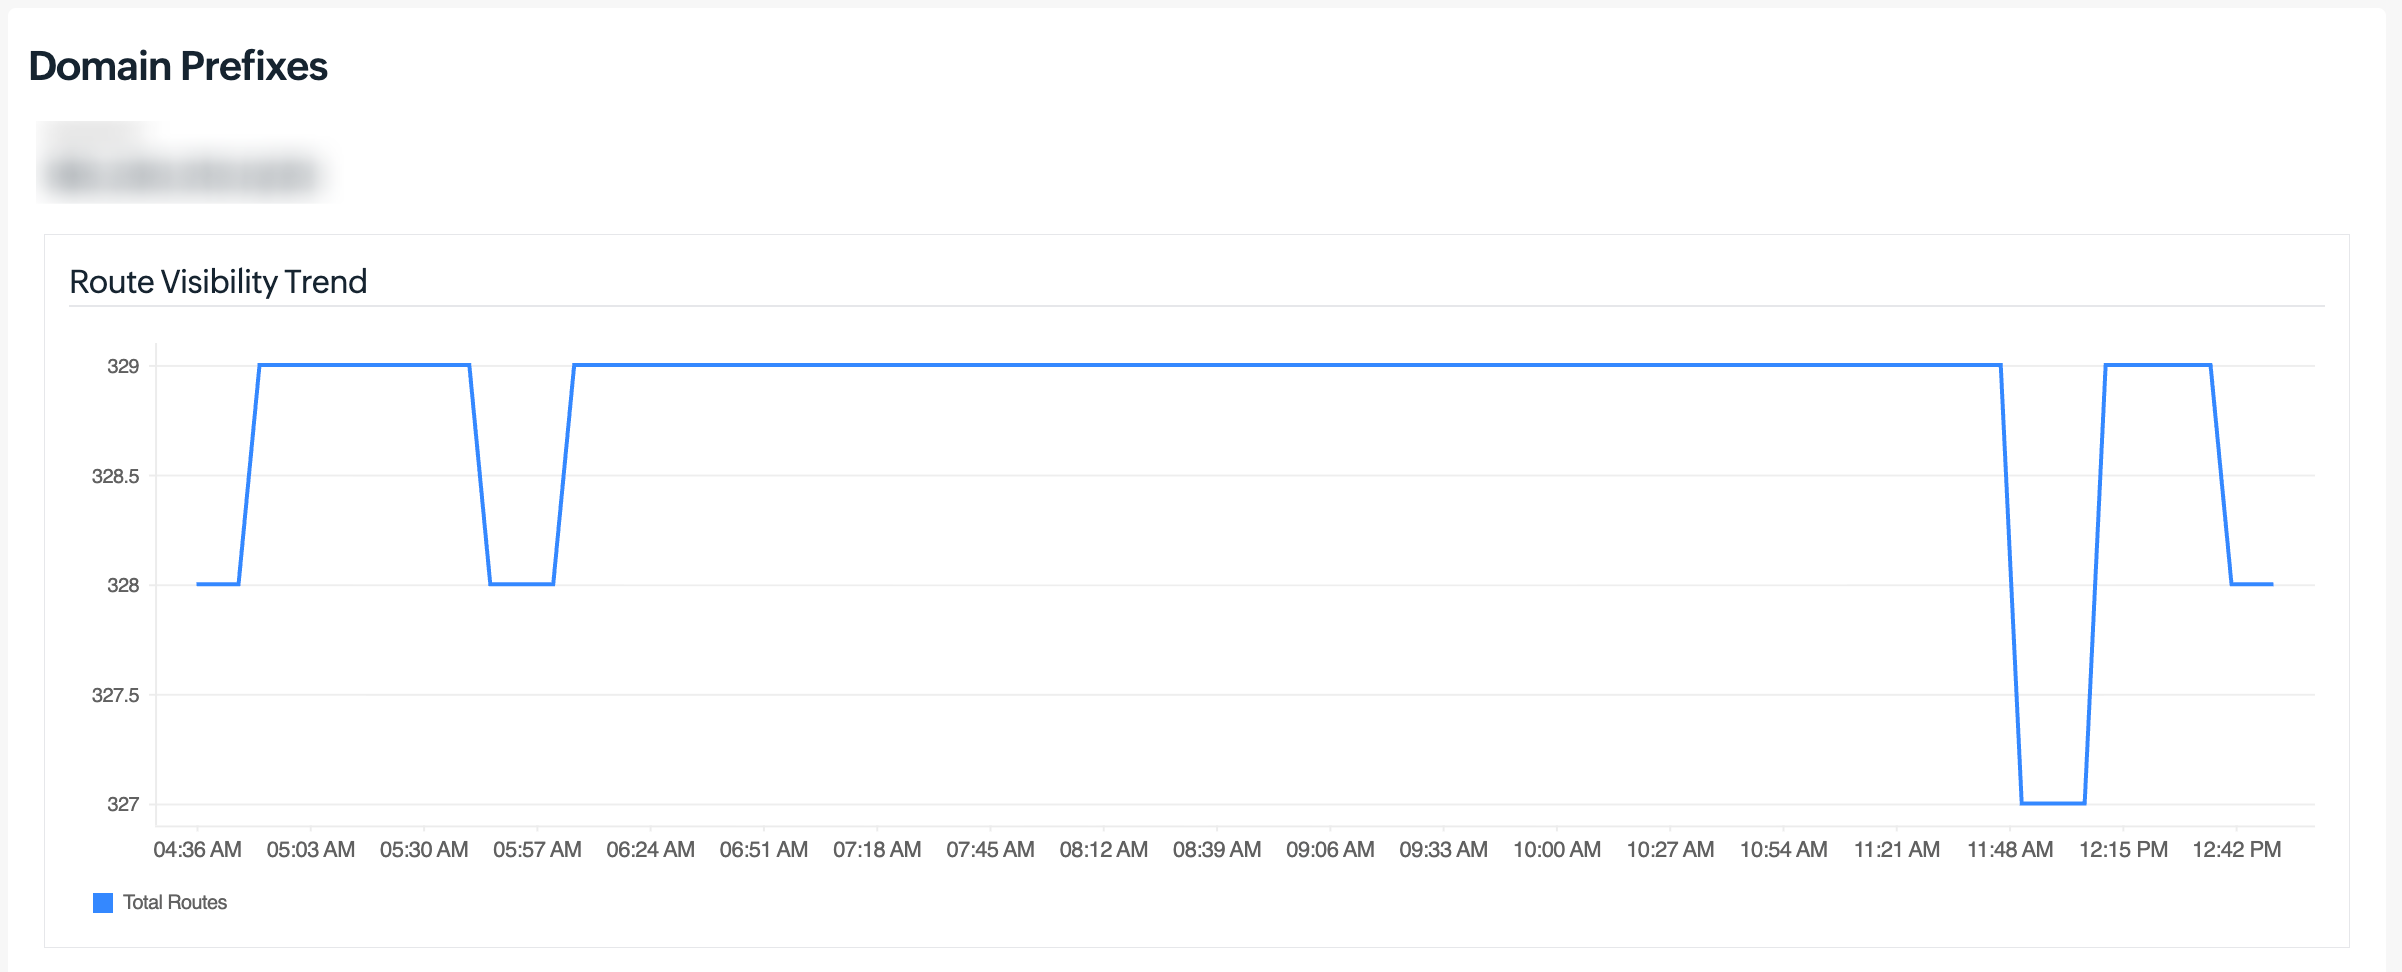
The Route Visibility Trend graph shows how the total number of BGP routes observed for the selected IP prefix changes over time. Hover over the graph to view the total routes recorded at a specific time. Use this trend to identify changes in route visibility that may require further investigation.
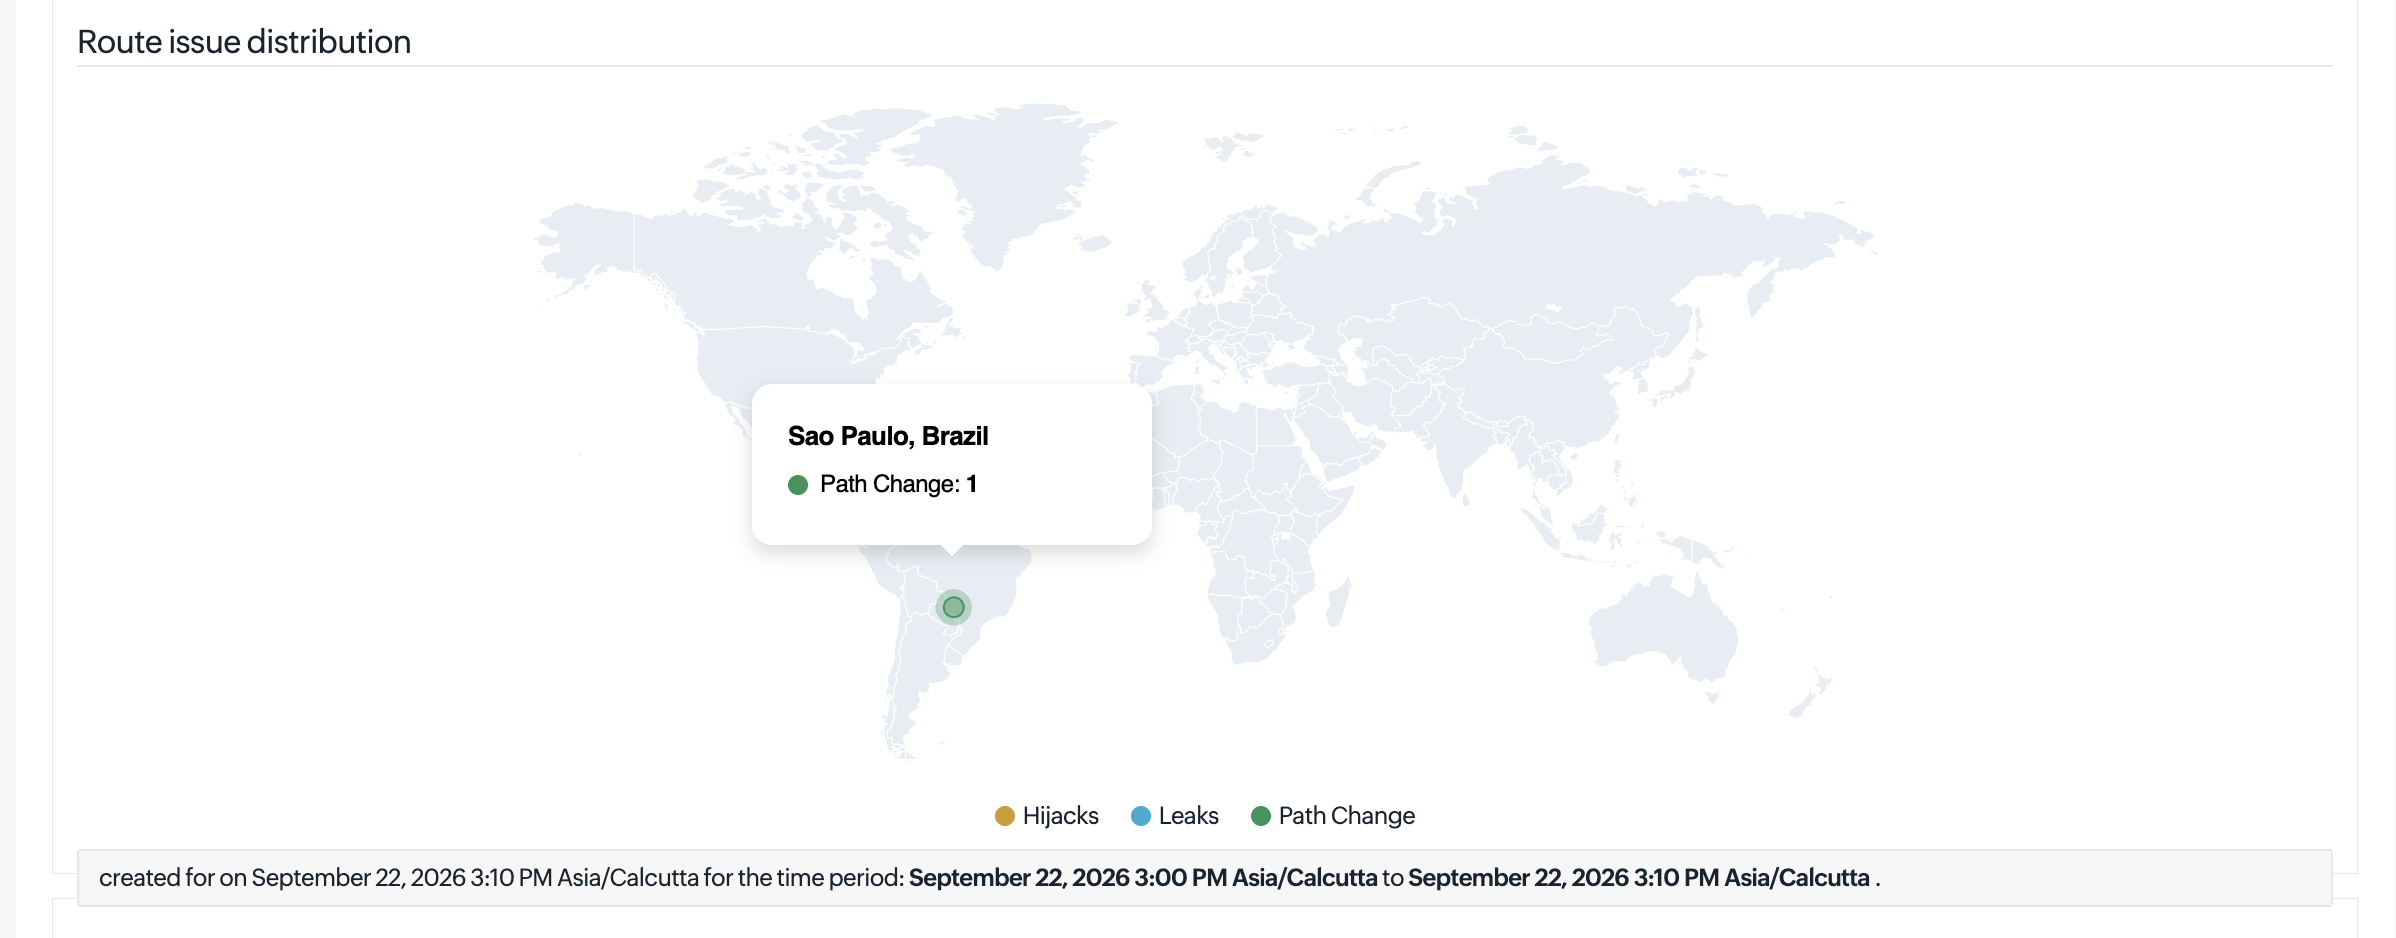
Route Issue Distribution
The Route Issue Distribution map provides a geographical view of BGP routing issues detected across global vantage points. It displays the location and number of Hijacks, Leaks, and Path Changes detected for the selected IP prefix. Hover over a location to view the type and count of issues detected from that location. The map is updated every 10 minutes with the latest routing issue data.
Prefix Details
The Prefix Details section provides the current routing information for the monitored IP prefix.
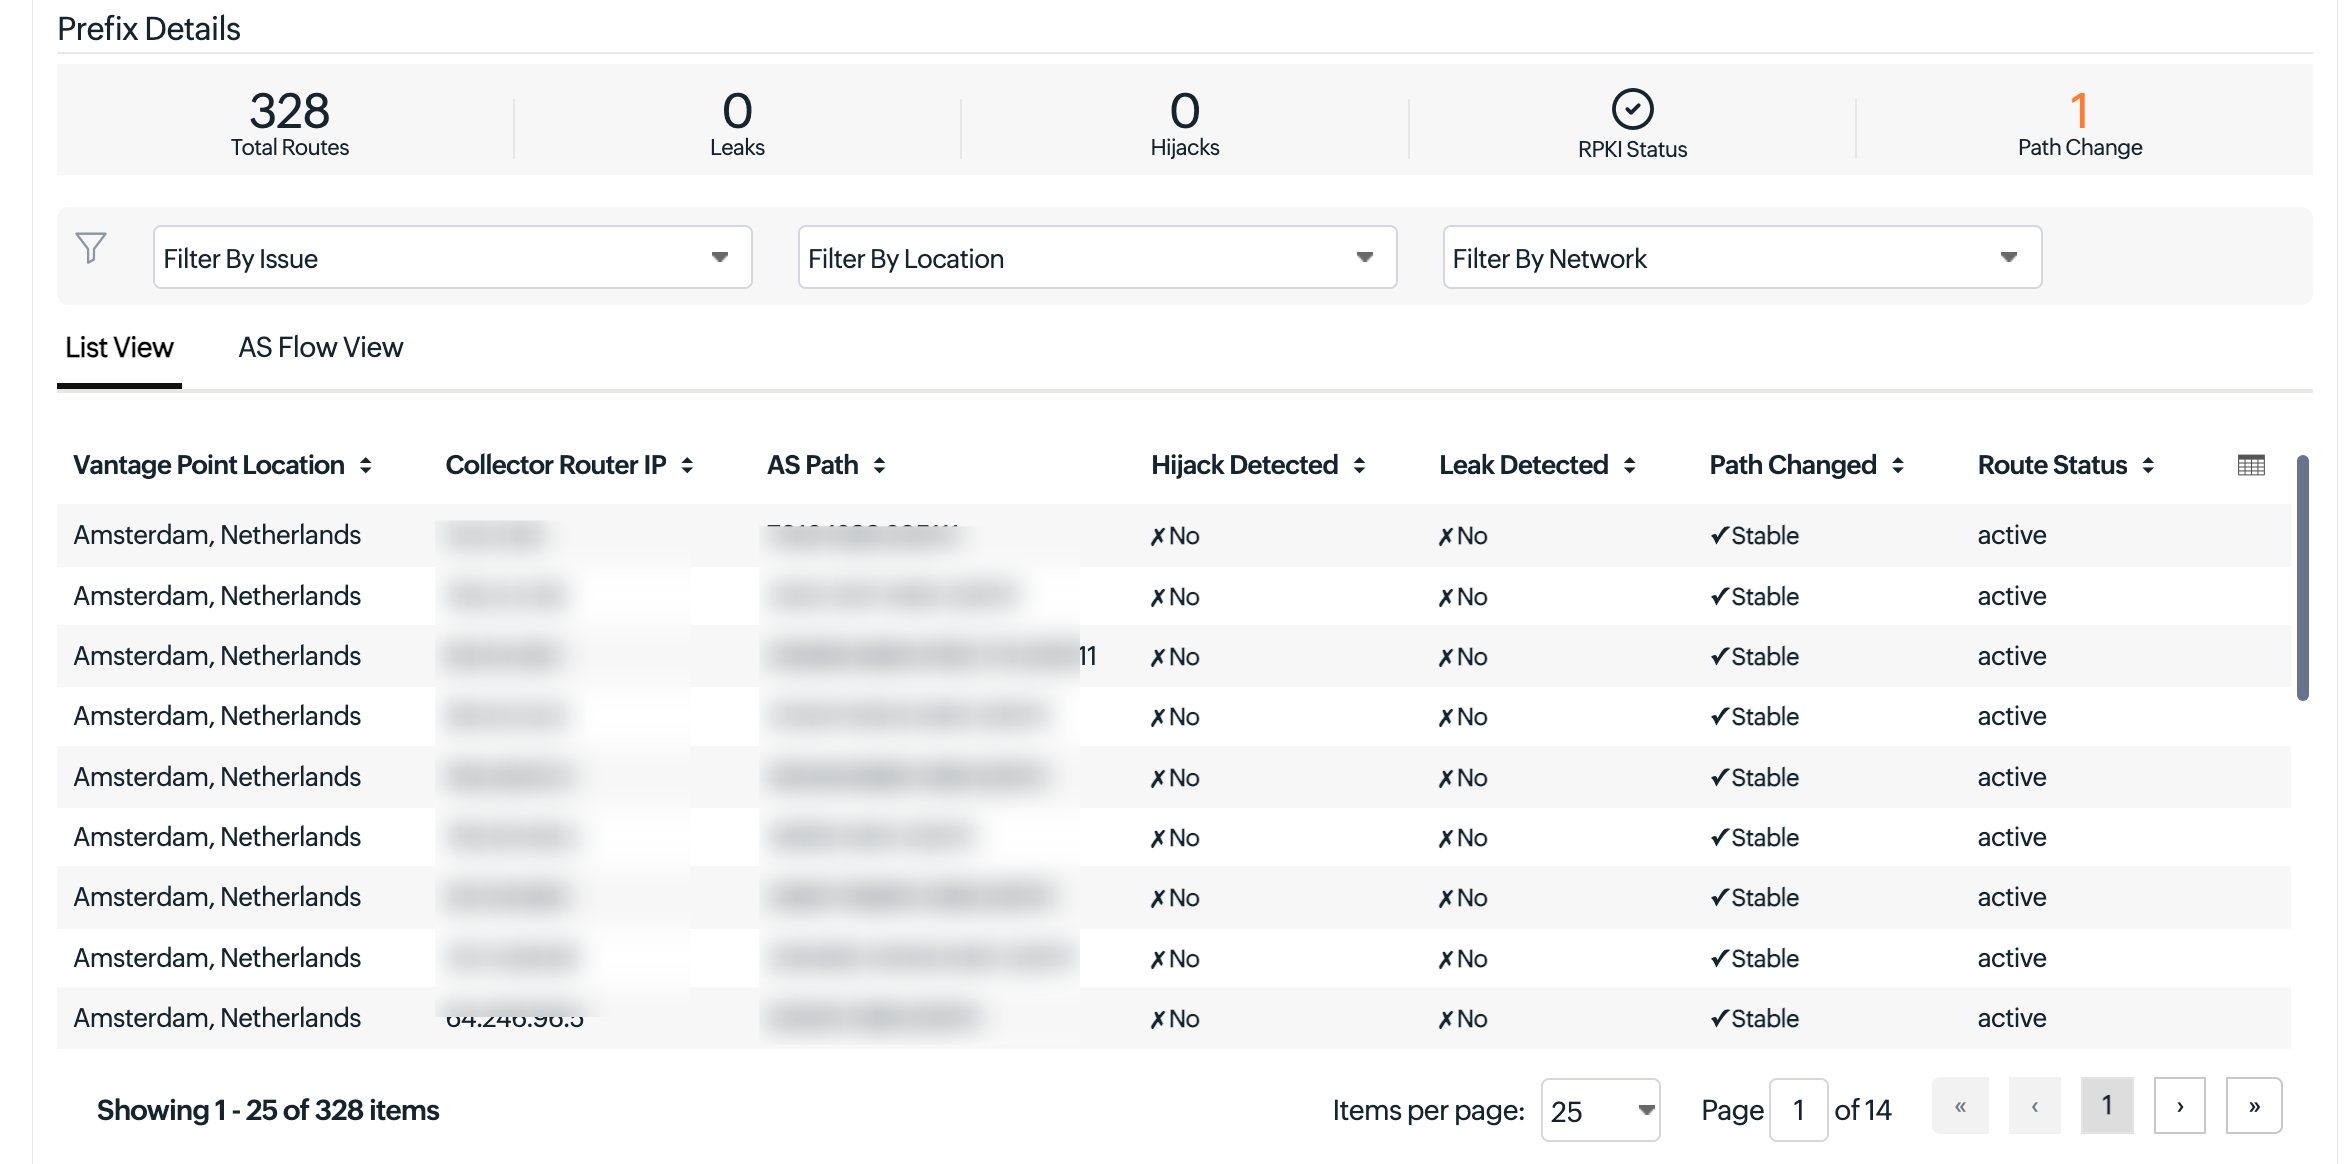
|
Metric |
Description |
|---|---|
| Total Routes | The total number of BGP routes currently observed for the monitored prefix across the available vantage points. |
| Leaks | The number of route leaks currently detected for the prefix. |
| Hijacks | The number of route hijacks currently detected for the prefix. |
| RPKI Status | Indicates whether the prefix has a valid RPKI Route Origin Authorization (ROA). Status values include Valid, Invalid, or Not Found. |
| Path Change | The number of AS path changes recorded for the prefix in the current view period. |
You can narrow down the data by filtering by issues, hijacks, leaks, and changes.
The Prefix Details section has the following views:
- List View
- AS Flow View
List View
The List View tab presents a tabular breakdown of all BGP routes observed for the prefix, organized by vantage point. Each row represents a single route observation from a specific location.
Metric
Description
Vantage Point Location The geographic location of the BGP collector that observed this route (e.g., Amsterdam, Netherlands). Multiple rows from the same location indicate routes observed via different collector routers or AS paths. Collector Router IP The IP address of the BGP collector router at the vantage point that received and recorded this route announcement. AS Path The sequence of ASNs through which the route announcement traveled to reach this vantage point. The rightmost ASN is the origin AS.
Unexpected ASNs in this path may indicate a hijack or route leak.Hijack Detected Indicates whether a BGP hijack was detected for this specific route observation. No means no hijack; Yes signals a potential unauthorized origin. Leak Detected Indicates whether a route leak was detected for this route.
A leak is recorded when a route is propagated to a peer that should not be receiving it.Path Changed Shows whether the AS path for this route differs from the previously observed path. Stable means the path has not changed; a change indicator means the path was updated during the monitoring period. Other possible path changes include Changed. Route Status The current status of the route at this vantage point. Active means the route is currently being announced and observed. Other possible statuses include Withdrawn (route removed from BGP table) and Inactive.
View detected route issue details
When an issue such as a hijack is detected, click the corresponding route entry to view detailed information about the detected issue and the route.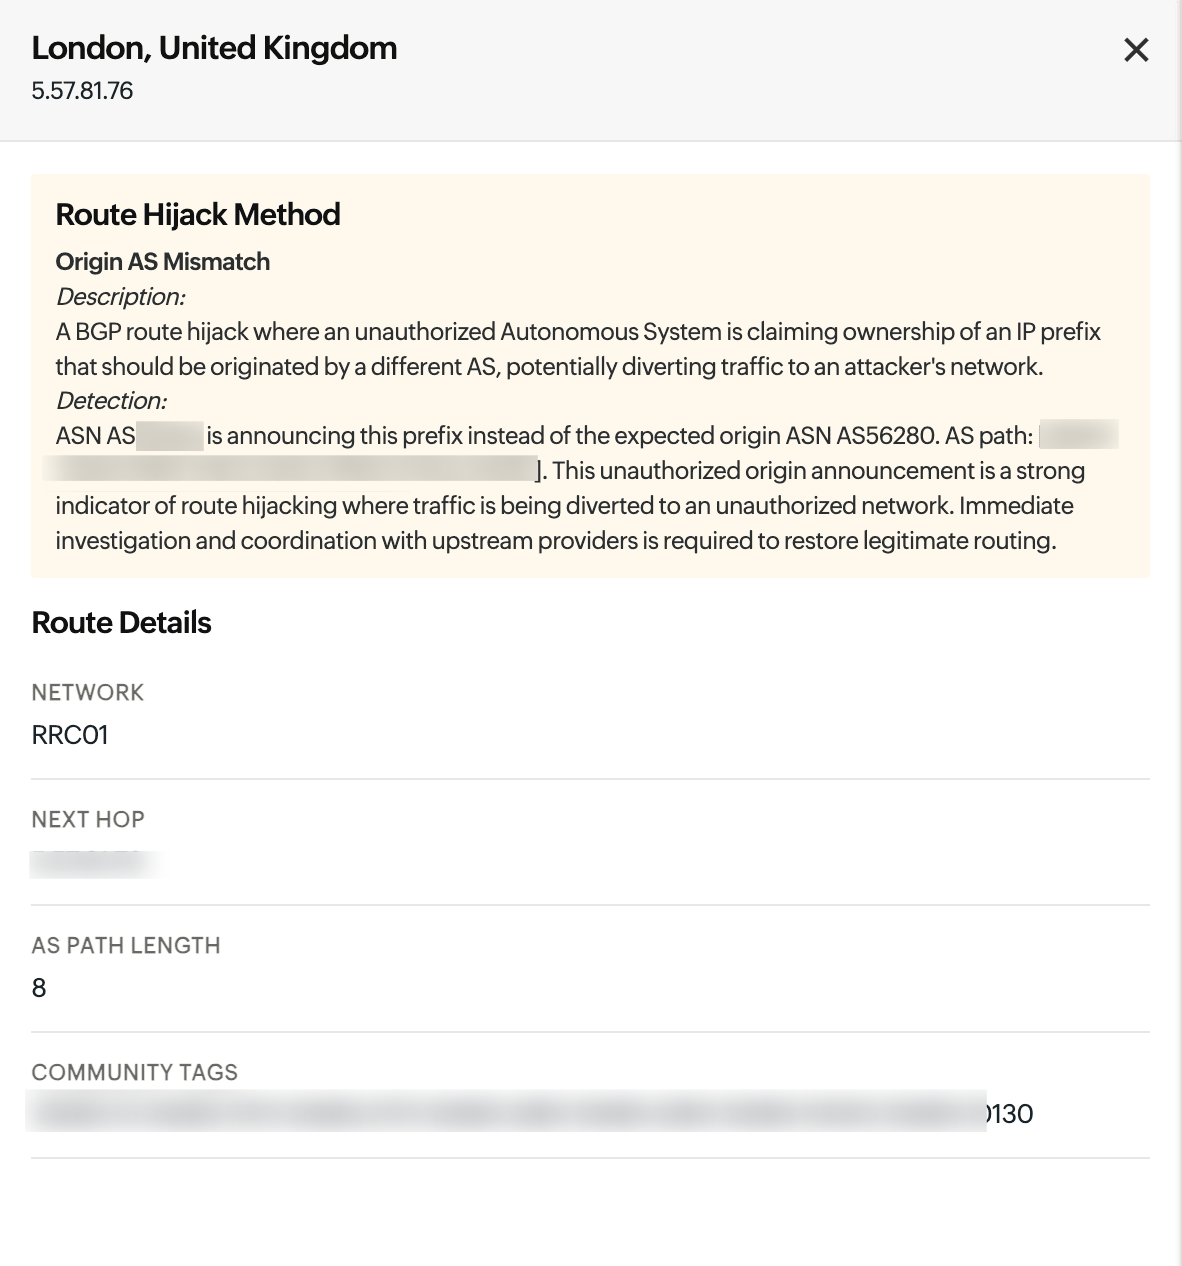
For a detected hijack, the details panel displays the Route Hijack Method, such as Origin AS Mismatch, along with a description and detection details. This helps you understand why Site24x7 identified the route as a potential hijack.
The Route Details section displays additional information, including:- Network
- Next Hop
- AS Path Length
- Community Tags
AS Flow View
The AS Flow View visually represents how BGP route announcements propagate through different Autonomous Systems from the collector routers toward the Origin AS. This helps you understand the route topology and identify unexpected ASs or routing-path deviations.
You can search for a network, location, IP address, or address name in the Highlight search box, and the matching name will be highlighted.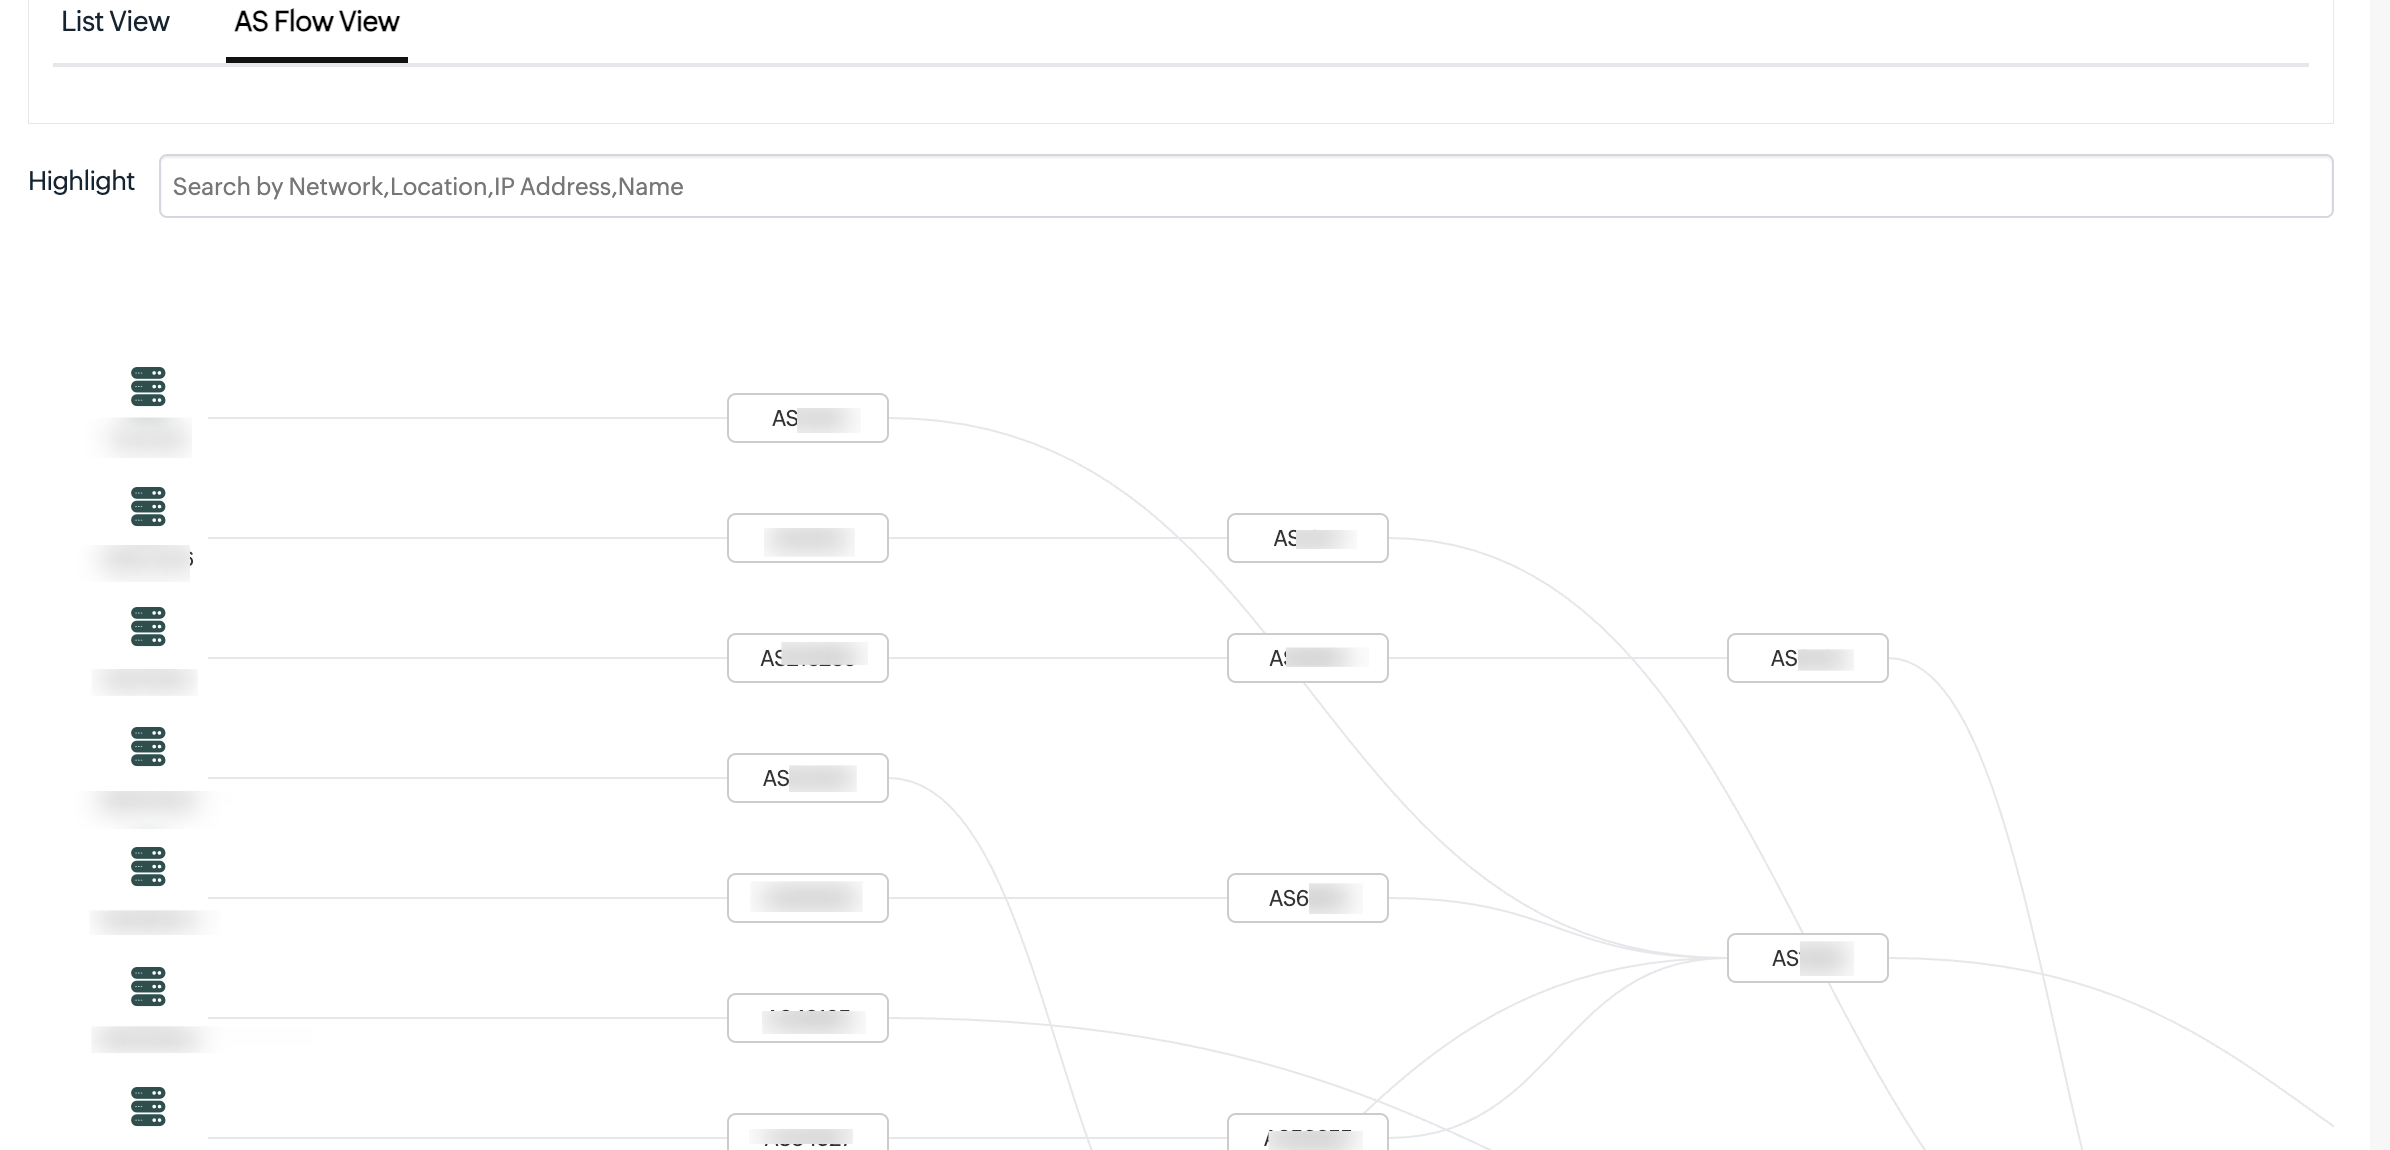
Outages tab
The Outages tab records all instances where the monitored prefix became unavailable or experienced a critical routing anomaly. Each outage entry includes:
- Start and end timestamps of the outage
- Total outage duration
- The reason or event type that triggered the outage status
- Comments, if any
From the outage list, you can use the hamburger icon [icon] on each record to:
- Mark as Maintenance: Reclassify an outage as a planned maintenance window.
- Add / Edit Comments: Annotate the outage with context or resolution notes.
- Delete: Remove the outage record permanently.
Notes tab
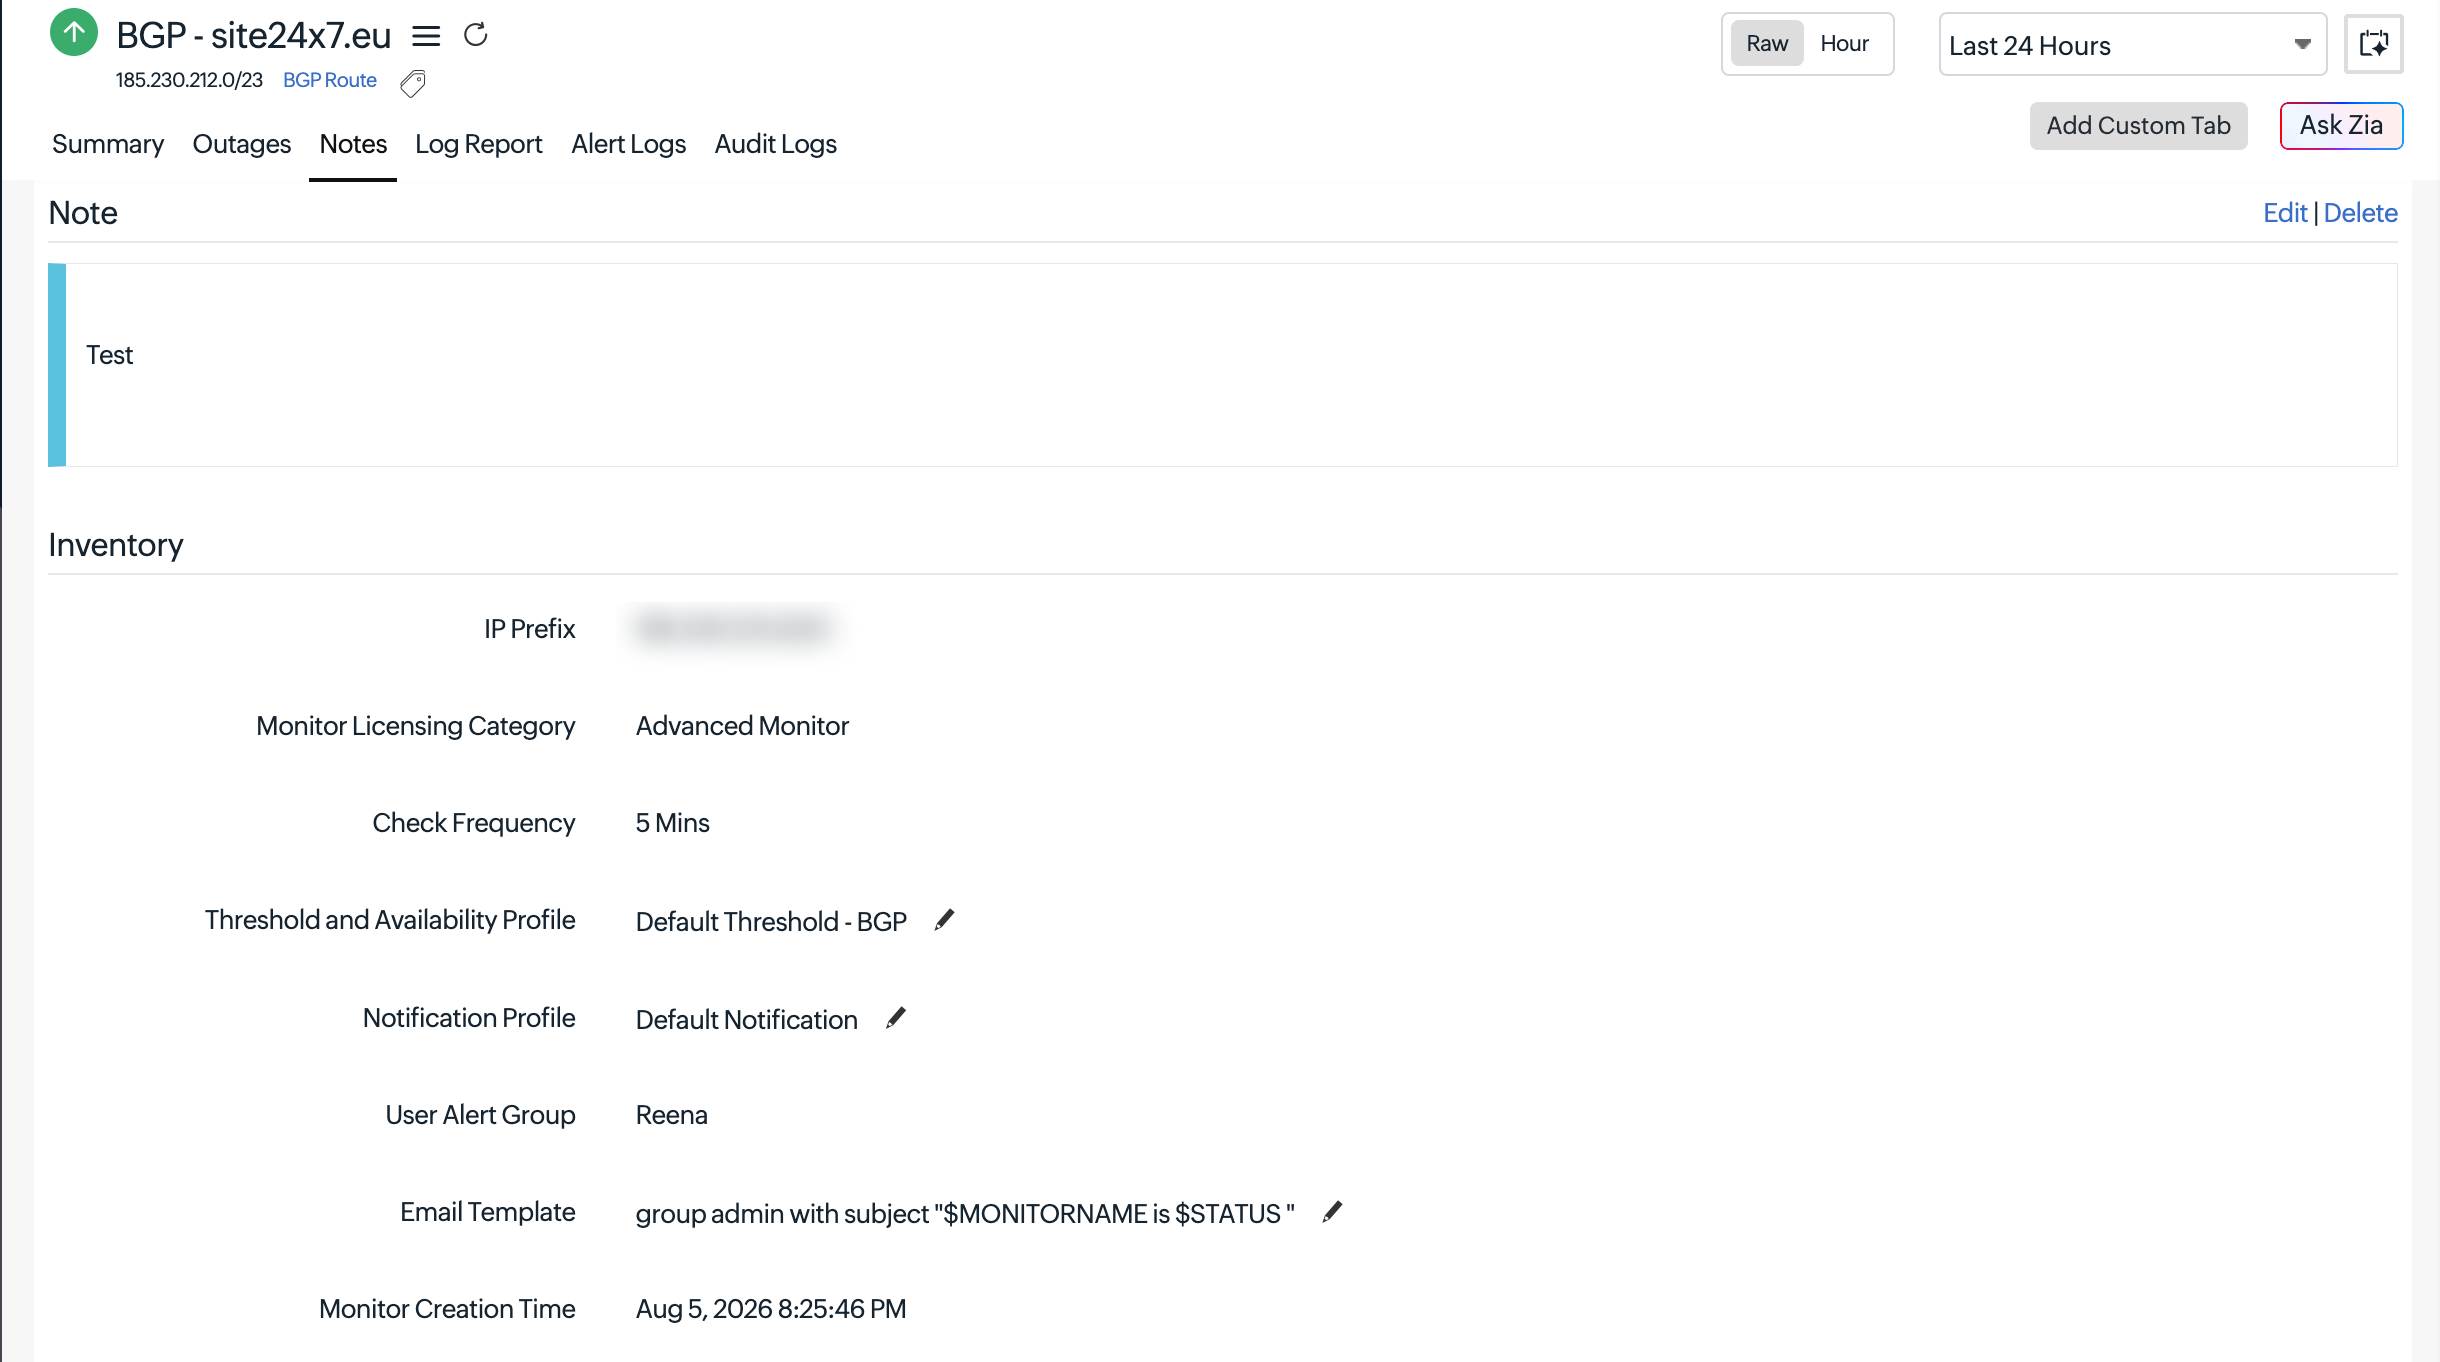
The Notes tab allows you to create and manage free-text annotations associated with the BGP Route monitor. Notes are useful for recording observations, documenting changes to routing policy, or logging follow-up actions after an incident.
Click Add Note to attach a brief note to the monitor.
Inventory
The Notes tab also surfaces the Inventory section, which captures the monitor's core configuration settings for quick reference. This includes Domain Name, Monitor Licensing Category, Check Frequency, Threshold and Availability Profile, Notification Profile, User Alert Group, Monitor Creation Time, and Last Modified Time.
Log Report
The Log Report tab provides a detailed, time-series history of all BGP routing poll results for the monitored domain. Each row corresponds to a single collection cycle, giving you a granular view of how routing metrics evolved over the selected period.
You can filter the report based on the date and time range and availability.
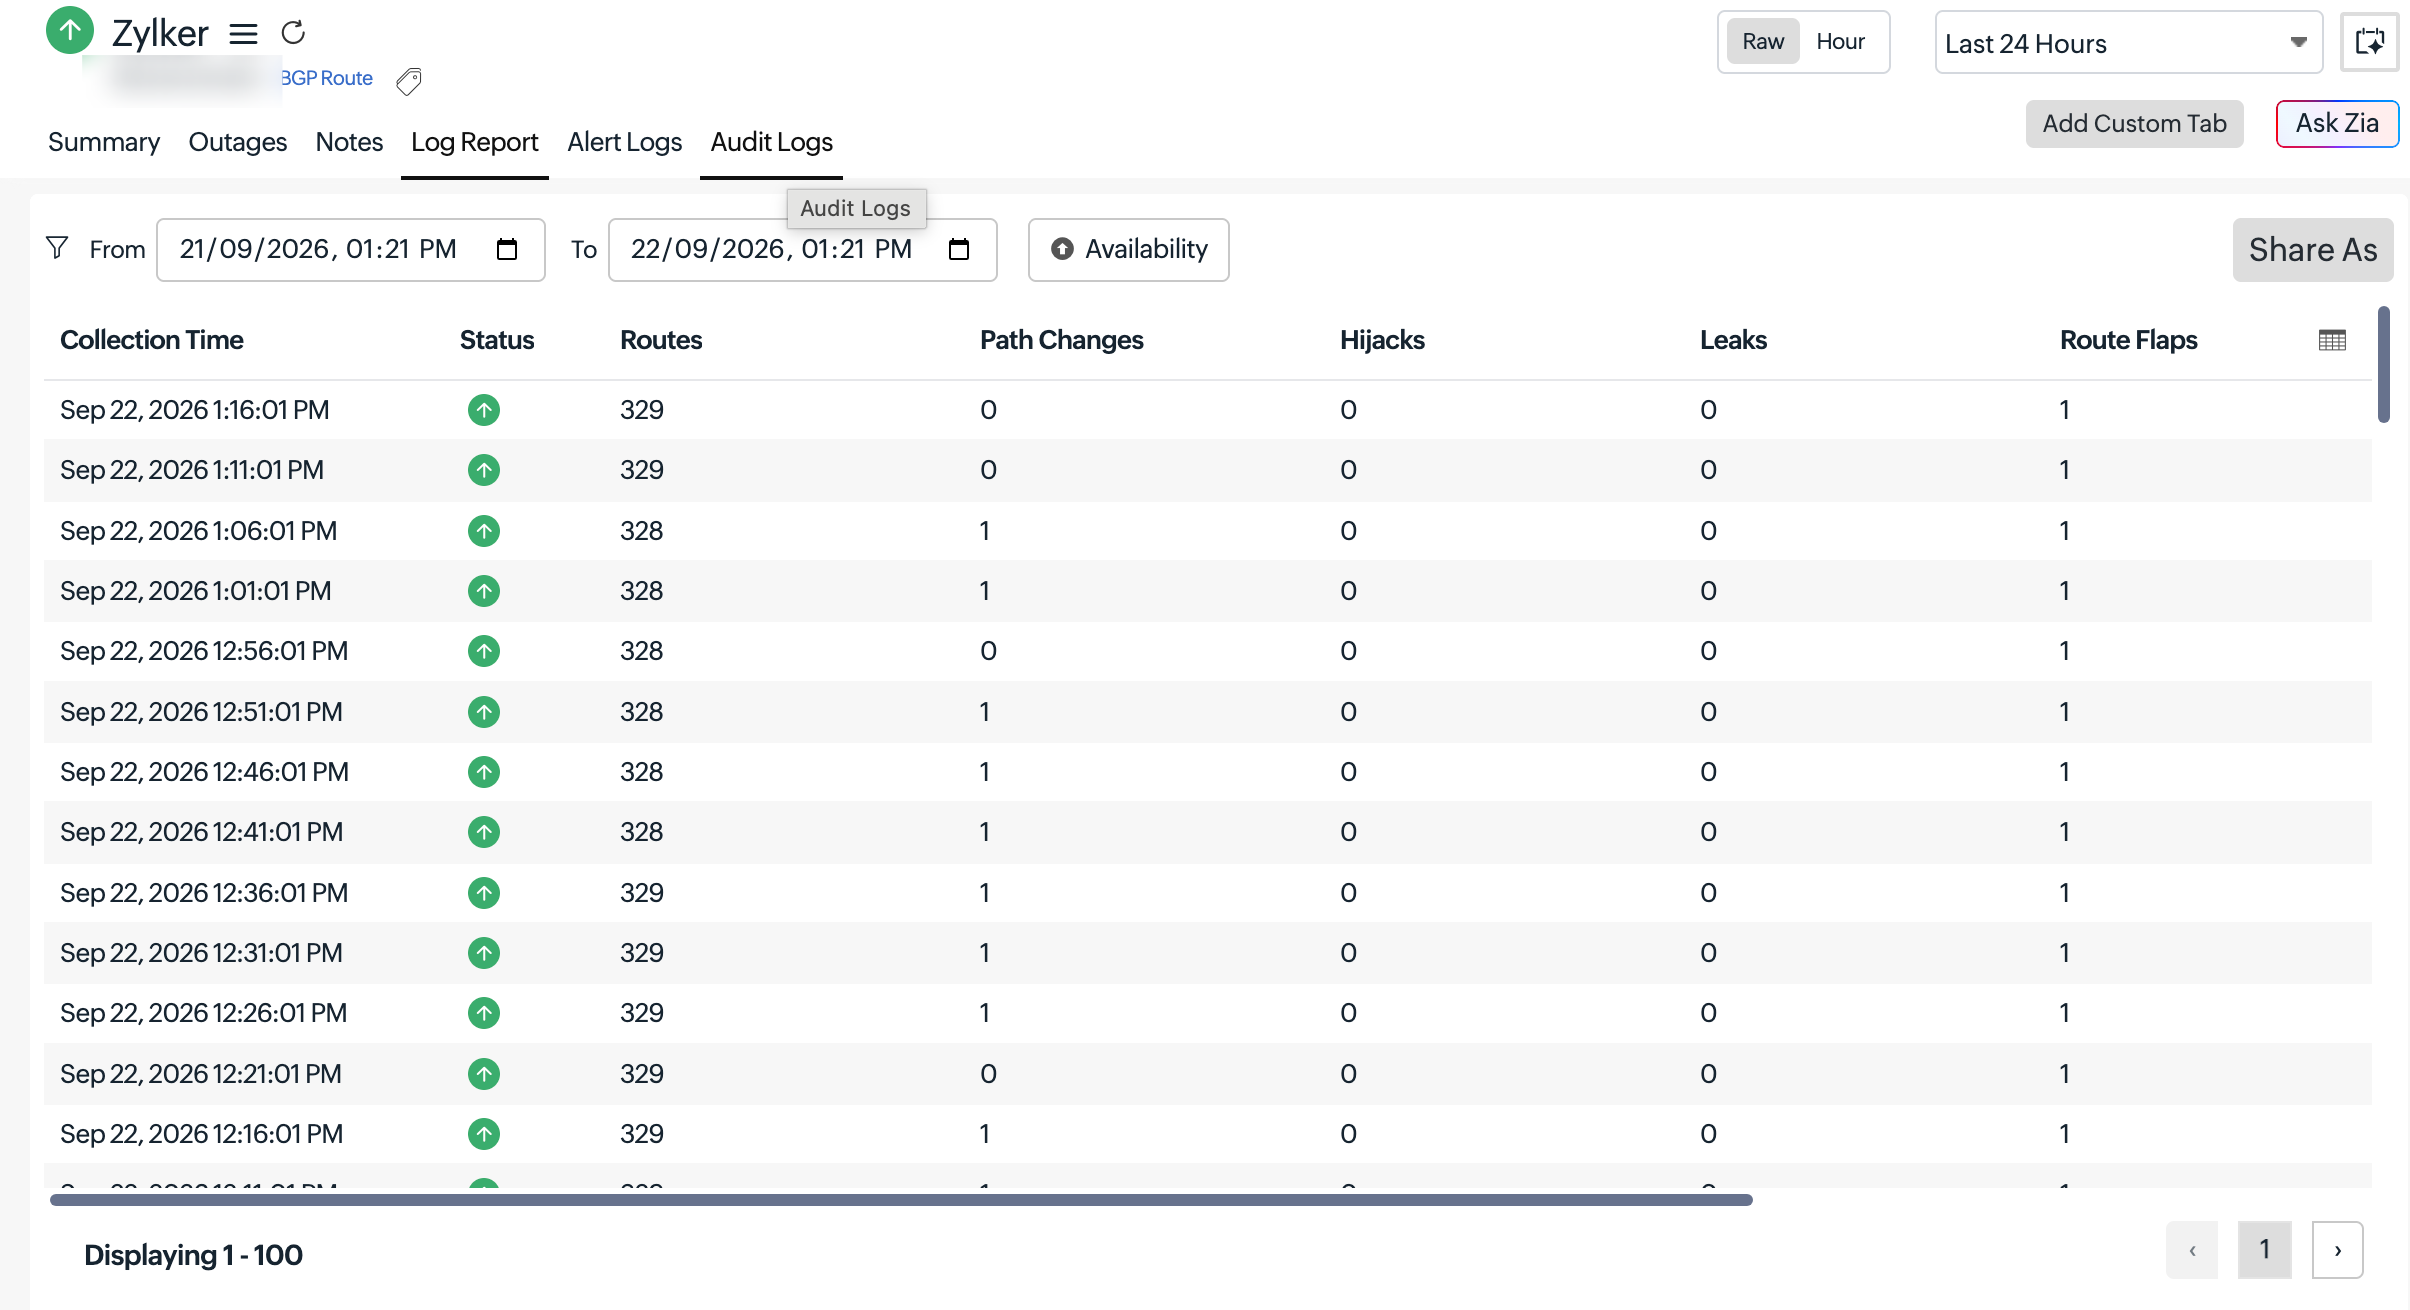
Log table columns
Each row in the log table represents one BGP data collection event. The columns are:
| Metric | Description |
|---|---|
| Collection Time | The exact timestamp when Site24x7 collected the BGP routing data for this poll cycle. |
| Status (icon) | A color-coded status icon indicating the health state at the time of collection. |
| Status (text) | The textual label of the monitor's health state at the time of collection. Possible values include Up, Trouble, Critical, and Down. |
| Prefixes | The number of IP prefixes (IPv4 or IPv6) associated with the monitored domain that were observed during this collection cycle. |
| Routes | The total number of active BGP routes visible across all vantage points for the monitored prefix at the time of collection. |
| Path Changes | The number of AS path changes recorded during this collection cycle. A value of 0 means the routing paths were stable; a non-zero value indicates that one or more vantage points observed a different AS path compared to the previous poll. |
| Hijacks | The number of BGP hijack events detected during this collection cycle. |
| Leaks | The number of route leak events detected during this collection cycle. |
| Route Flaps | The number of times the BGP route was withdrawn and re-announced (flapped) during this collection interval. |
| RPKI Valid | The number of routes for the monitored prefix that have a valid RPKI ROA at this collection time. |
| RPKI Invalid | The number of routes that failed RPKI validation, meaning an ROA exists but the origin AS or prefix length does not match. |
Alert logs
Gain a comprehensive overview of all alerts generated by Site24x7 using alert logs. Easily track key details such as the monitored resource name, alert trigger time, root cause, and notification status.
Learn more about alert logs.
Audit logs
Audit logs help you monitor configuration changes, user activities, and API actions performed in your account. Learn more.