
Topology View for Huawei Cloud monitoring
The Topology View is a visual map of your entire Huawei Cloud environment in a single, organized hierarchy. See the full scale of your cloud environment without navigating through separate service consoles or accounts.
By visualizing your infrastructure and resources dependencies, you can correlate to one another, helping you assess the blast radius of changes. A clear hierarchical line of sight can streamline management and resolve issues faster.
How it works
The Topology View displays your monitored Huawei Cloud resources as an interactive visual representation of your cloud infrastructure. Resources are organized into the following levels:
- Huawei Cloud account level: Represents each Huawei Cloud account you've authenticated with Site24x7.
- Region level: Groups resources geographically based on the Huawei Cloud region in where they are deployed or hosted.
- Service type level: Organizes resources by Huawei Cloud service, such as ECS, EVS, VPC, and RDS for MySQL, within each region for easier navigation and health monitoring.
Use case
A financial services organization hosts its transaction-processing applications on Huawei Cloud across multiple regions to comply with data residency requirements and deliver low-latency services. During a peak settlement period, the operations team notices an increase in transaction failures.
Rather than checking the health of each Huawei Cloud service individually, the team opens the Topology View in Huawei Cloud monitoring. The visual hierarchy immediately highlights a critical status in the AP-Bangkok region of the production account. By expanding the affected region, they quickly identify that an RDS for MySQL instance is experiencing a critical issue.
With the affected resource clearly identified, the team investigates the database, resolves a connection pool exhaustion issue, and restores the normal application performance in minutes. The Topology View enables the IT team to pinpoint the problem quickly, reducing troubleshooting time and minimizing the impact on business operations.
Benefits of the Topology View
The Topology View provides the following benefits:
- Unified infrastructure view: Visualize all your monitored Huawei Cloud accounts, regions, and services in a single interactive topology map.
- Faster issue identification: Quickly identify affected services and regions with color-coded health indicators, reducing troubleshooting time.
- Simplified resource navigation: Easily locate and access specific resources without switching between multiple dashboards.
- Improved operational visibility: Monitor the health and distribution of resources across accounts and regions from a centralized view.
How to access the topology view
To leverage the Topology View, follow the steps below:
- Navigate to Cloud > Huawei. Select the required Huawei monitor.
- Click Topology View on the left menu.
Interacting with the Topology View
Once you have accessed the topology view, you can utilize the actions below:
Root node
When you open the Topology View, your Huawei Cloud account appears as the root node and is highlighted by double circles. The view automatically centers and zooms in on the account, providing a starting point for exploring your cloud resources.
Radial node layout
The nodes, then branches out from your central account node to represent different Huawei Cloud regions, which then expand into specific service types. This circular layout makes it easy to trace paths from your top-level account down to individual resources.
Zoom and pan
Navigate large topologies easily by using your mouse or the on-screen controls to zoom in and pan across the canvas.
Explore a region
Zoom in and select a region in the topology graph to view its underlying resources and connection flow.
Health status legend
A legend panel explains the color codes used across the topology graph. Each node is color-coded so you can assess resource health at a glance (e.g., Normal, Warning, or Critical).
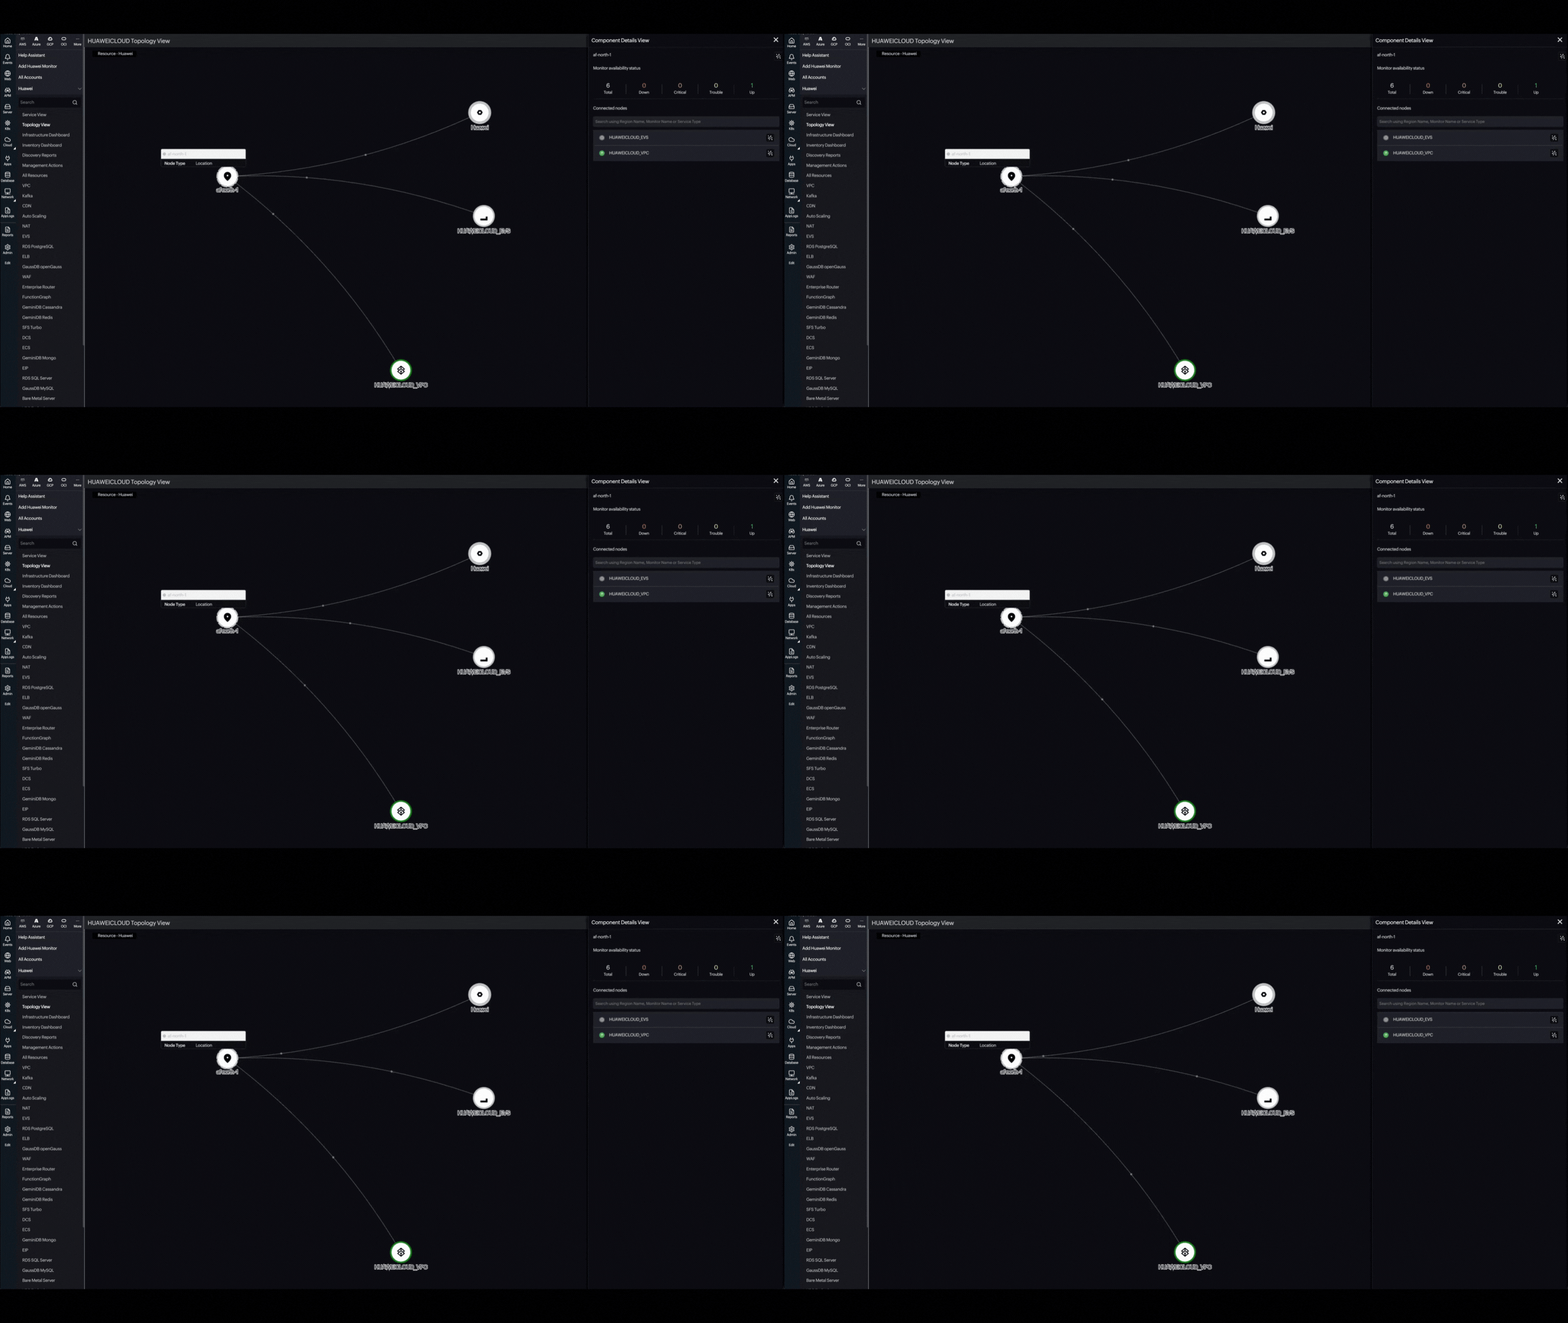
Component Details panel
When you select a node, the panel on the right provides the following details:
- Region or service name: Displays the name of the selected component.
- Click the View Connections icon
 next to the name to focus exclusively on that item and its connected nodes.
 - Click the Open in New Tab icon
 next to a service type to open its detailed monitor summary page.
- Click the View Connections icon
- Availability status: Shows real-time monitoring counts, broken down by status: Up, Trouble, Critical, and Down, alongside total monitored resources.
- Connected nodes: Displays the panel details and select a service type (such as ECS or RDS) to instantly view its health status and configuration details.
- Search bar: Quickly filter and locate a specific region, service, or individual monitor within the panel.
- Breakdown List: Lists underlying regions or services with their associated health status icons, making it easy to spot failing components.
By visualizing dependencies and relationships between your Huawei Cloud resources, you can quickly assess the impact on connected services. This speeds up root cause analysis and makes troubleshooting across your infrastructure more efficient.