
A step-by-step guide to monitor networks in Site24x7
ManageEngine Site24x7 is our AI-powered observability platform for DevOps and ITOps that helps predict, analyze, and troubleshoot problems with applications, microservices, servers, containers, and the end-user experience, as well as multi-cloud and network infrastructures—all from a single console.
Site24x7's network monitoring features enhance your visibility into your networks. You can chose to opt for complete network observability by tracking device availability and performance, traffic, and configurations or selectively observe each aspect as per your need.
Overview of Site24x7's network monitoring
Site24x7 offers a comprehensive network monitoring toolset, providing you the features you need. But first, you have to add your devices for monitoring. Here's a short guide to take you through the process.
Monitoring SNMP-enabled devices
Check prerequisites
Check out the prerequisites before getting started.
Add SNMP-enabled device or network
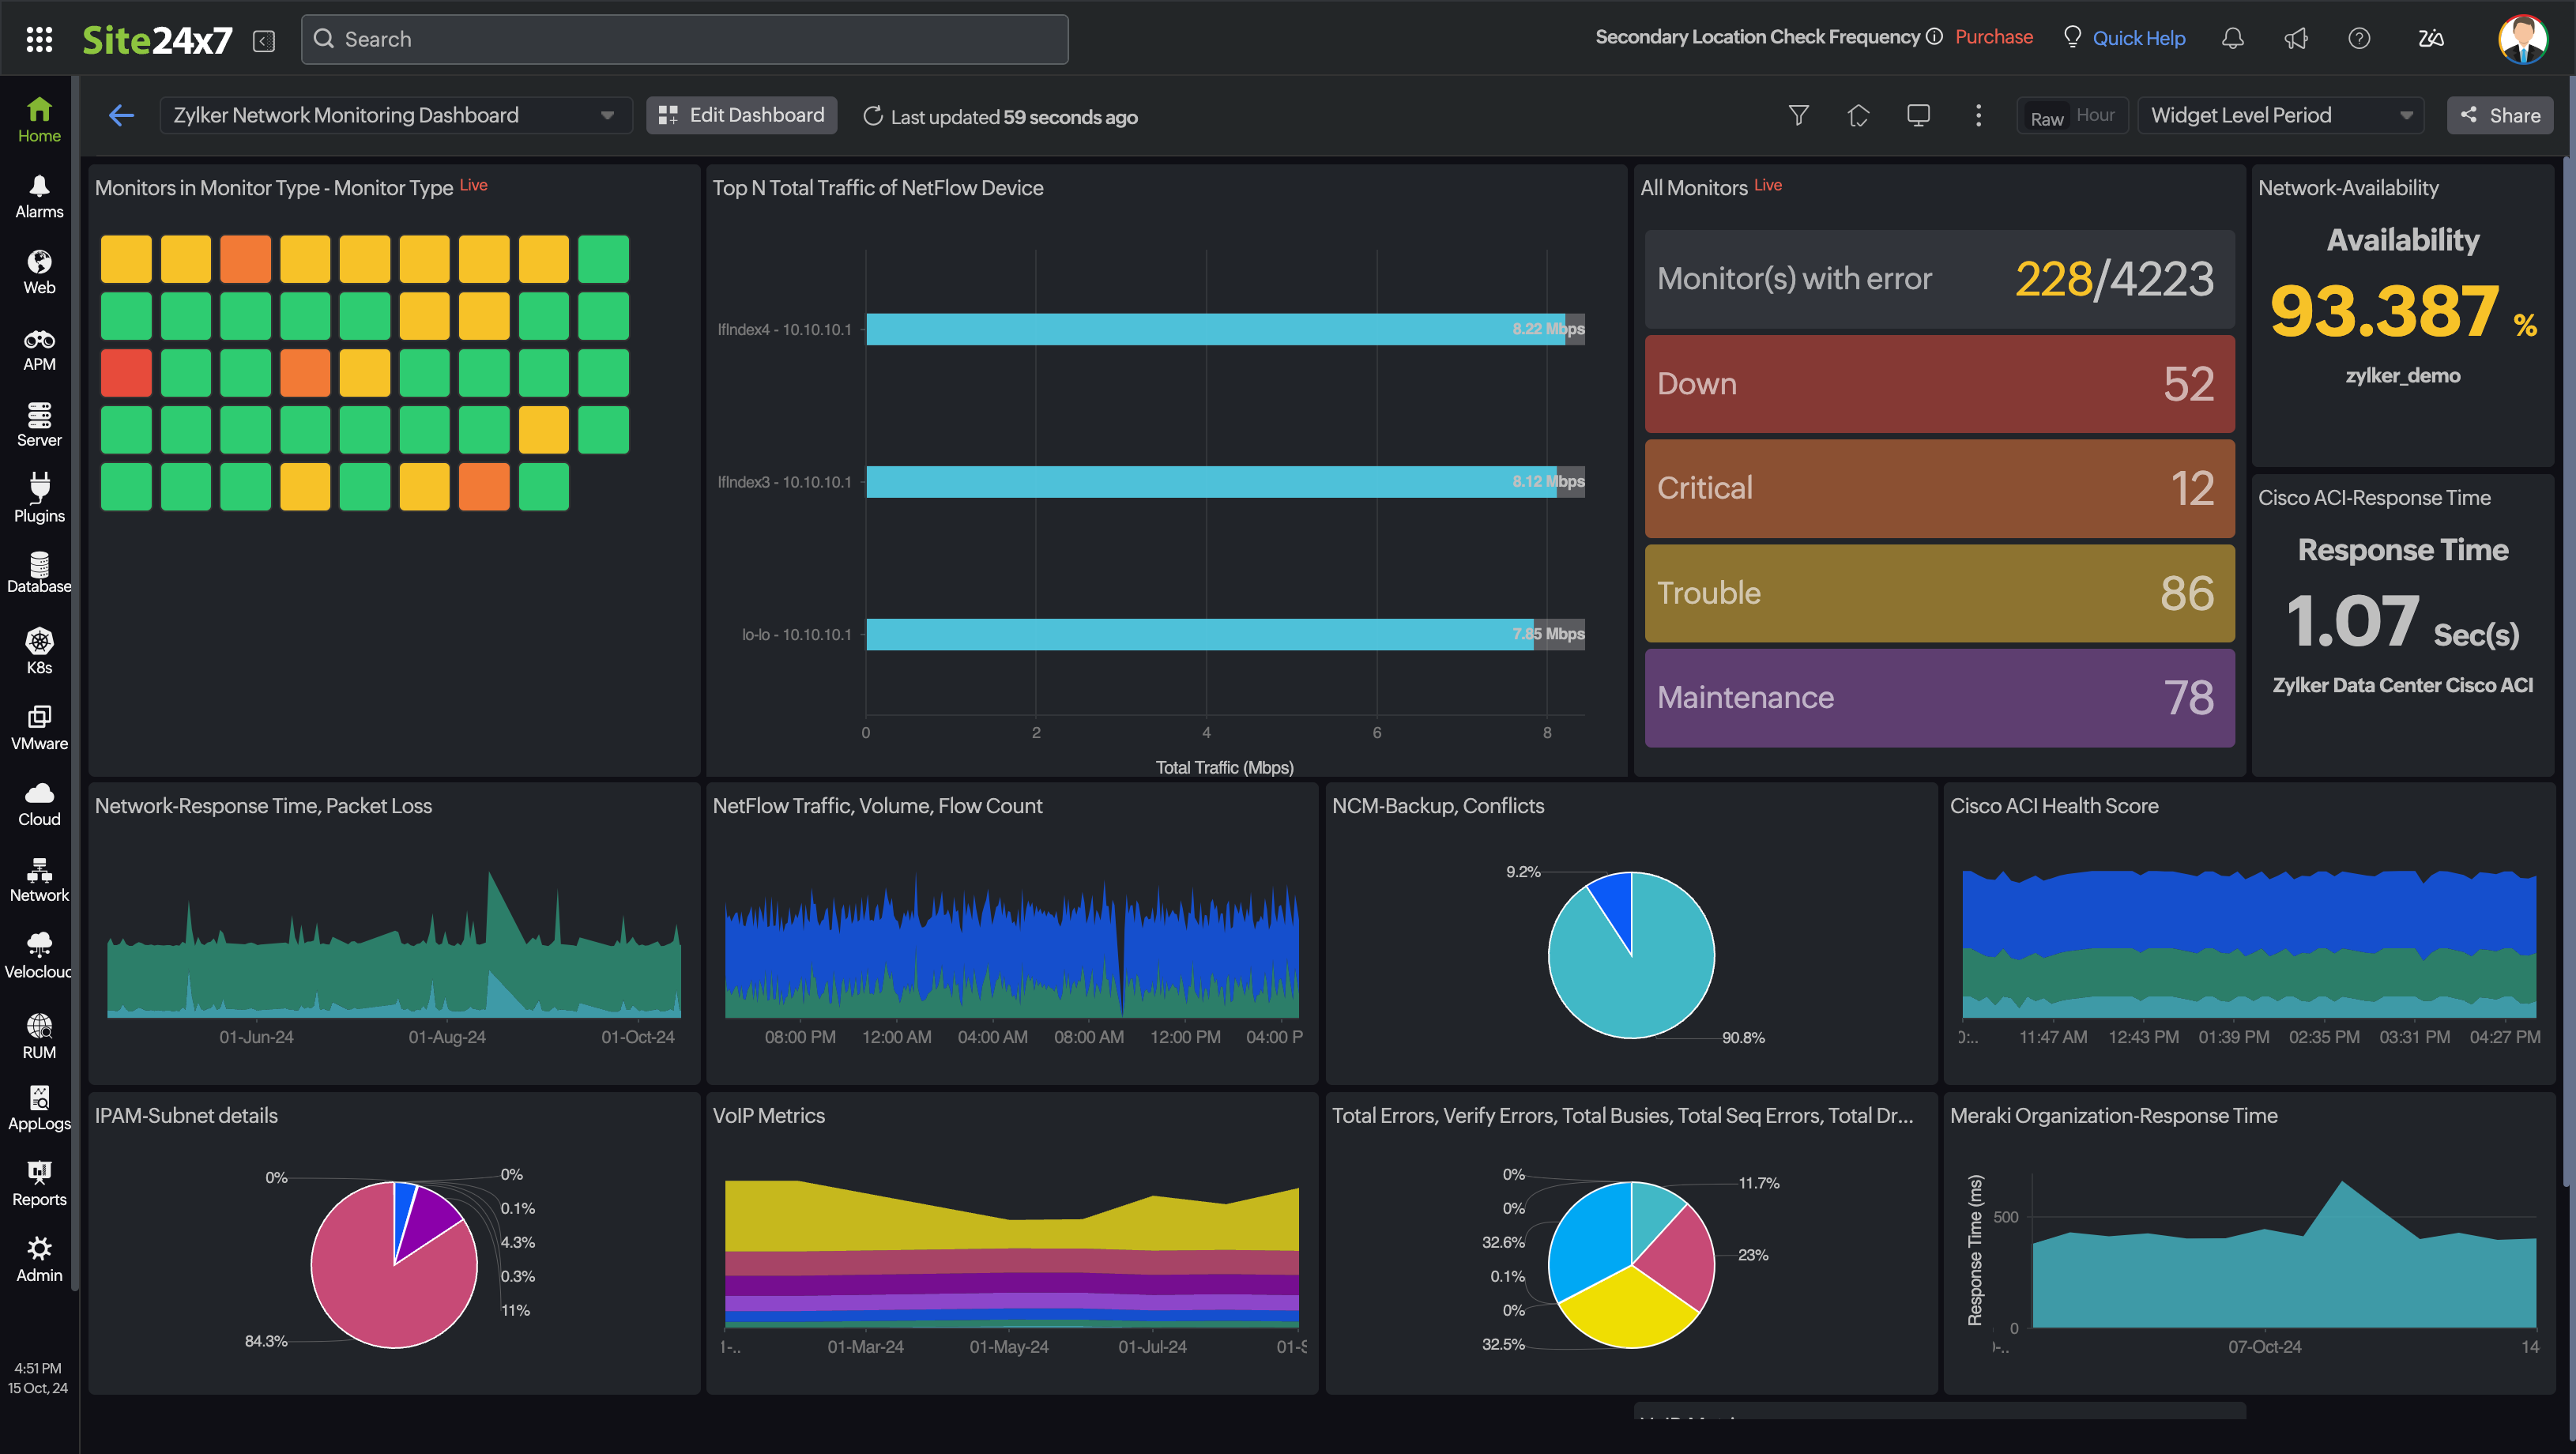
Add your SNMP-enabled device or the entire network for monitoring availability and performance. If your device is a wireless LAN controller, switch stack, or a router, you will see an extra tab within the monitor for relevant metrics.
You can now enable NetFlow and configuration management for the monitor.
Configure device to export flows
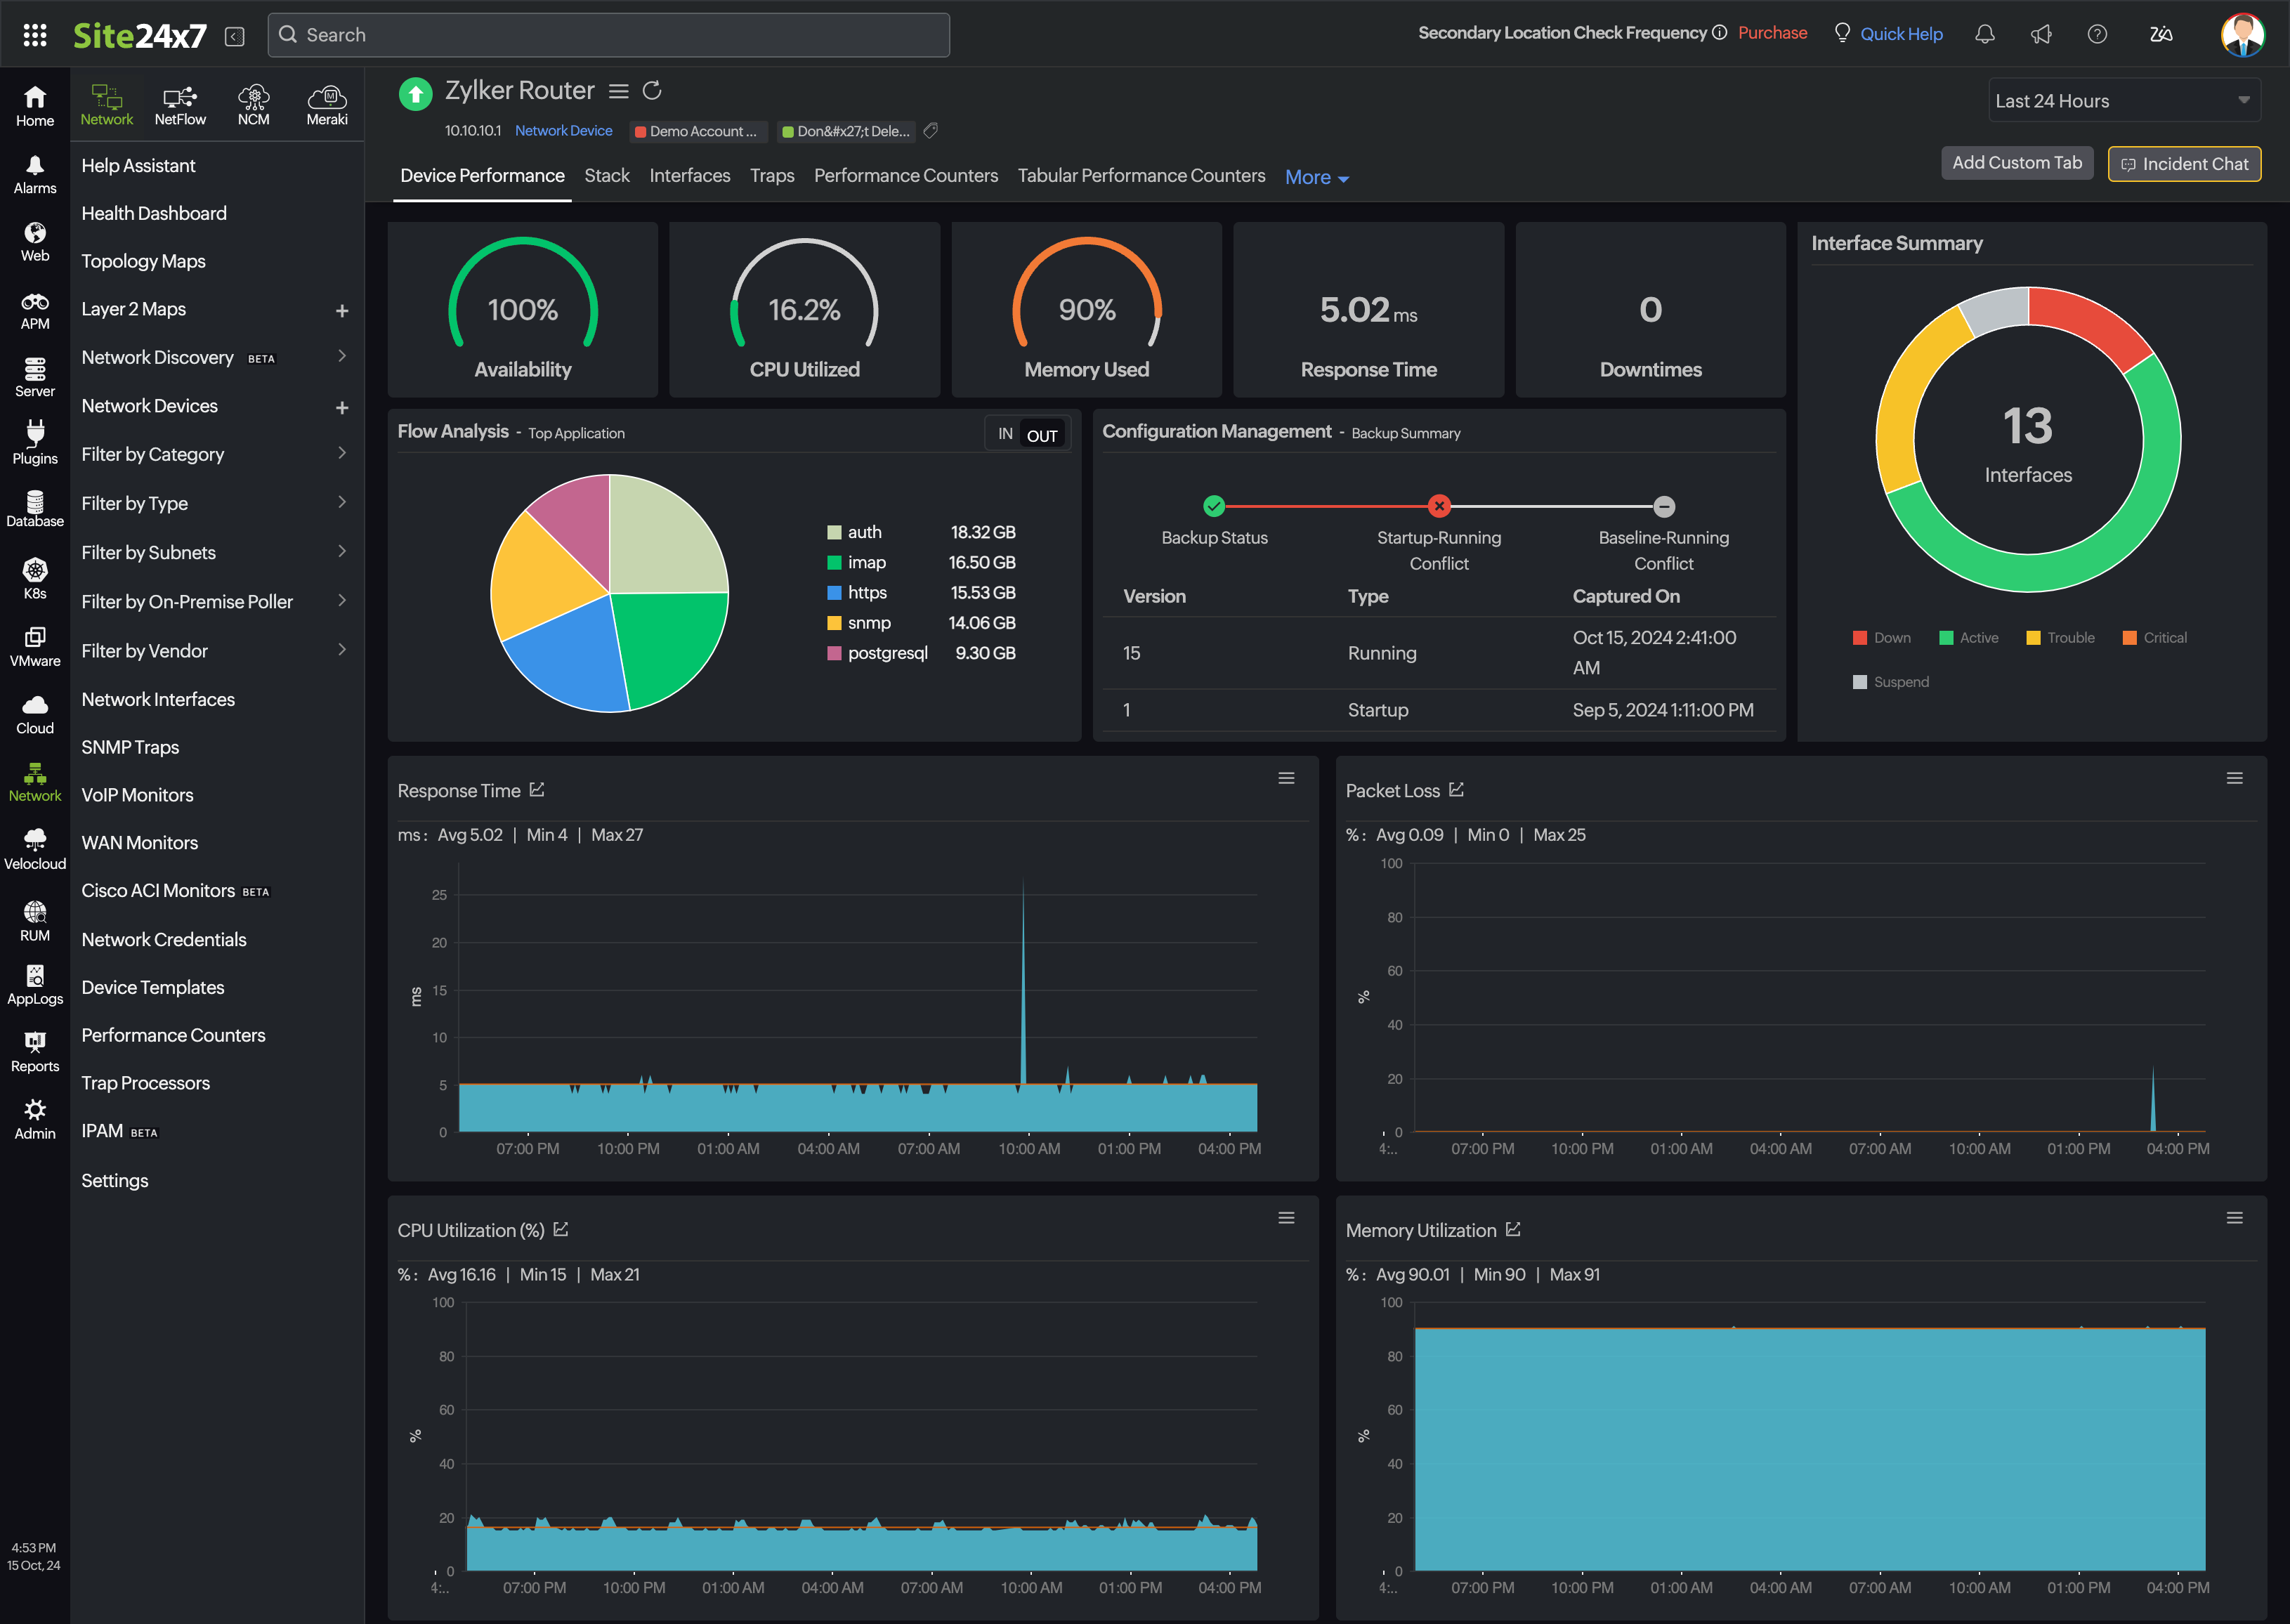
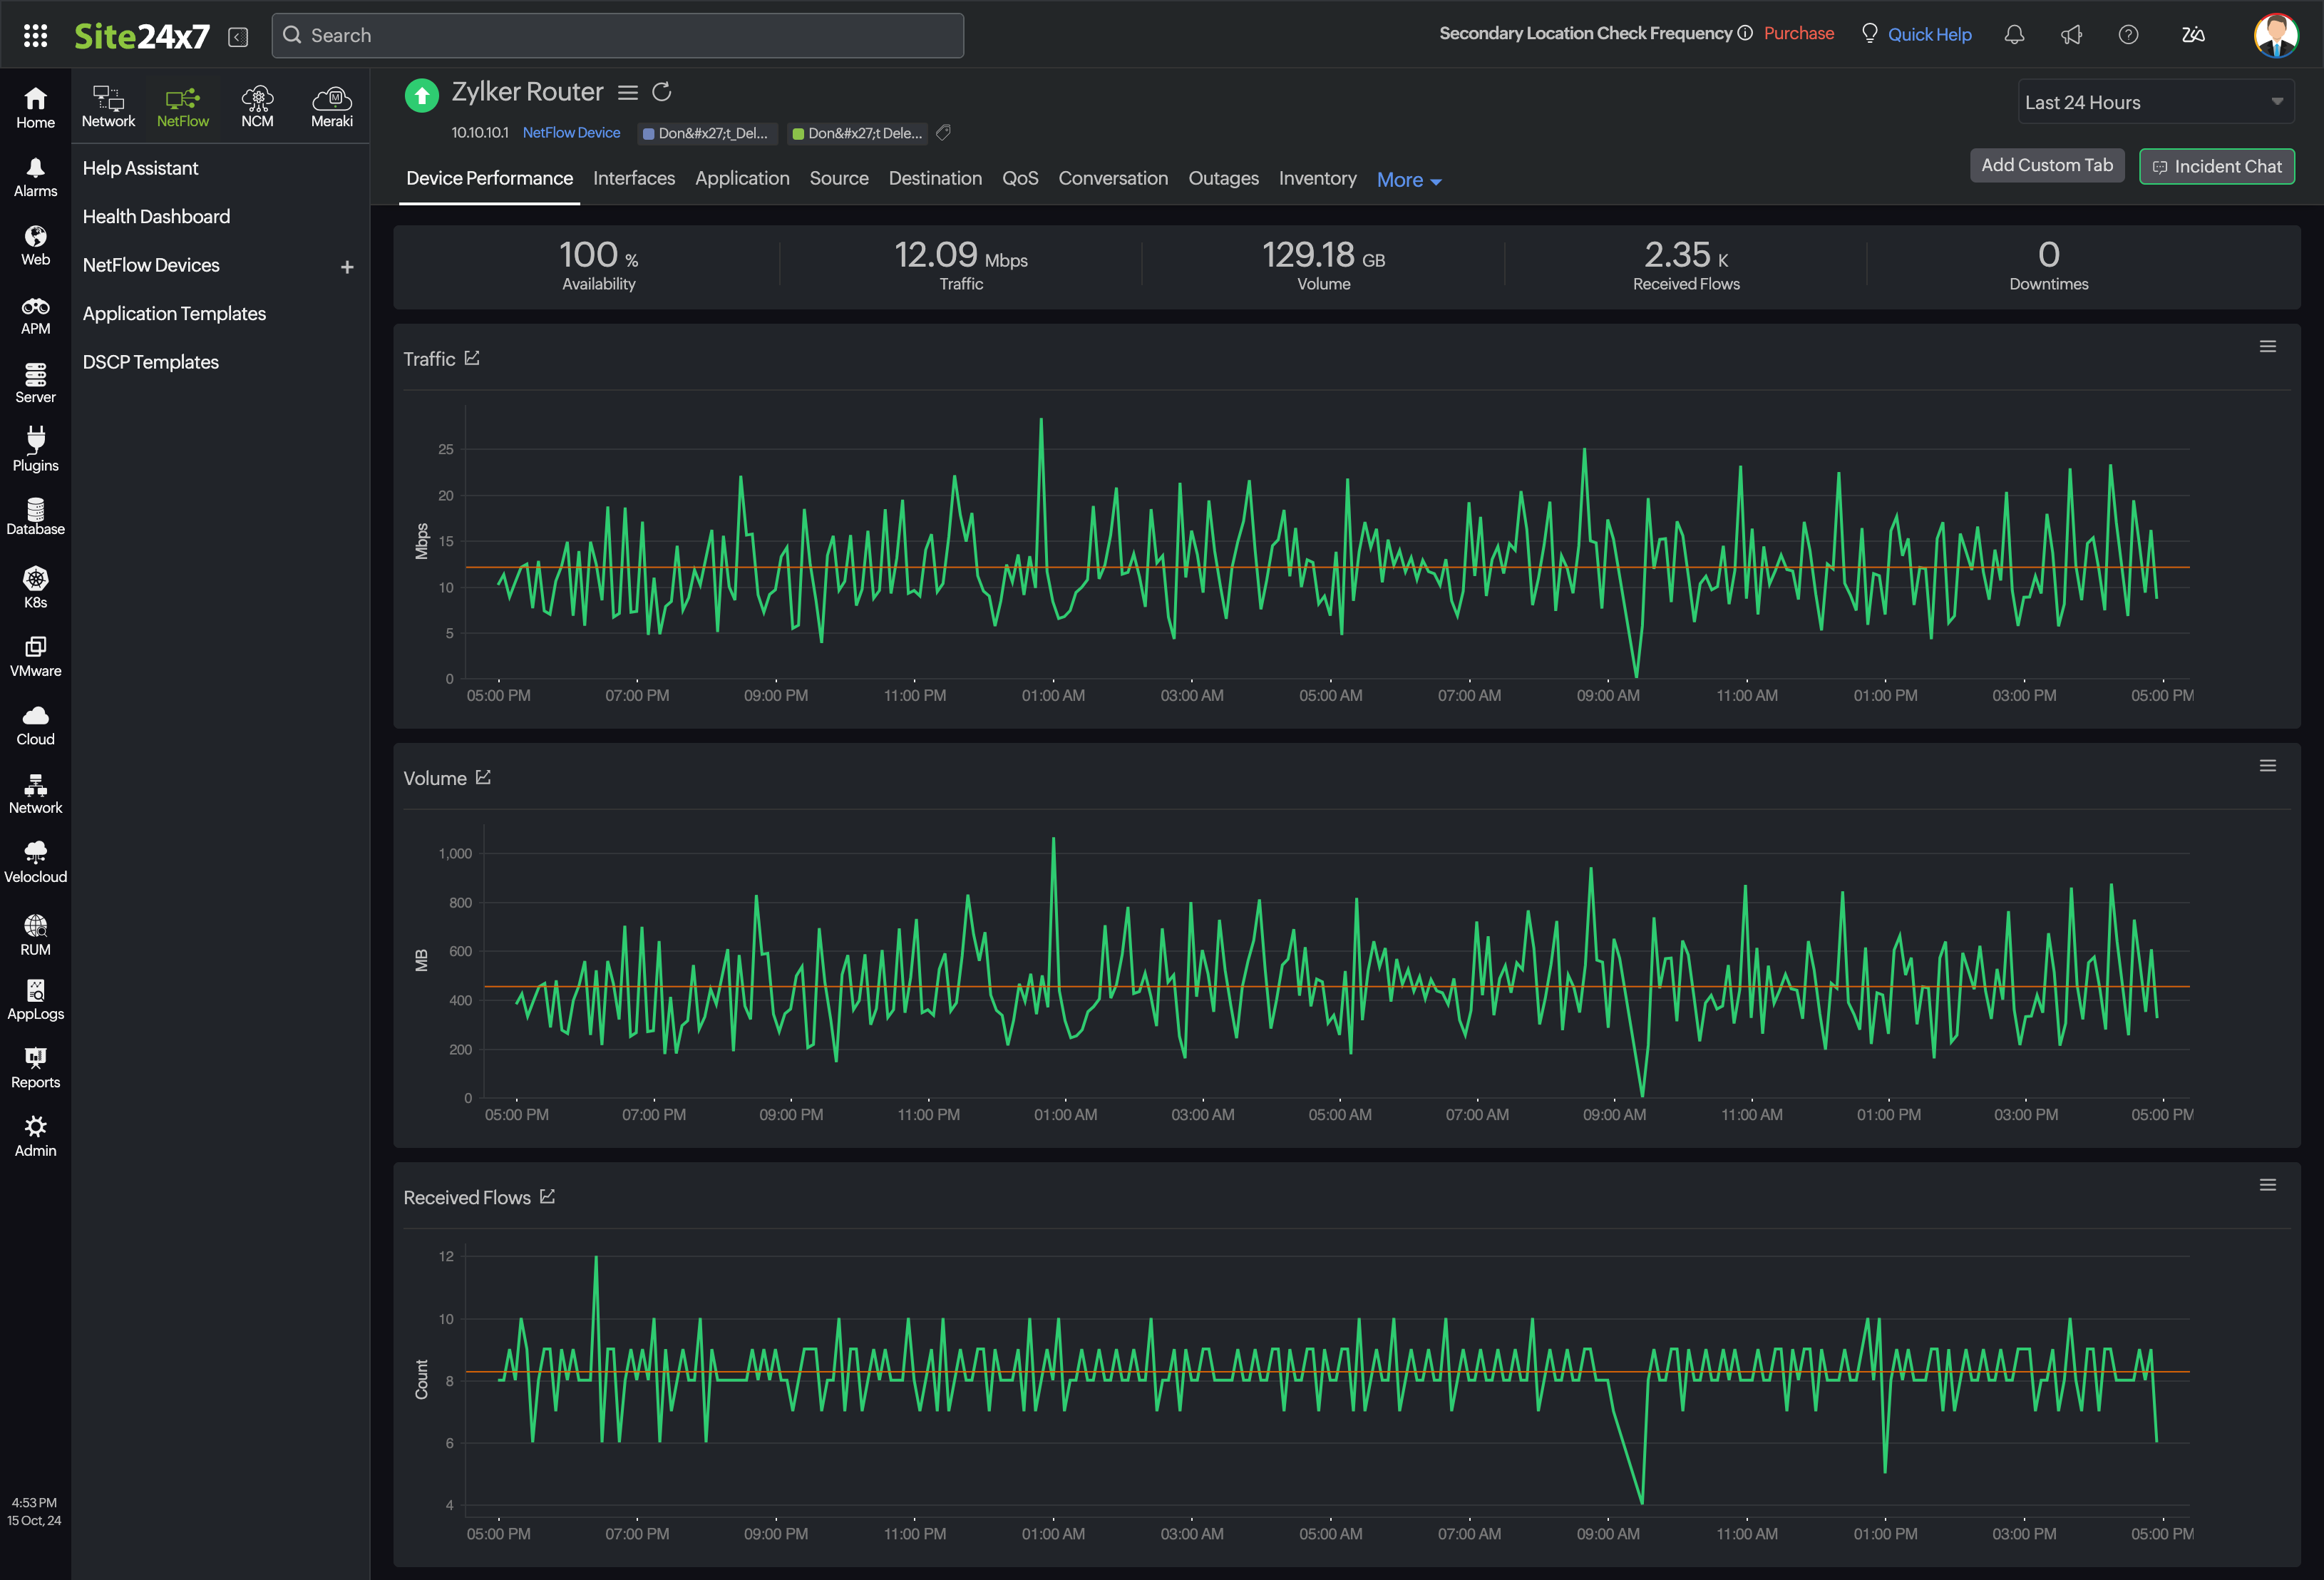
Configure your device to export flows to our tool and enable network traffic monitoring to view flow analysis for the device.
Enable Network Configuration Management (NCM)
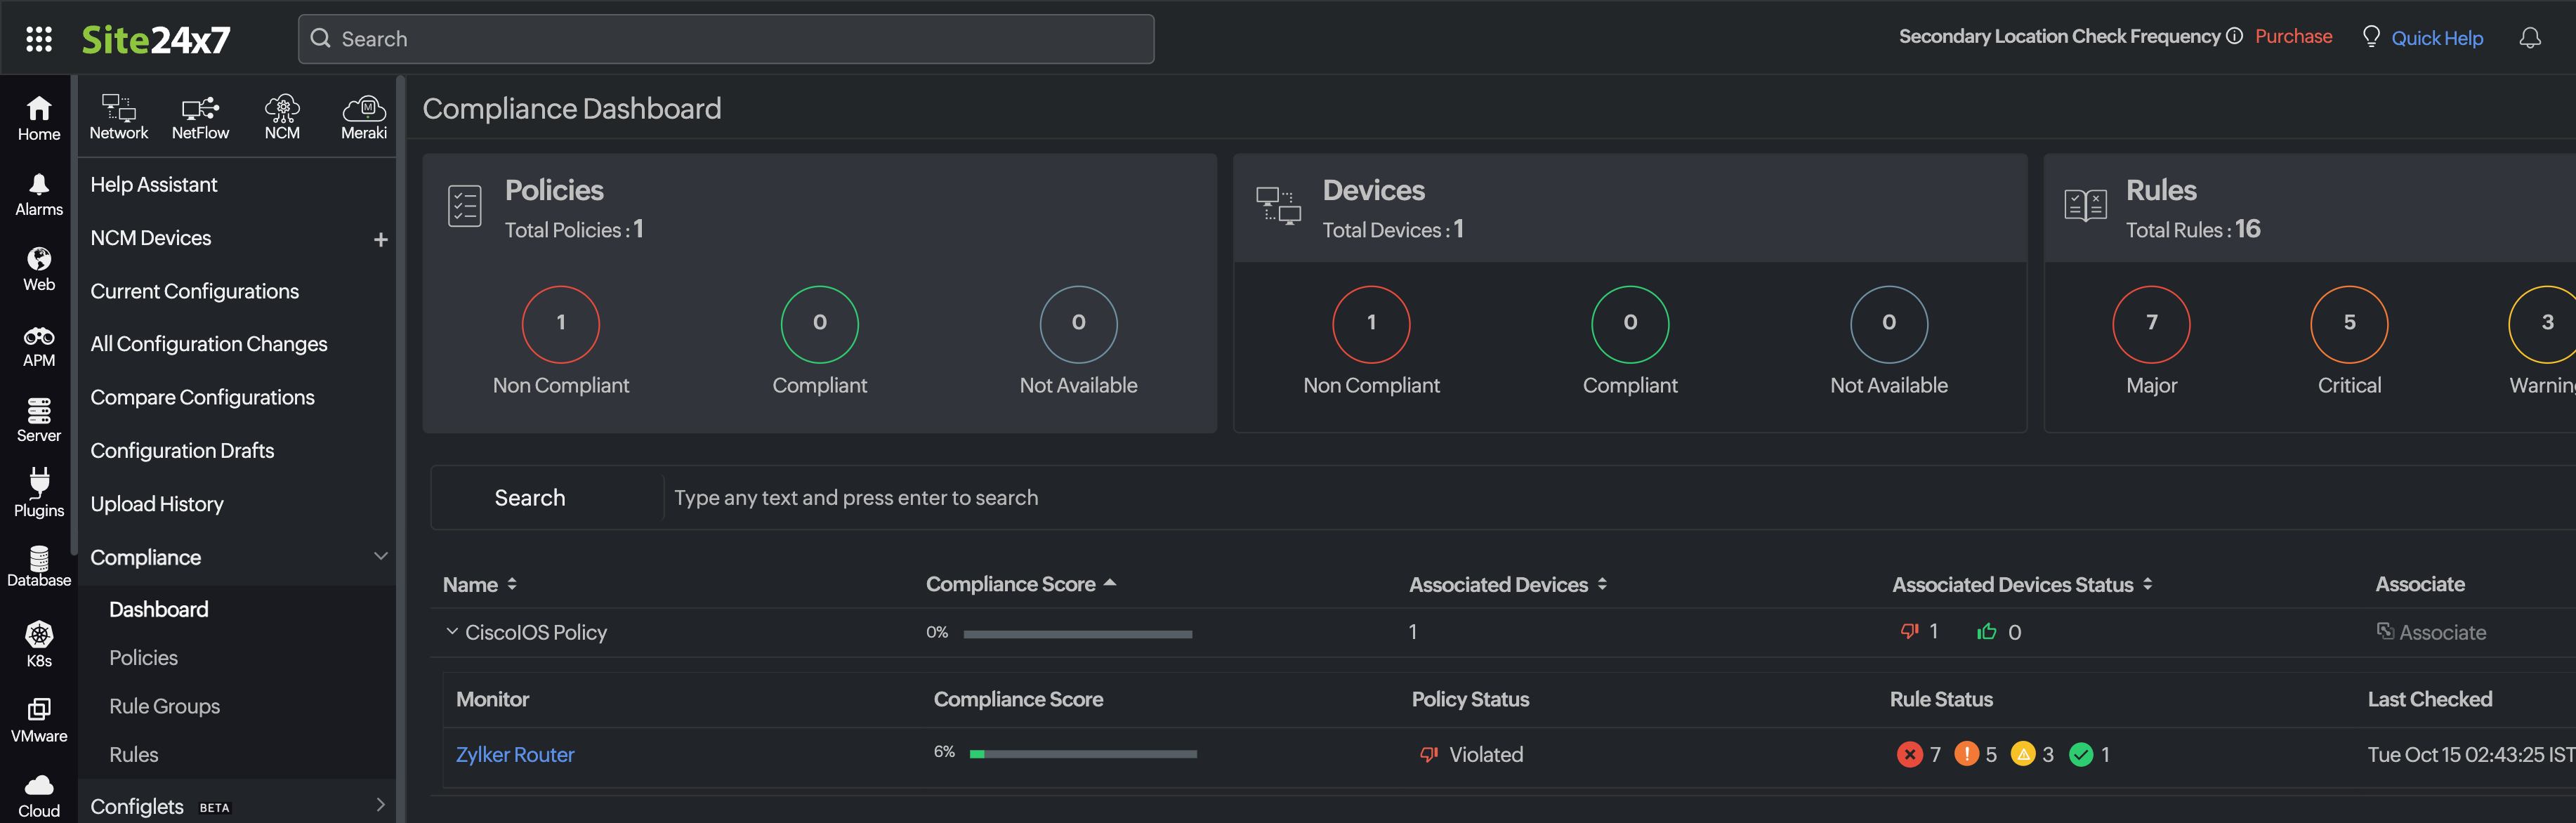
Enable network configuration management to view the status of configuration backups, automate configuration changes, track firmware vulnerabilities, and monitor compliance.
IP Address Management (IPAM)
Check prerequisites
Check out the prerequisites before getting started.
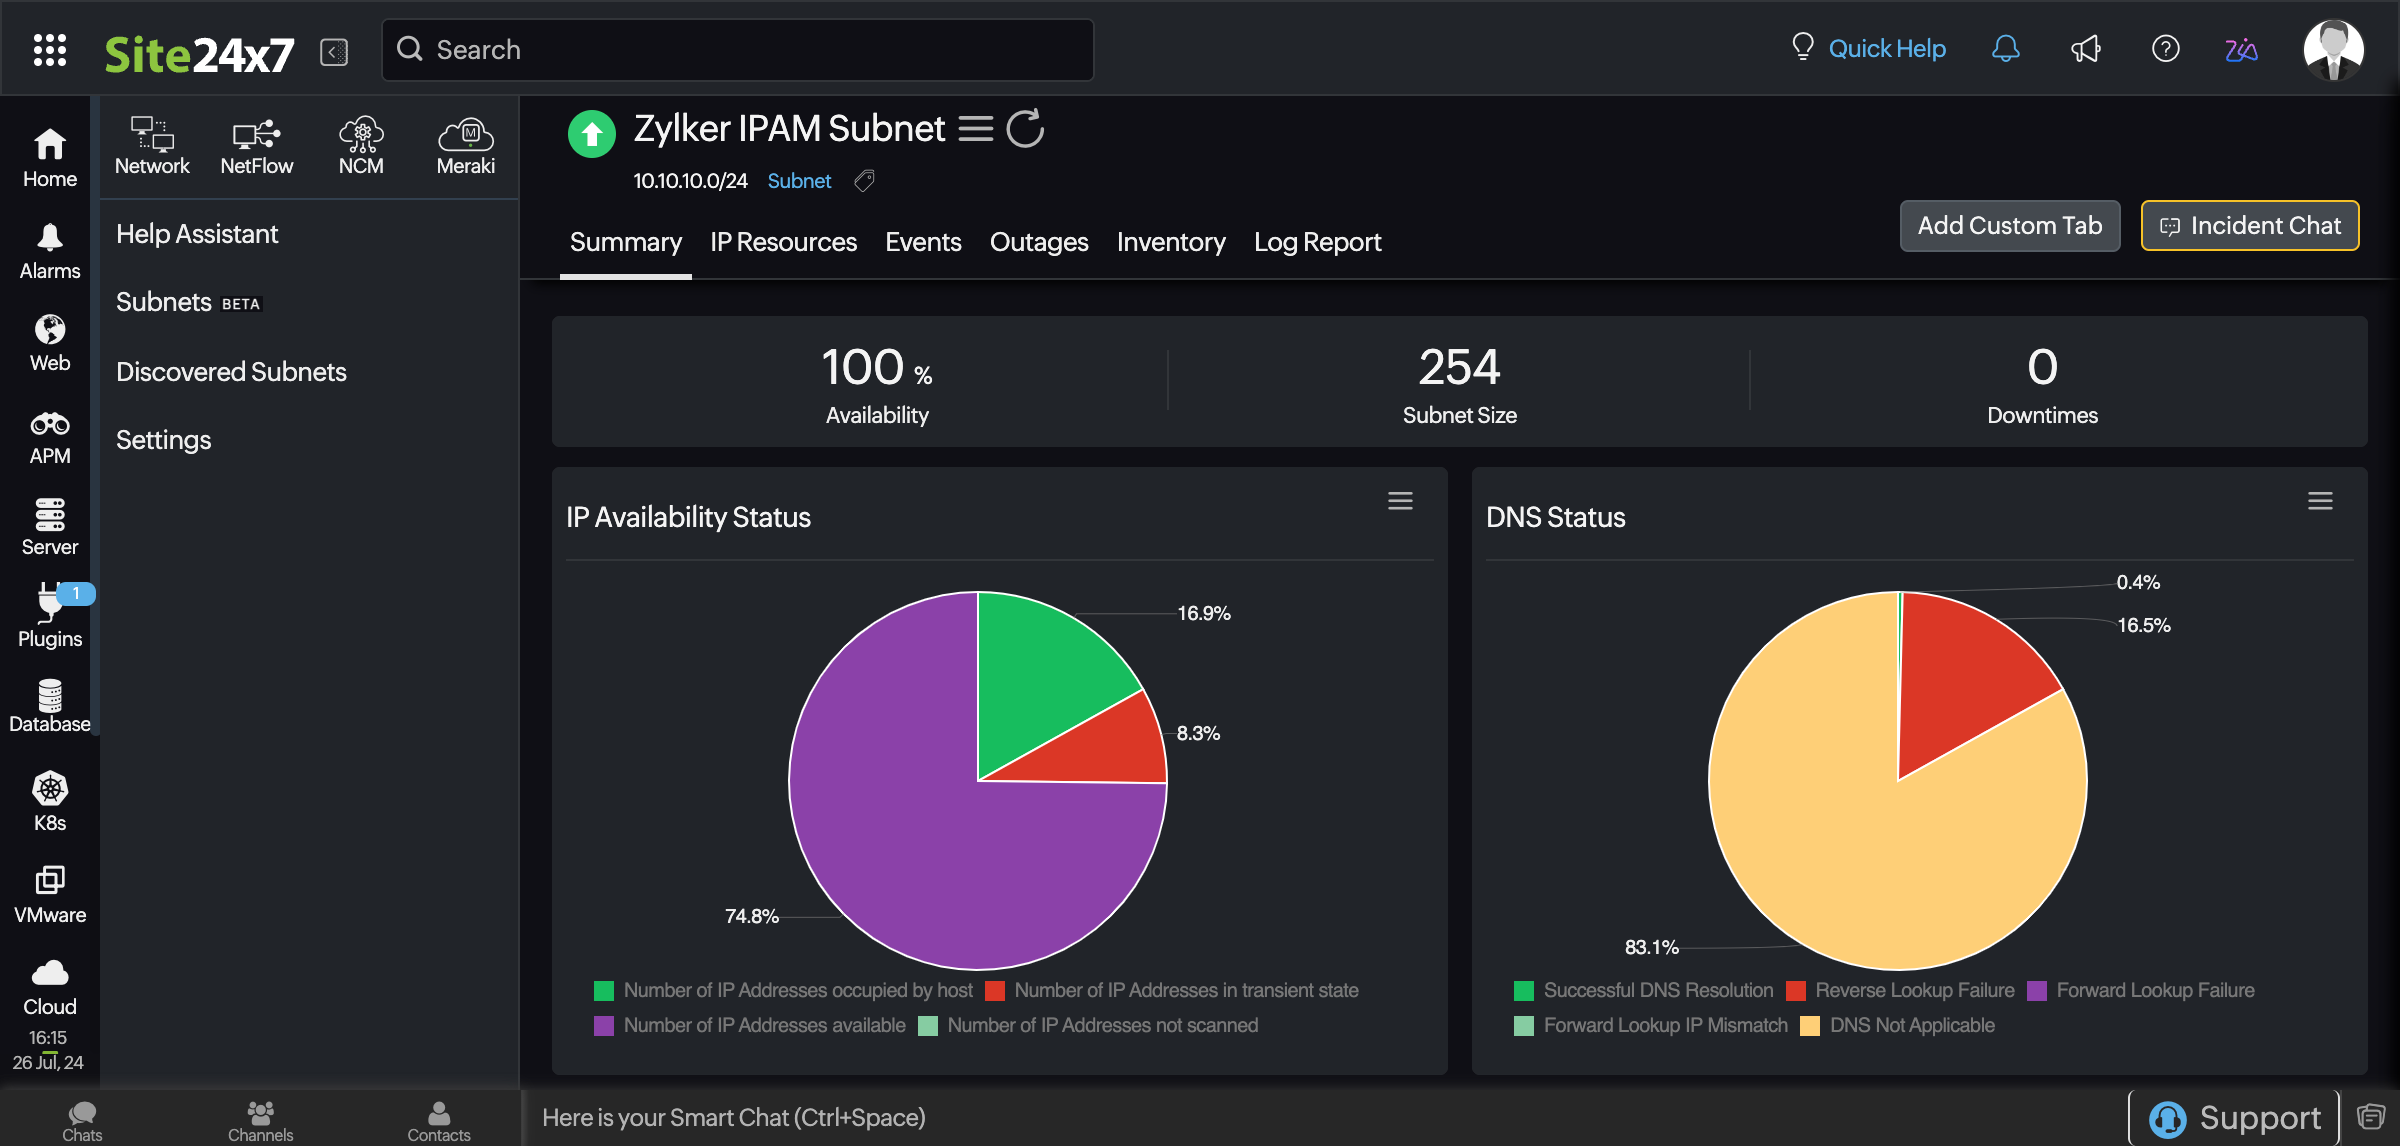
Add your subnet
Add your subnet to the tool as a monitor.
Monitoring using Cisco-IPSLA
VoIP monitoring
Check prerequisites
Ensure both your source and destination devices are Cisco switches, firewalls, or routers. Check out the prerequisites before getting started.
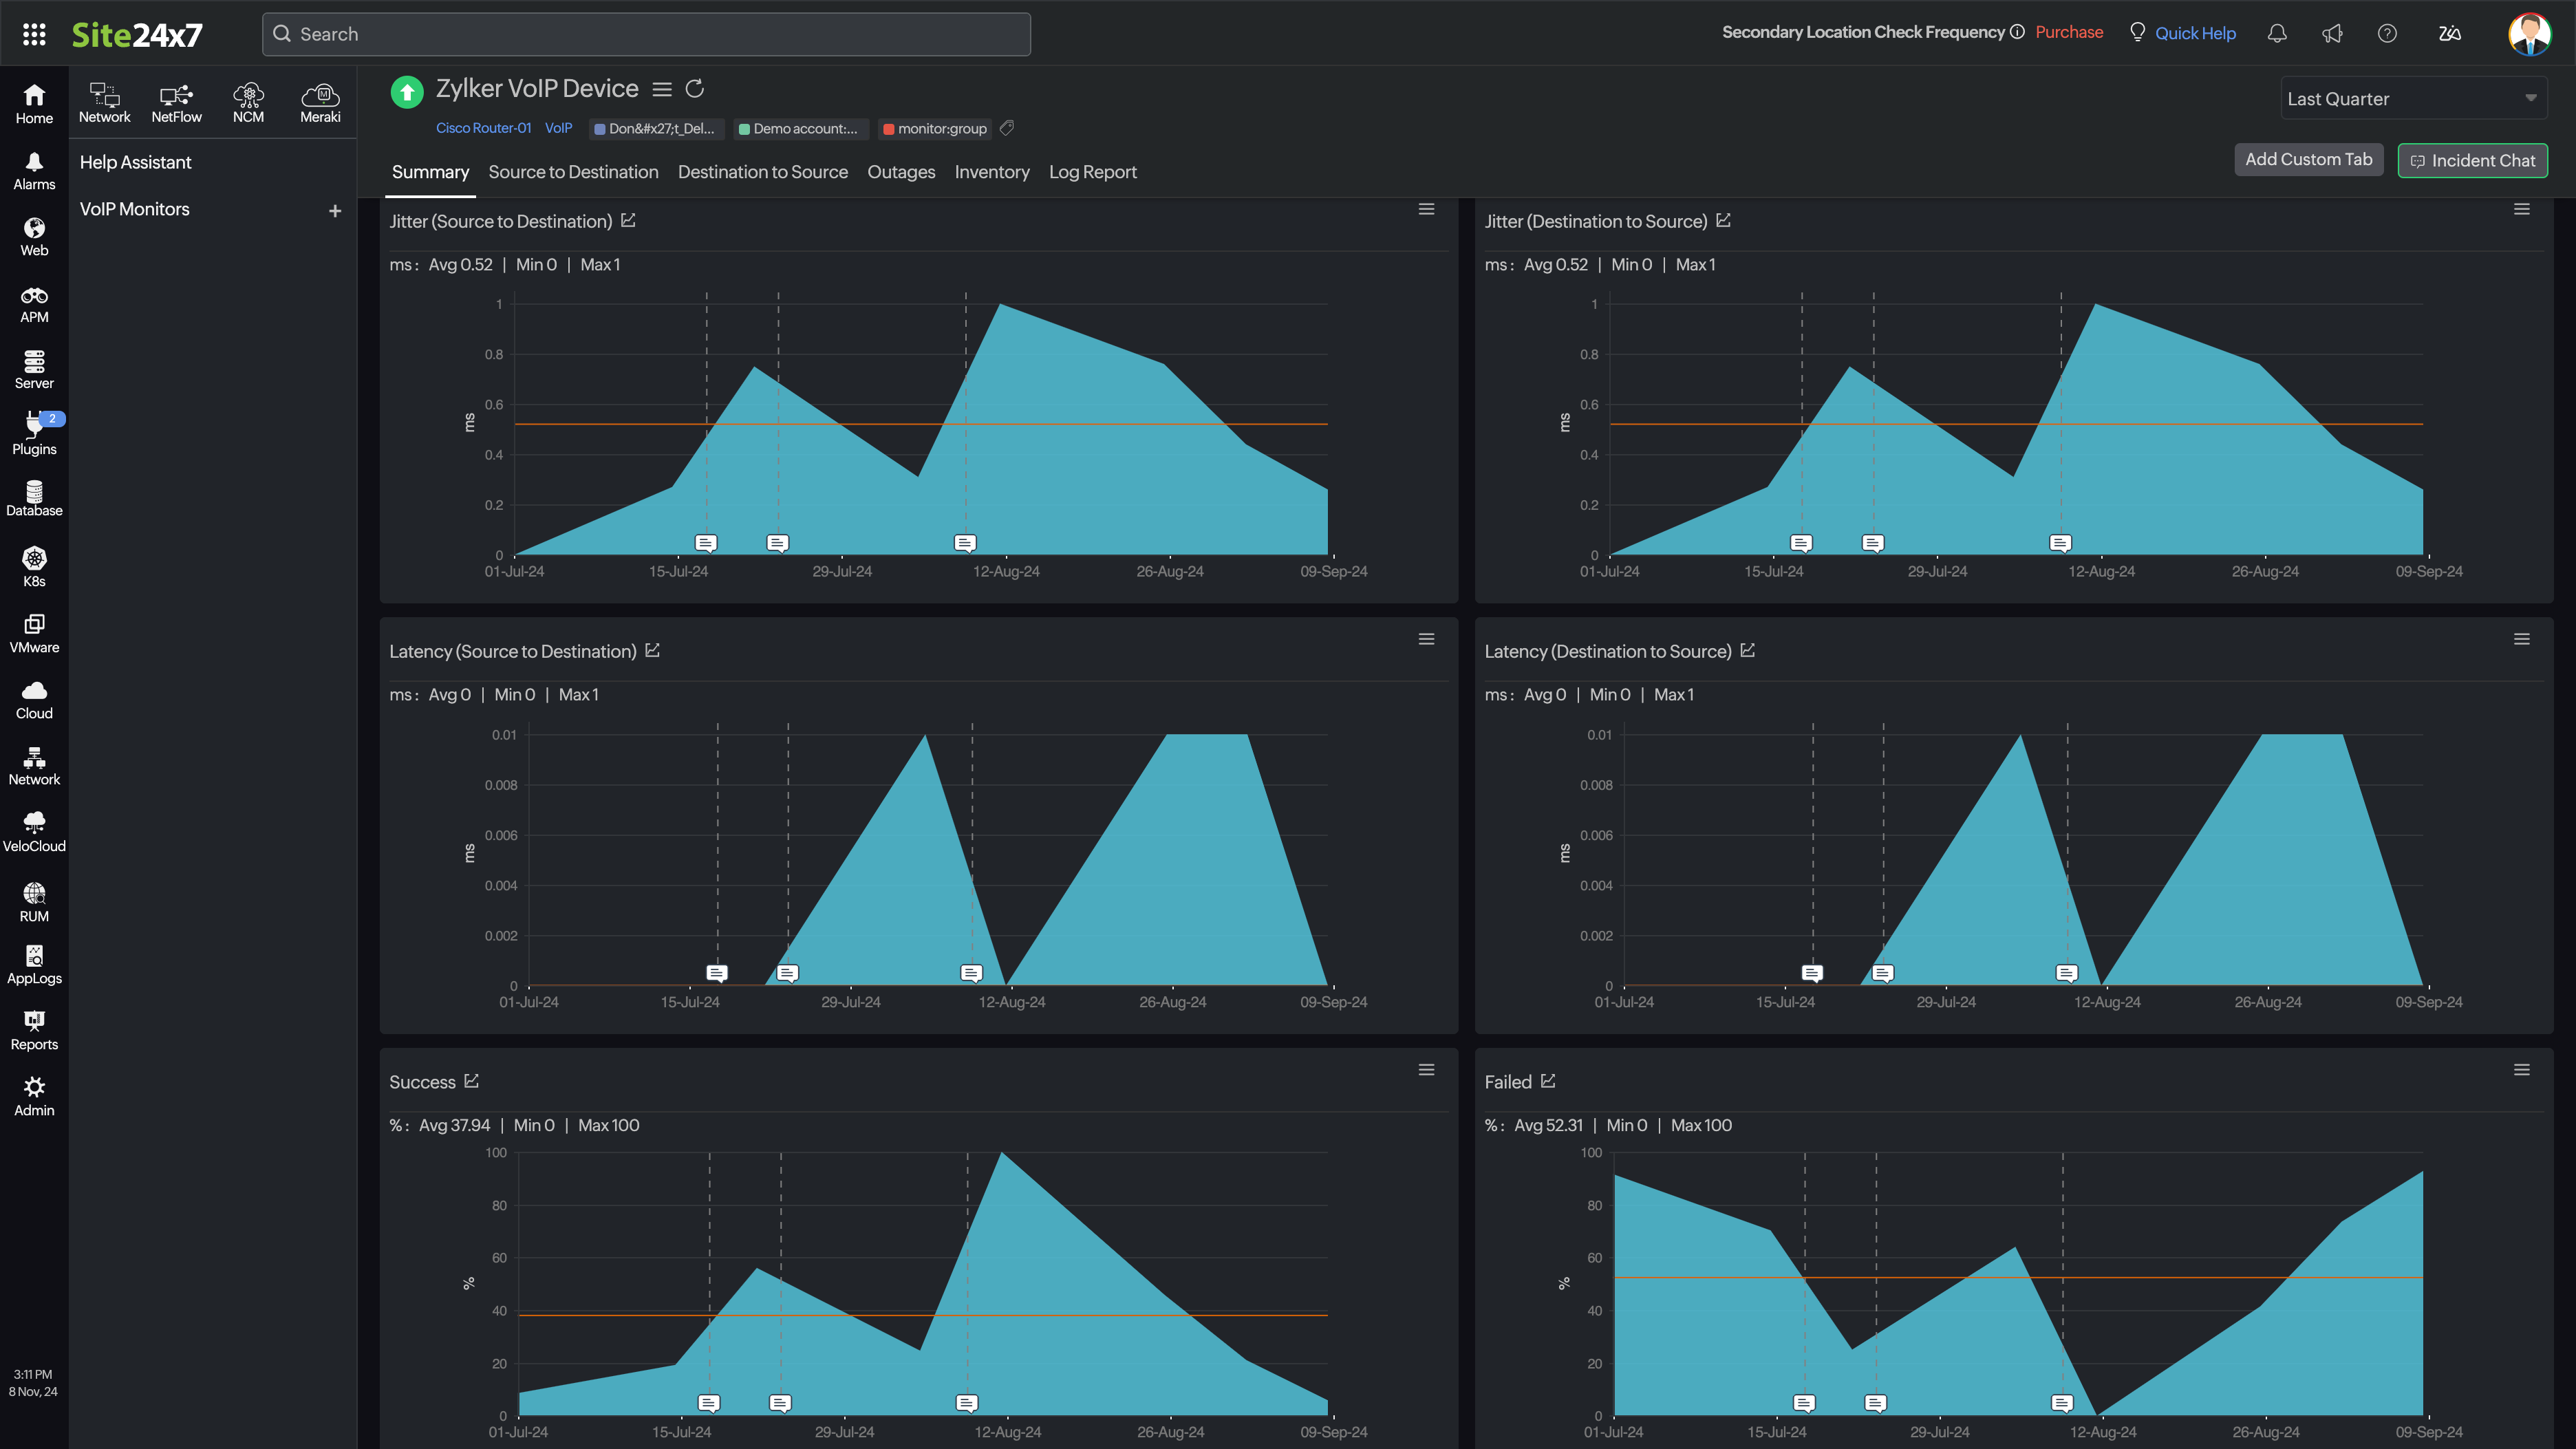
Add your VoIP device
Add your VoIP device as a monitor to start tracking metrics like jitter, latency, and more.
WAN monitoring
Check prerequisites
Ensure that the source device is a Cisco one. Check out the prerequisites before getting started.
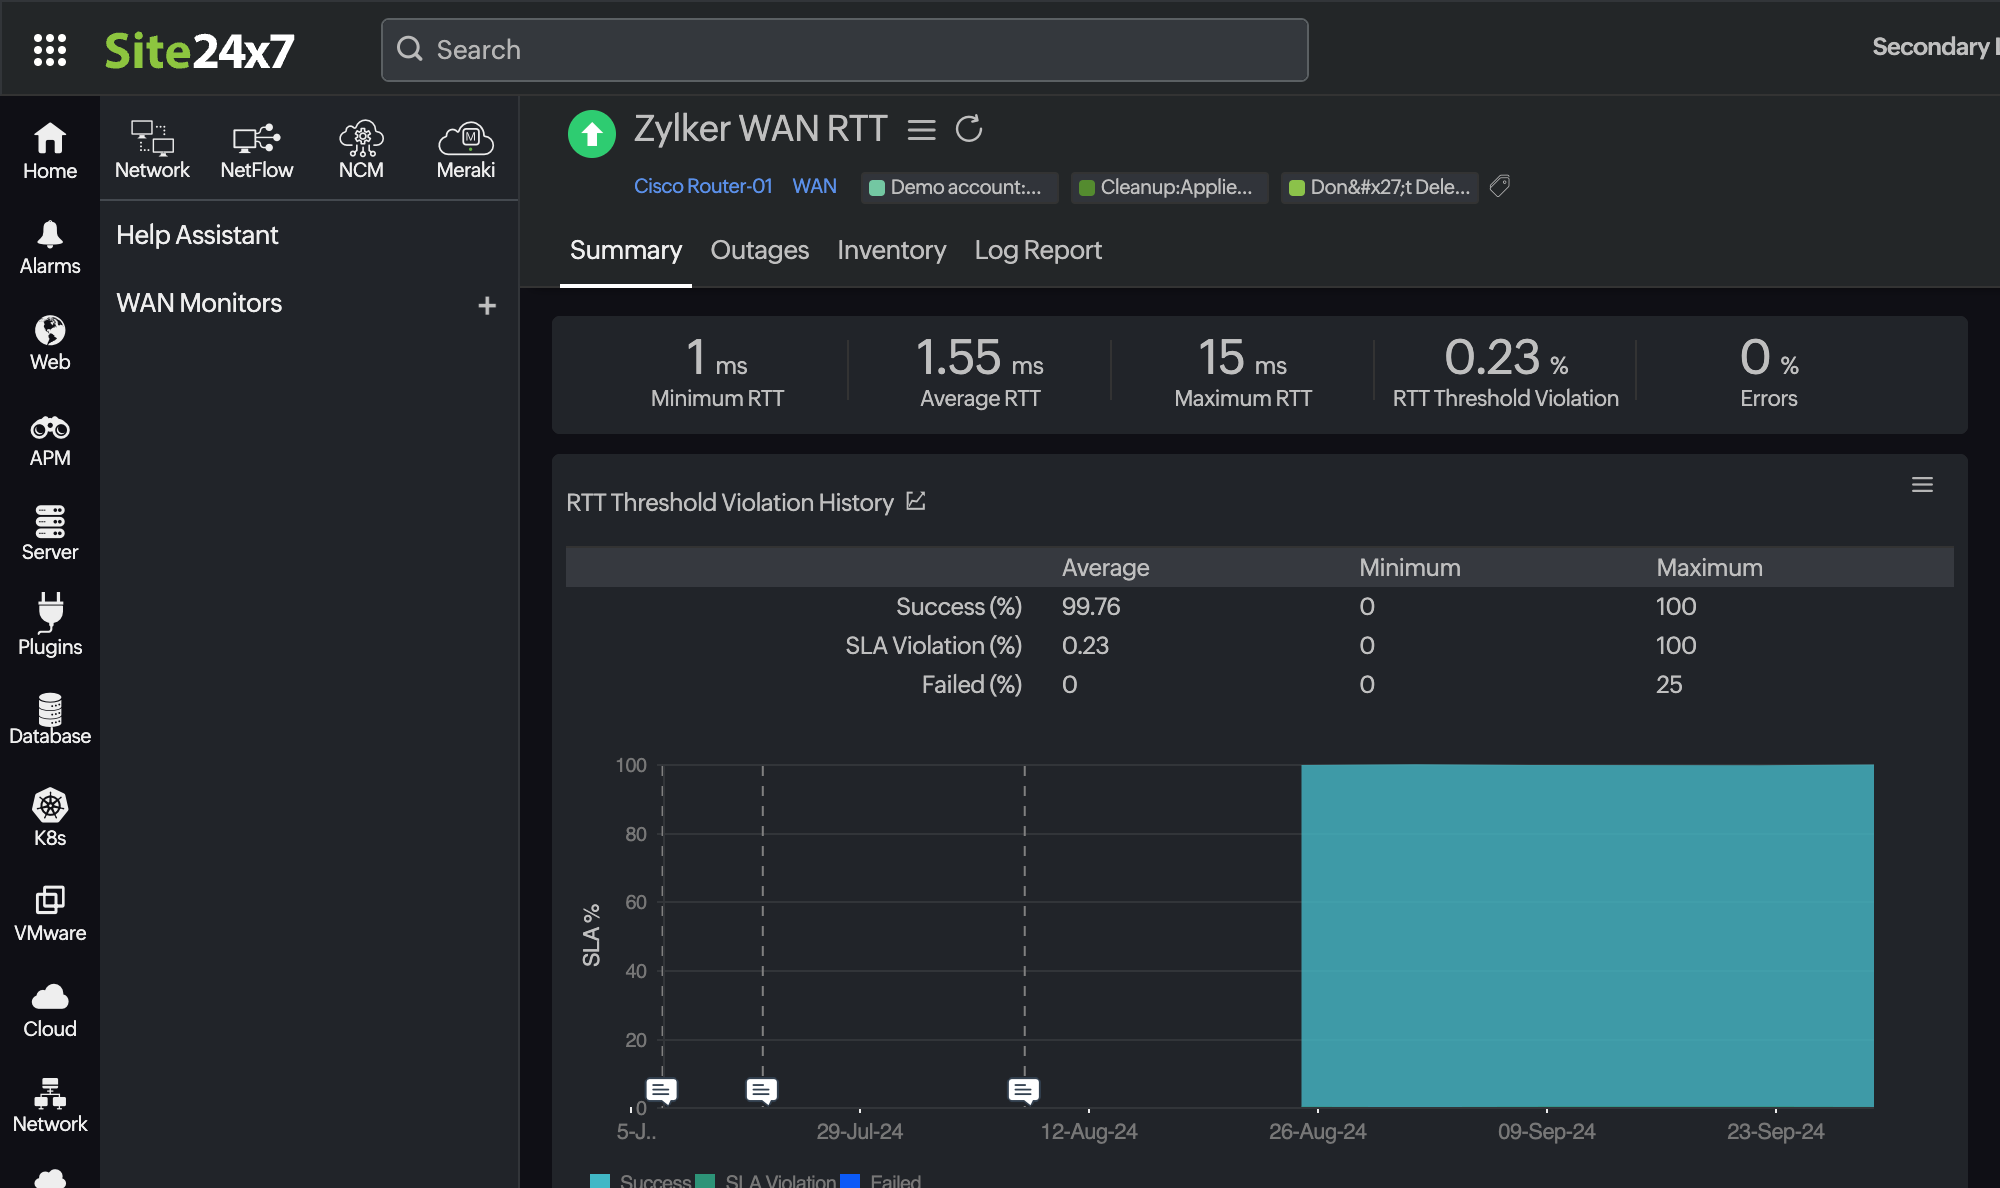
Add WAN monitor
Start by adding a WAN monitor. You can now track metrics like RTT, availability history, and more.
Monitoring SDNs and SDWANs
Cisco Meraki monitoring
Verify Meraki REST API Key Access
Check whether the Meraki REST API Key generated in your Cisco Meraki dashboard can be accessed by Site24x7. Read-only access is sufficient.
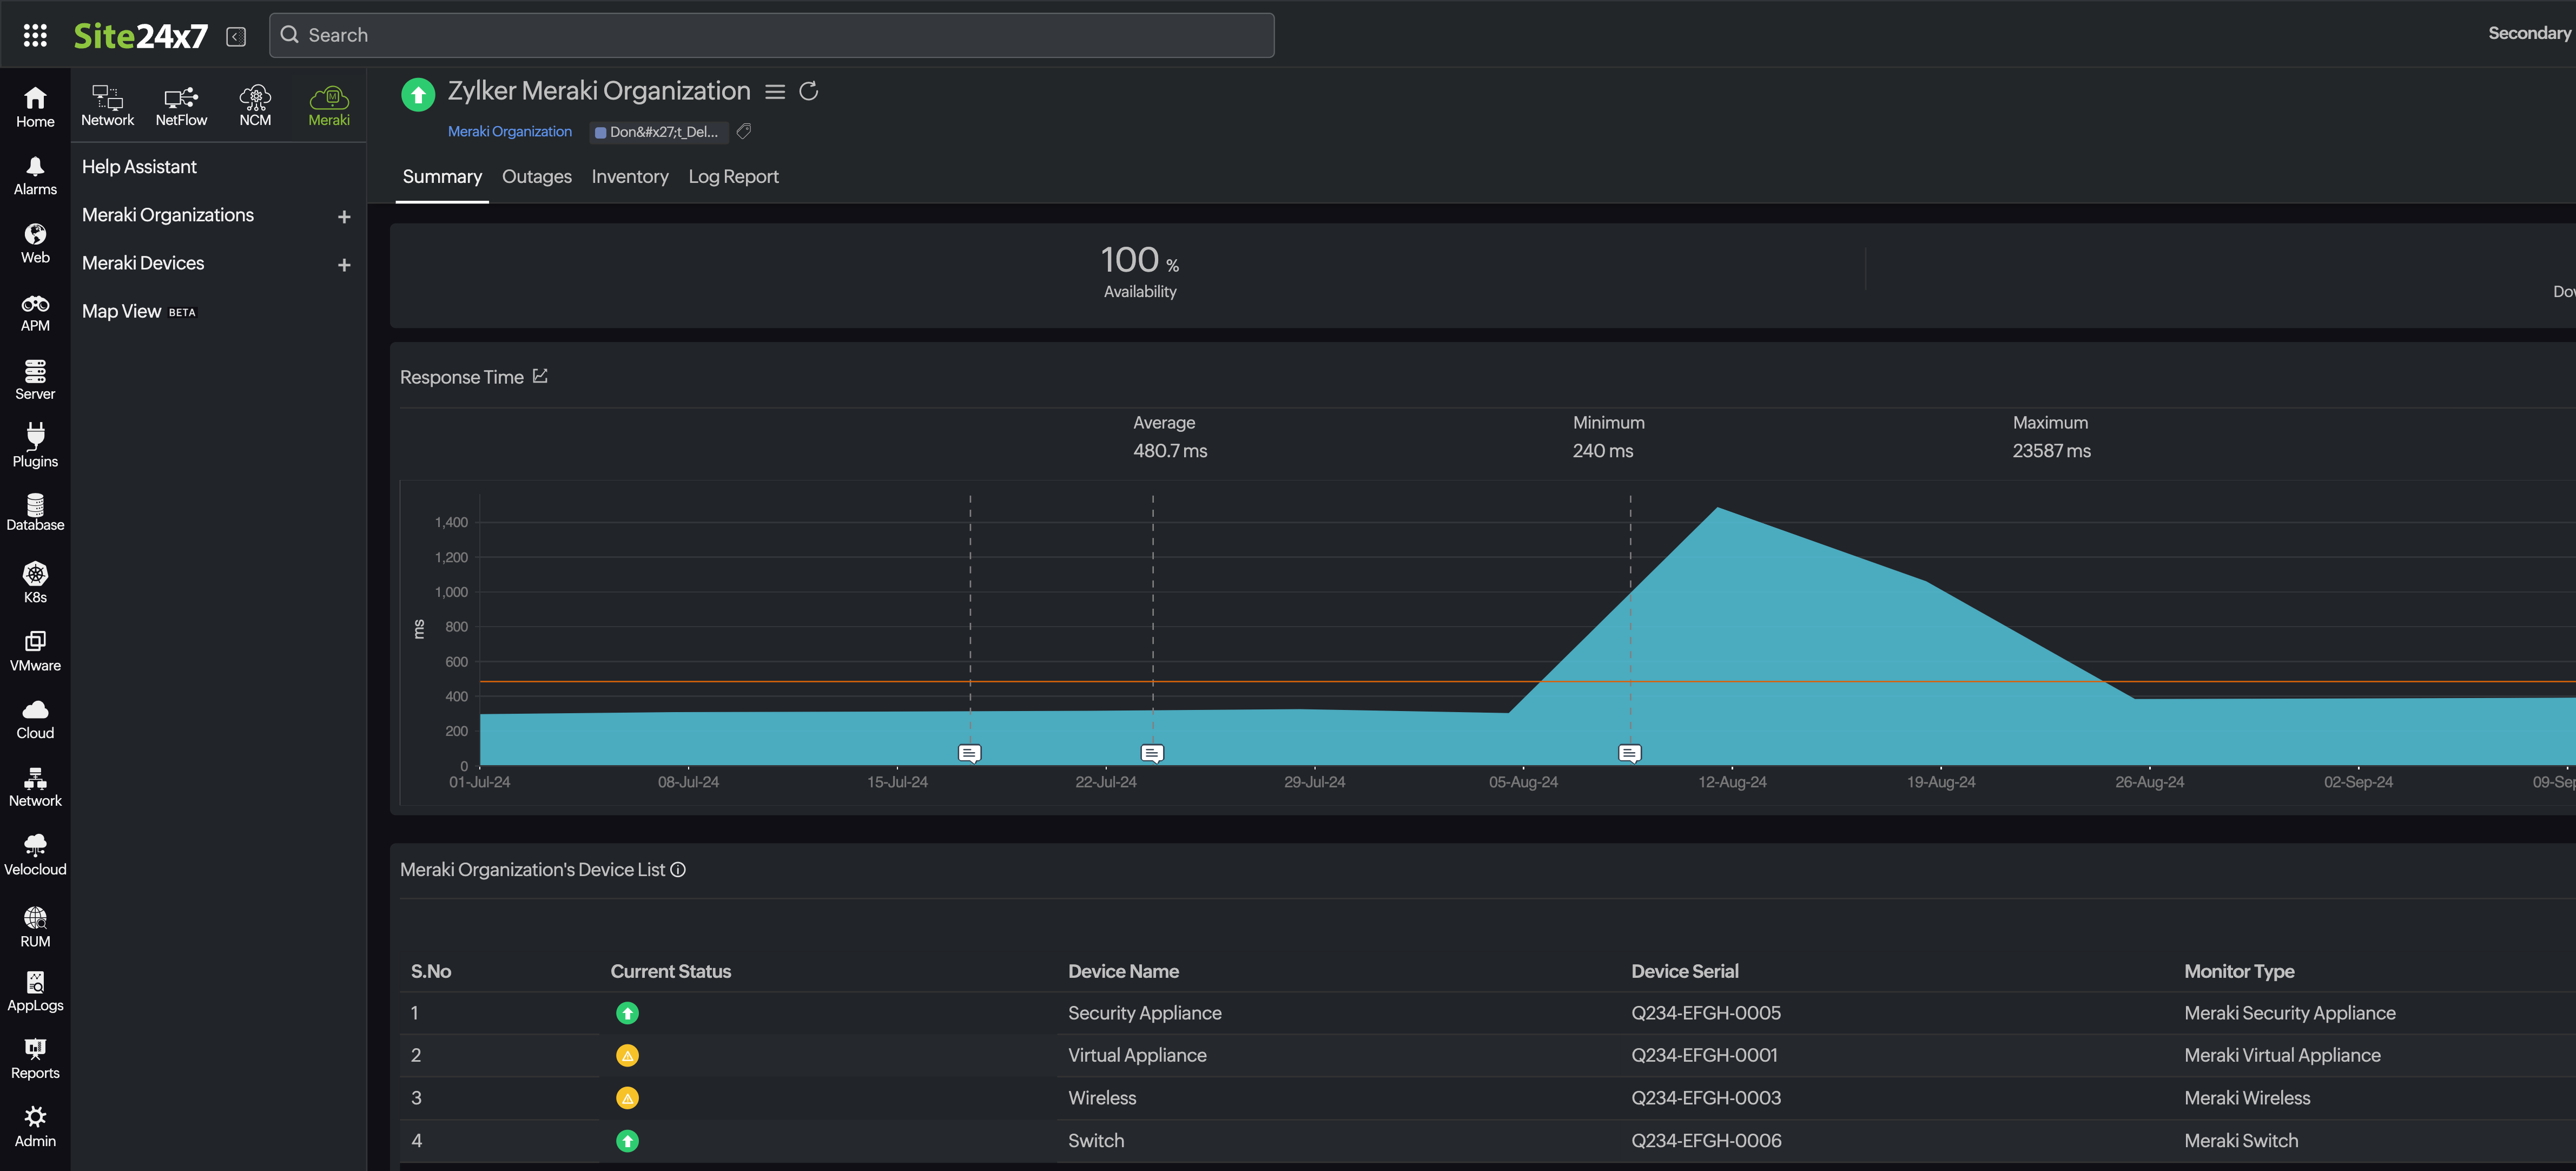
View performance metrics and set thresholds
Start viewing performance metrics, set thresholds, and view all your Meraki monitors on a map.
Cisco ACI monitoring
Review prerequisites
Check out the prerequisites before getting started.
Add Cisco ACI APIC as a monitor
Add your Cisco ACI Application Policy Infrastructure Controller (APIC) as a monitor.
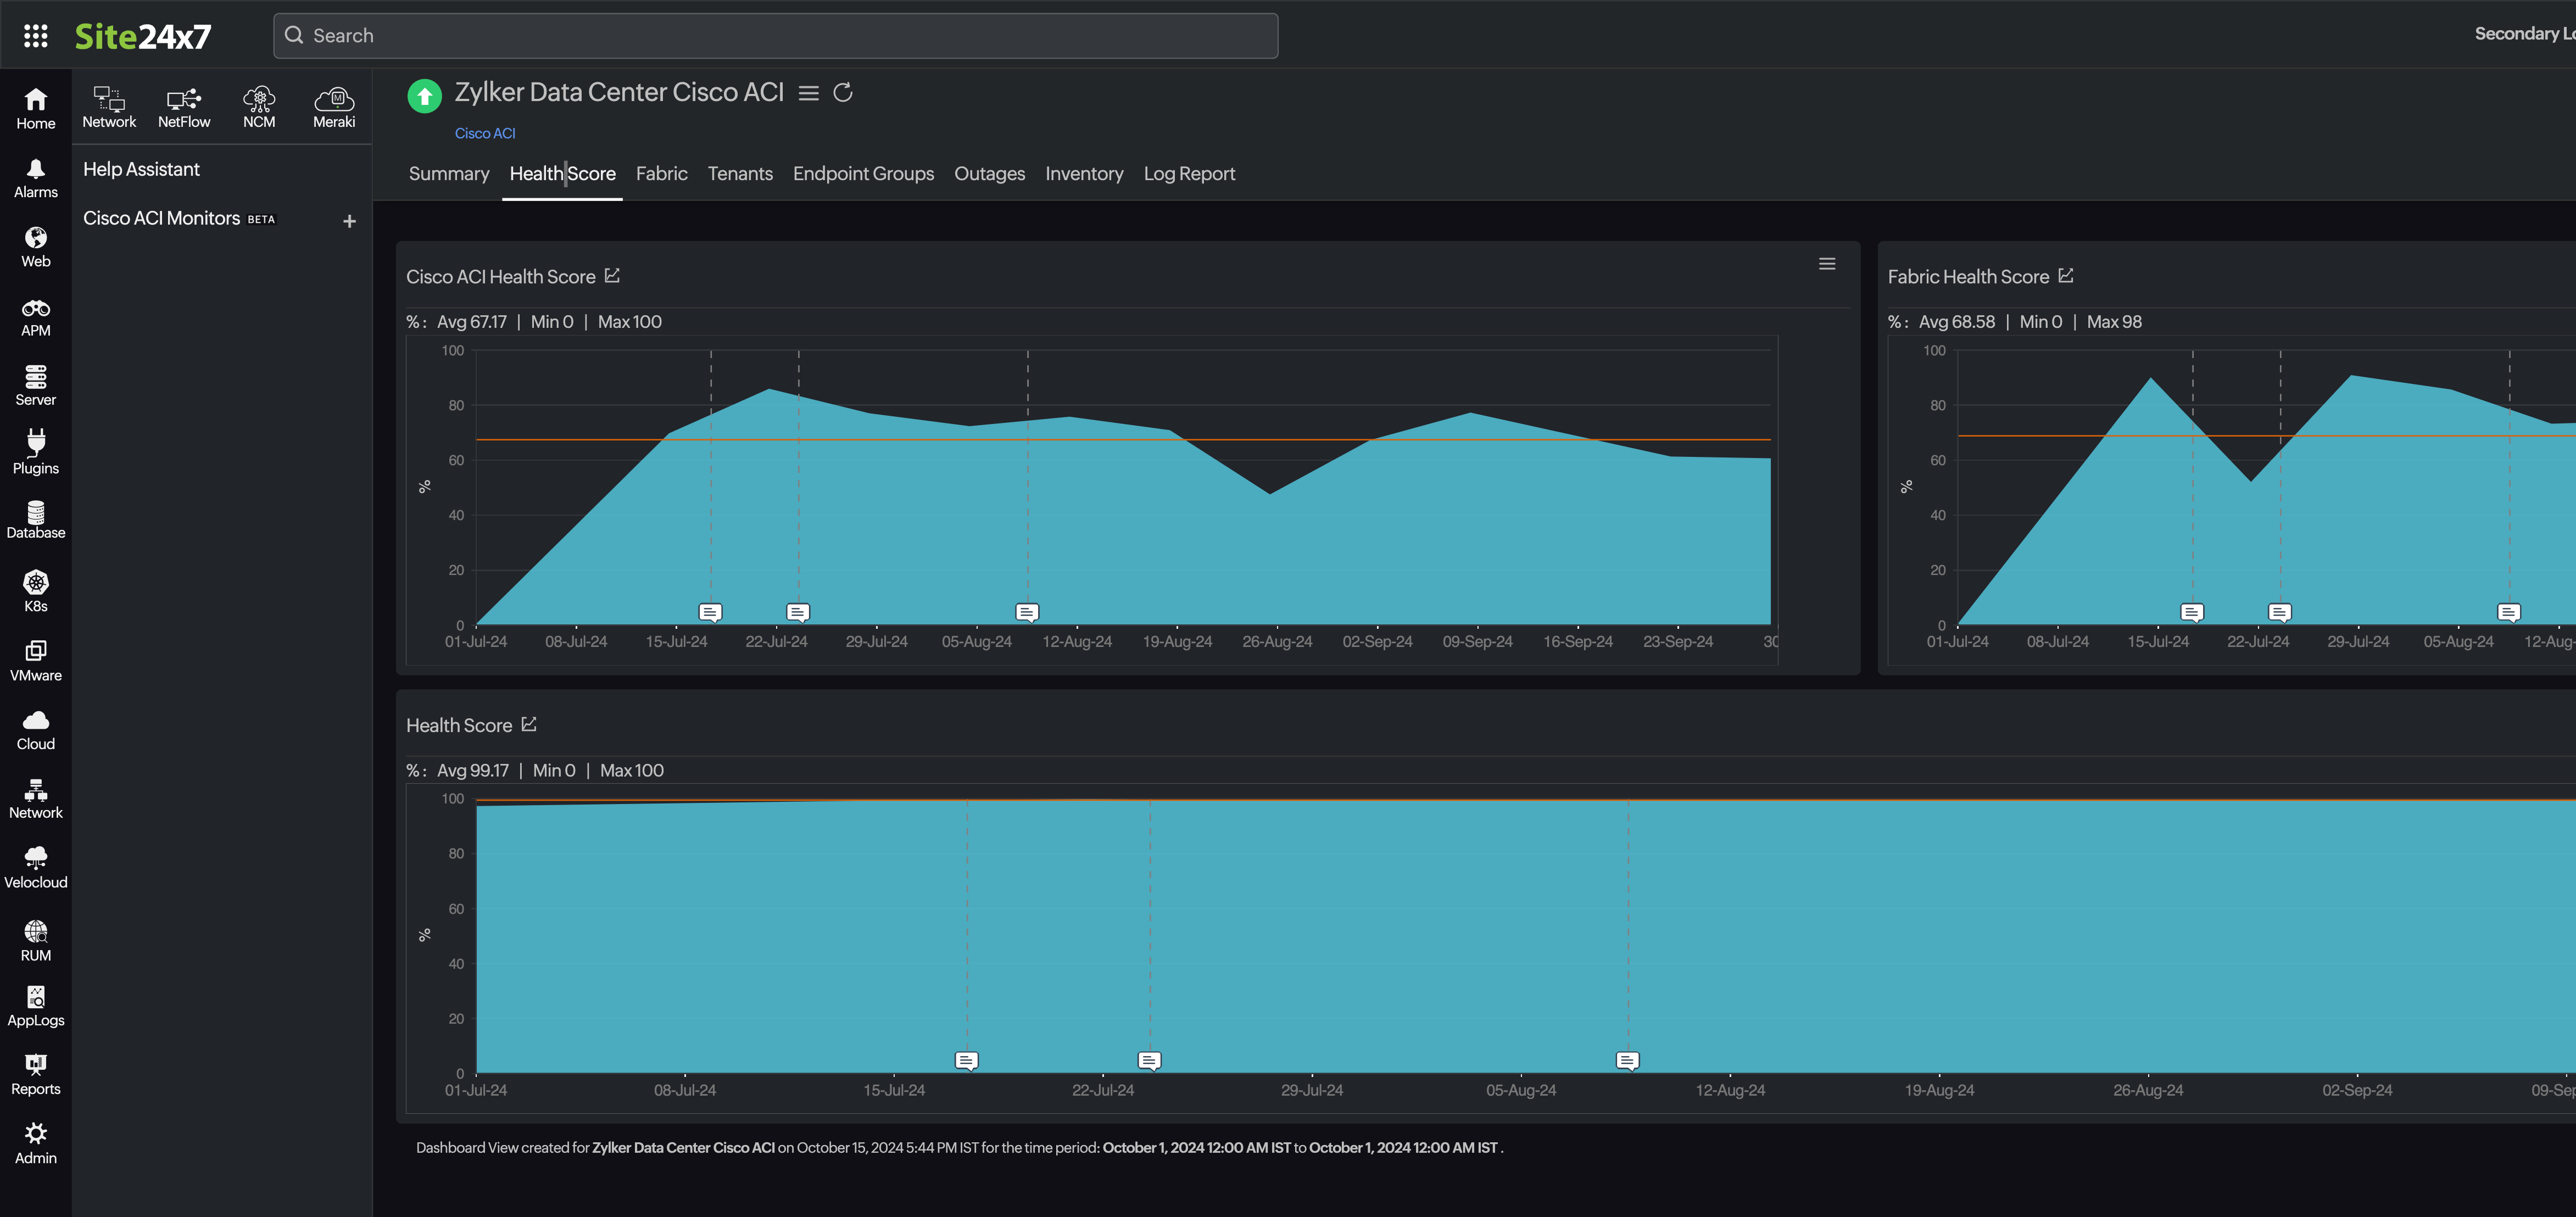
Cisco Catalyst monitoring
Configure SNMP access
Enable SNMP on the Cisco Catalyst Manager and verify the SNMP credentials.
Add Cisco Catalyst device
Add the Cisco Catalyst manager using its URL, hostname, and SNMP configuration details.
Monitor performance
Track Availability, CPU Utilization, and Memory Utilization for Edge devices, Controllers, and Validators along with Availability and Response Time for the Managers.
VMware VeloCloud SD-WAN Monitoring
Review prerequisites
Make sure the VMware VeloCloud Orchestrator is accessible and API credentials are available.
Add VMware VeloCloud SD-WAN as a monitor
Add the VMware VeloCloud Orchestrator using the API endpoint, username, and authentication details.
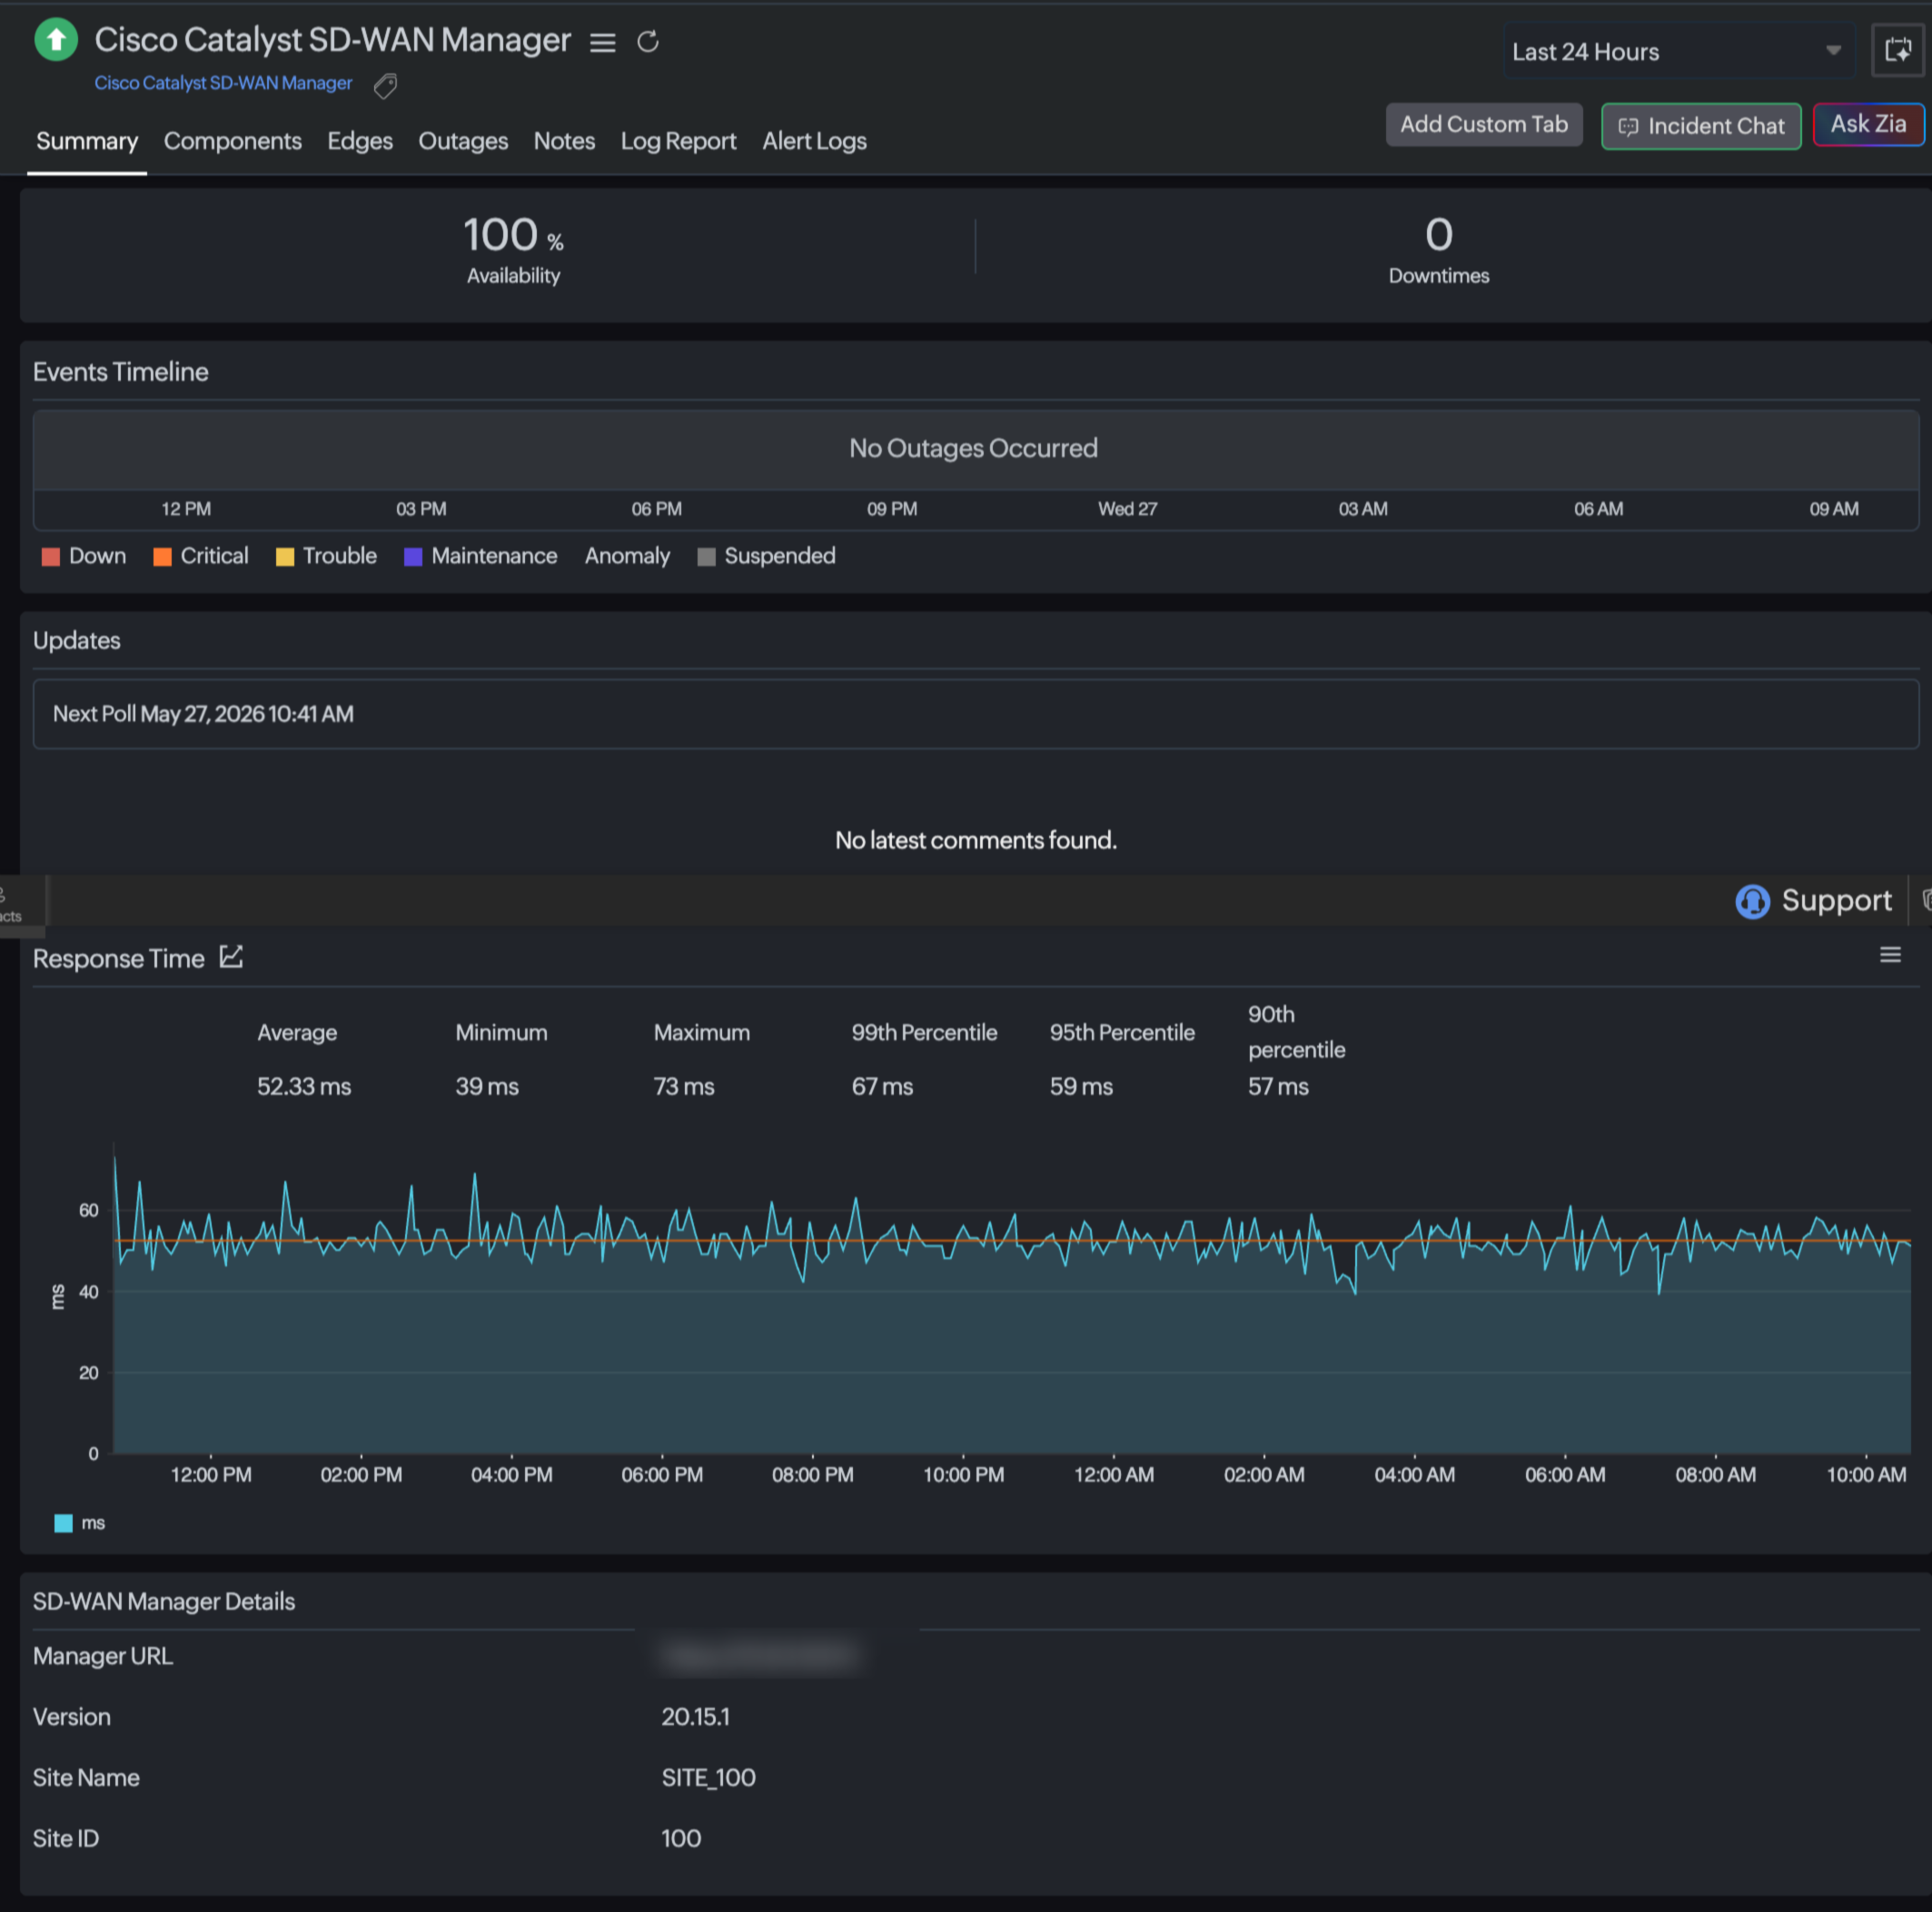
Monitor SD-WAN performance
Start monitoring edge health, tunnel status, bandwidth usage, latency, jitter, packet loss, and link availability. Visualize site-to-site connectivity, overlay paths, and overall network health using topology maps.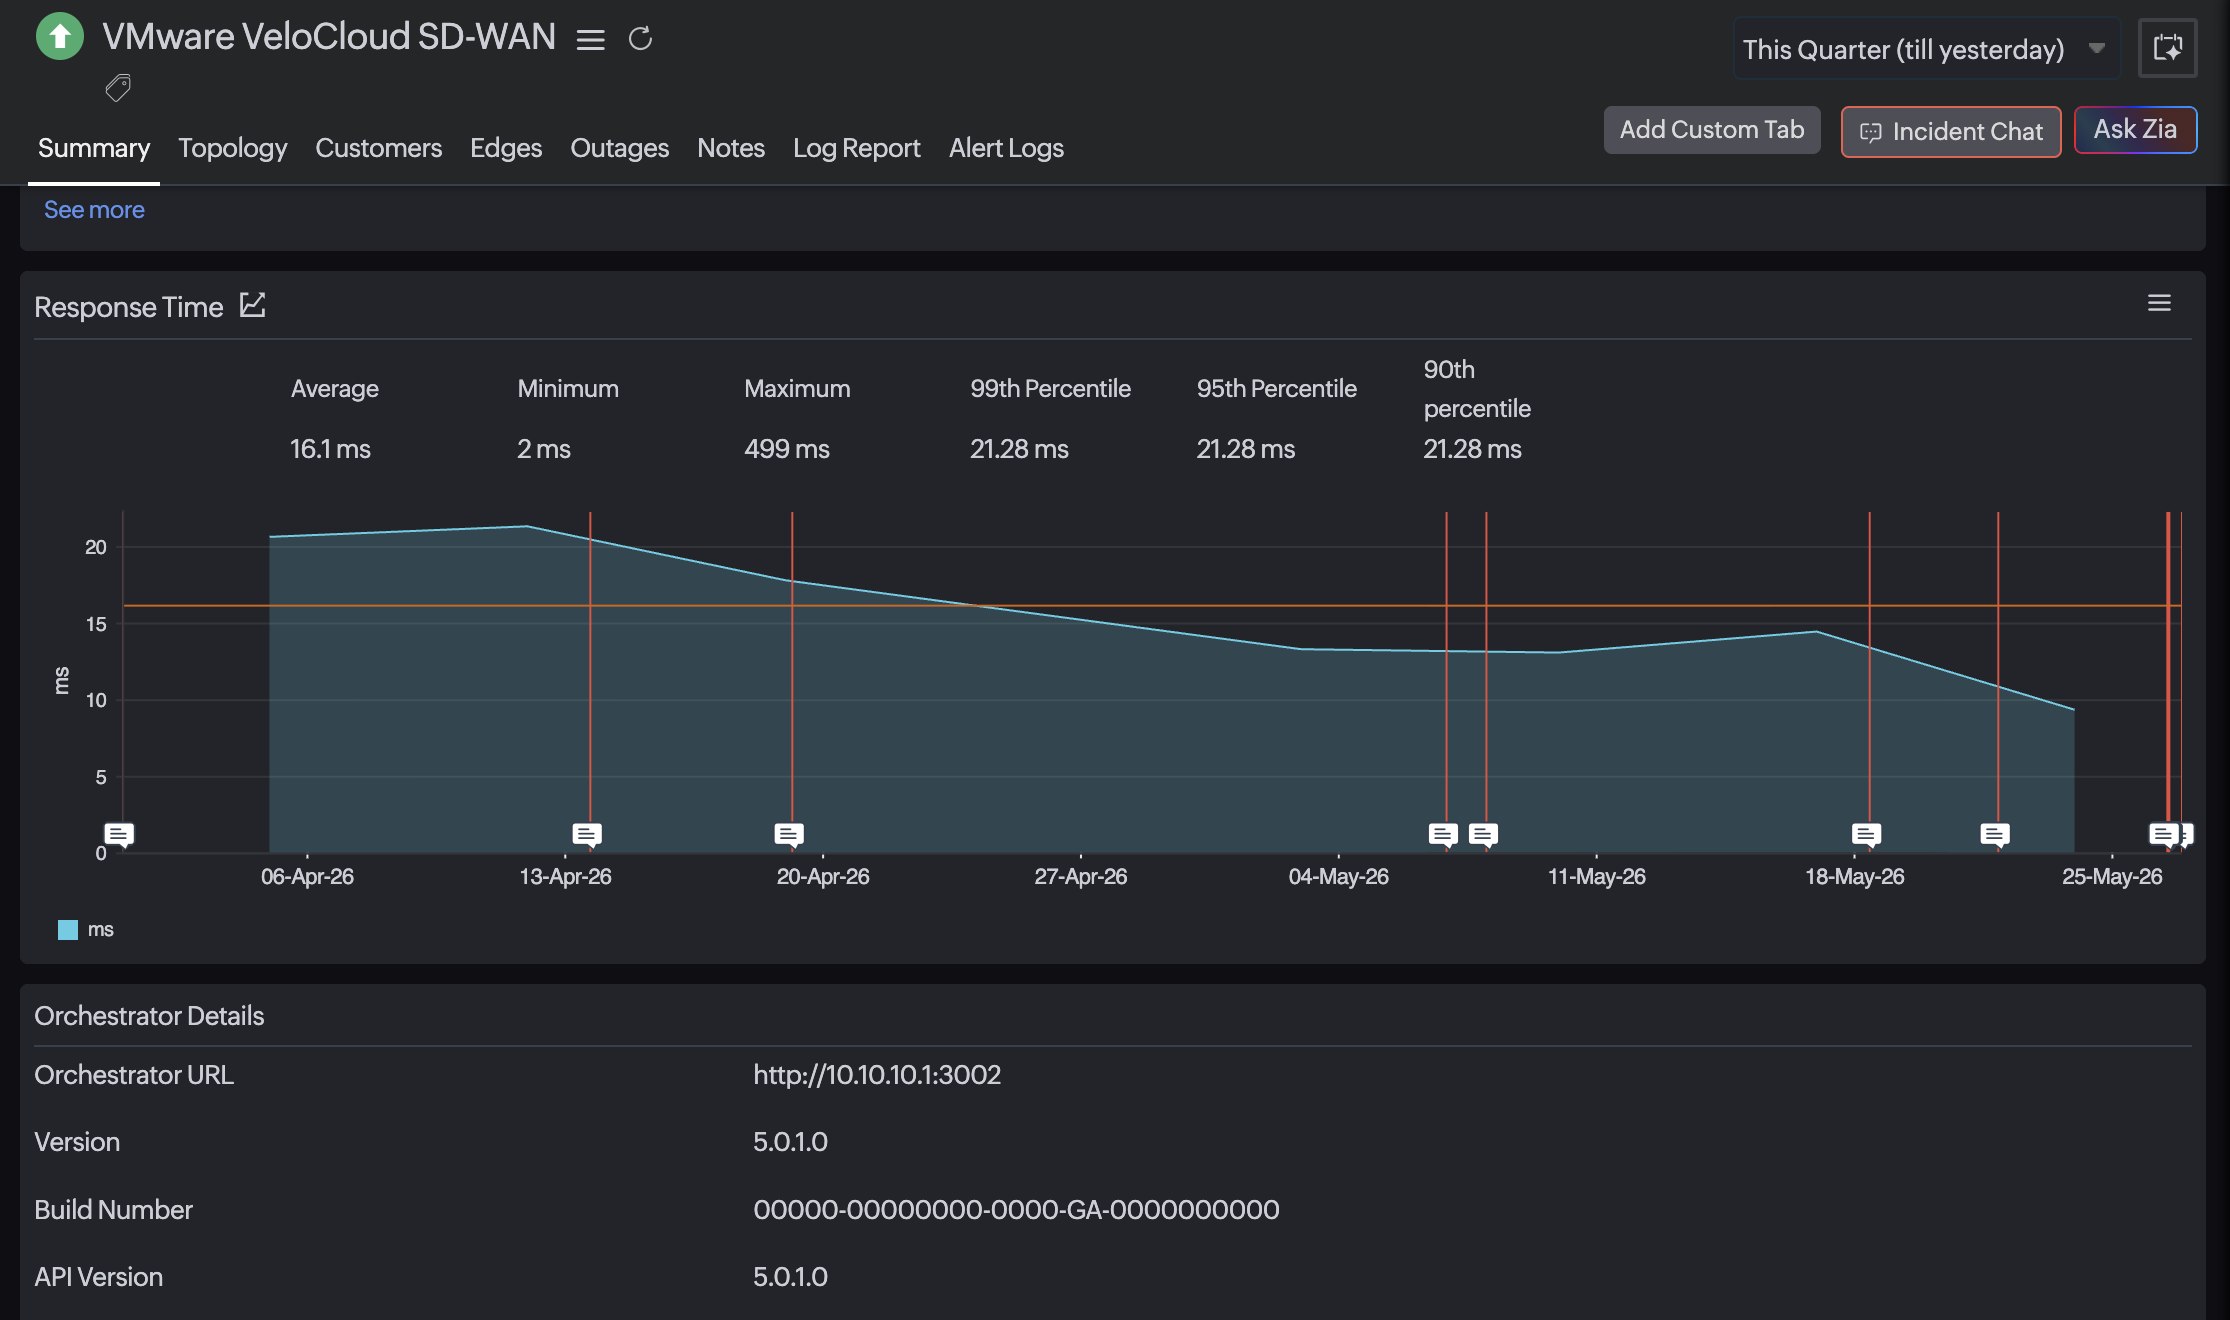
Aruba Central Monitoring
Configure access
Validate the prerequisites before adding the monitor in the next step.
Add Aruba Central SD-WAN as a monitor
Add the Configure Aruba Central monitor using the base URL, client ID, and client secret.
Monitor Wireless Infrastructure
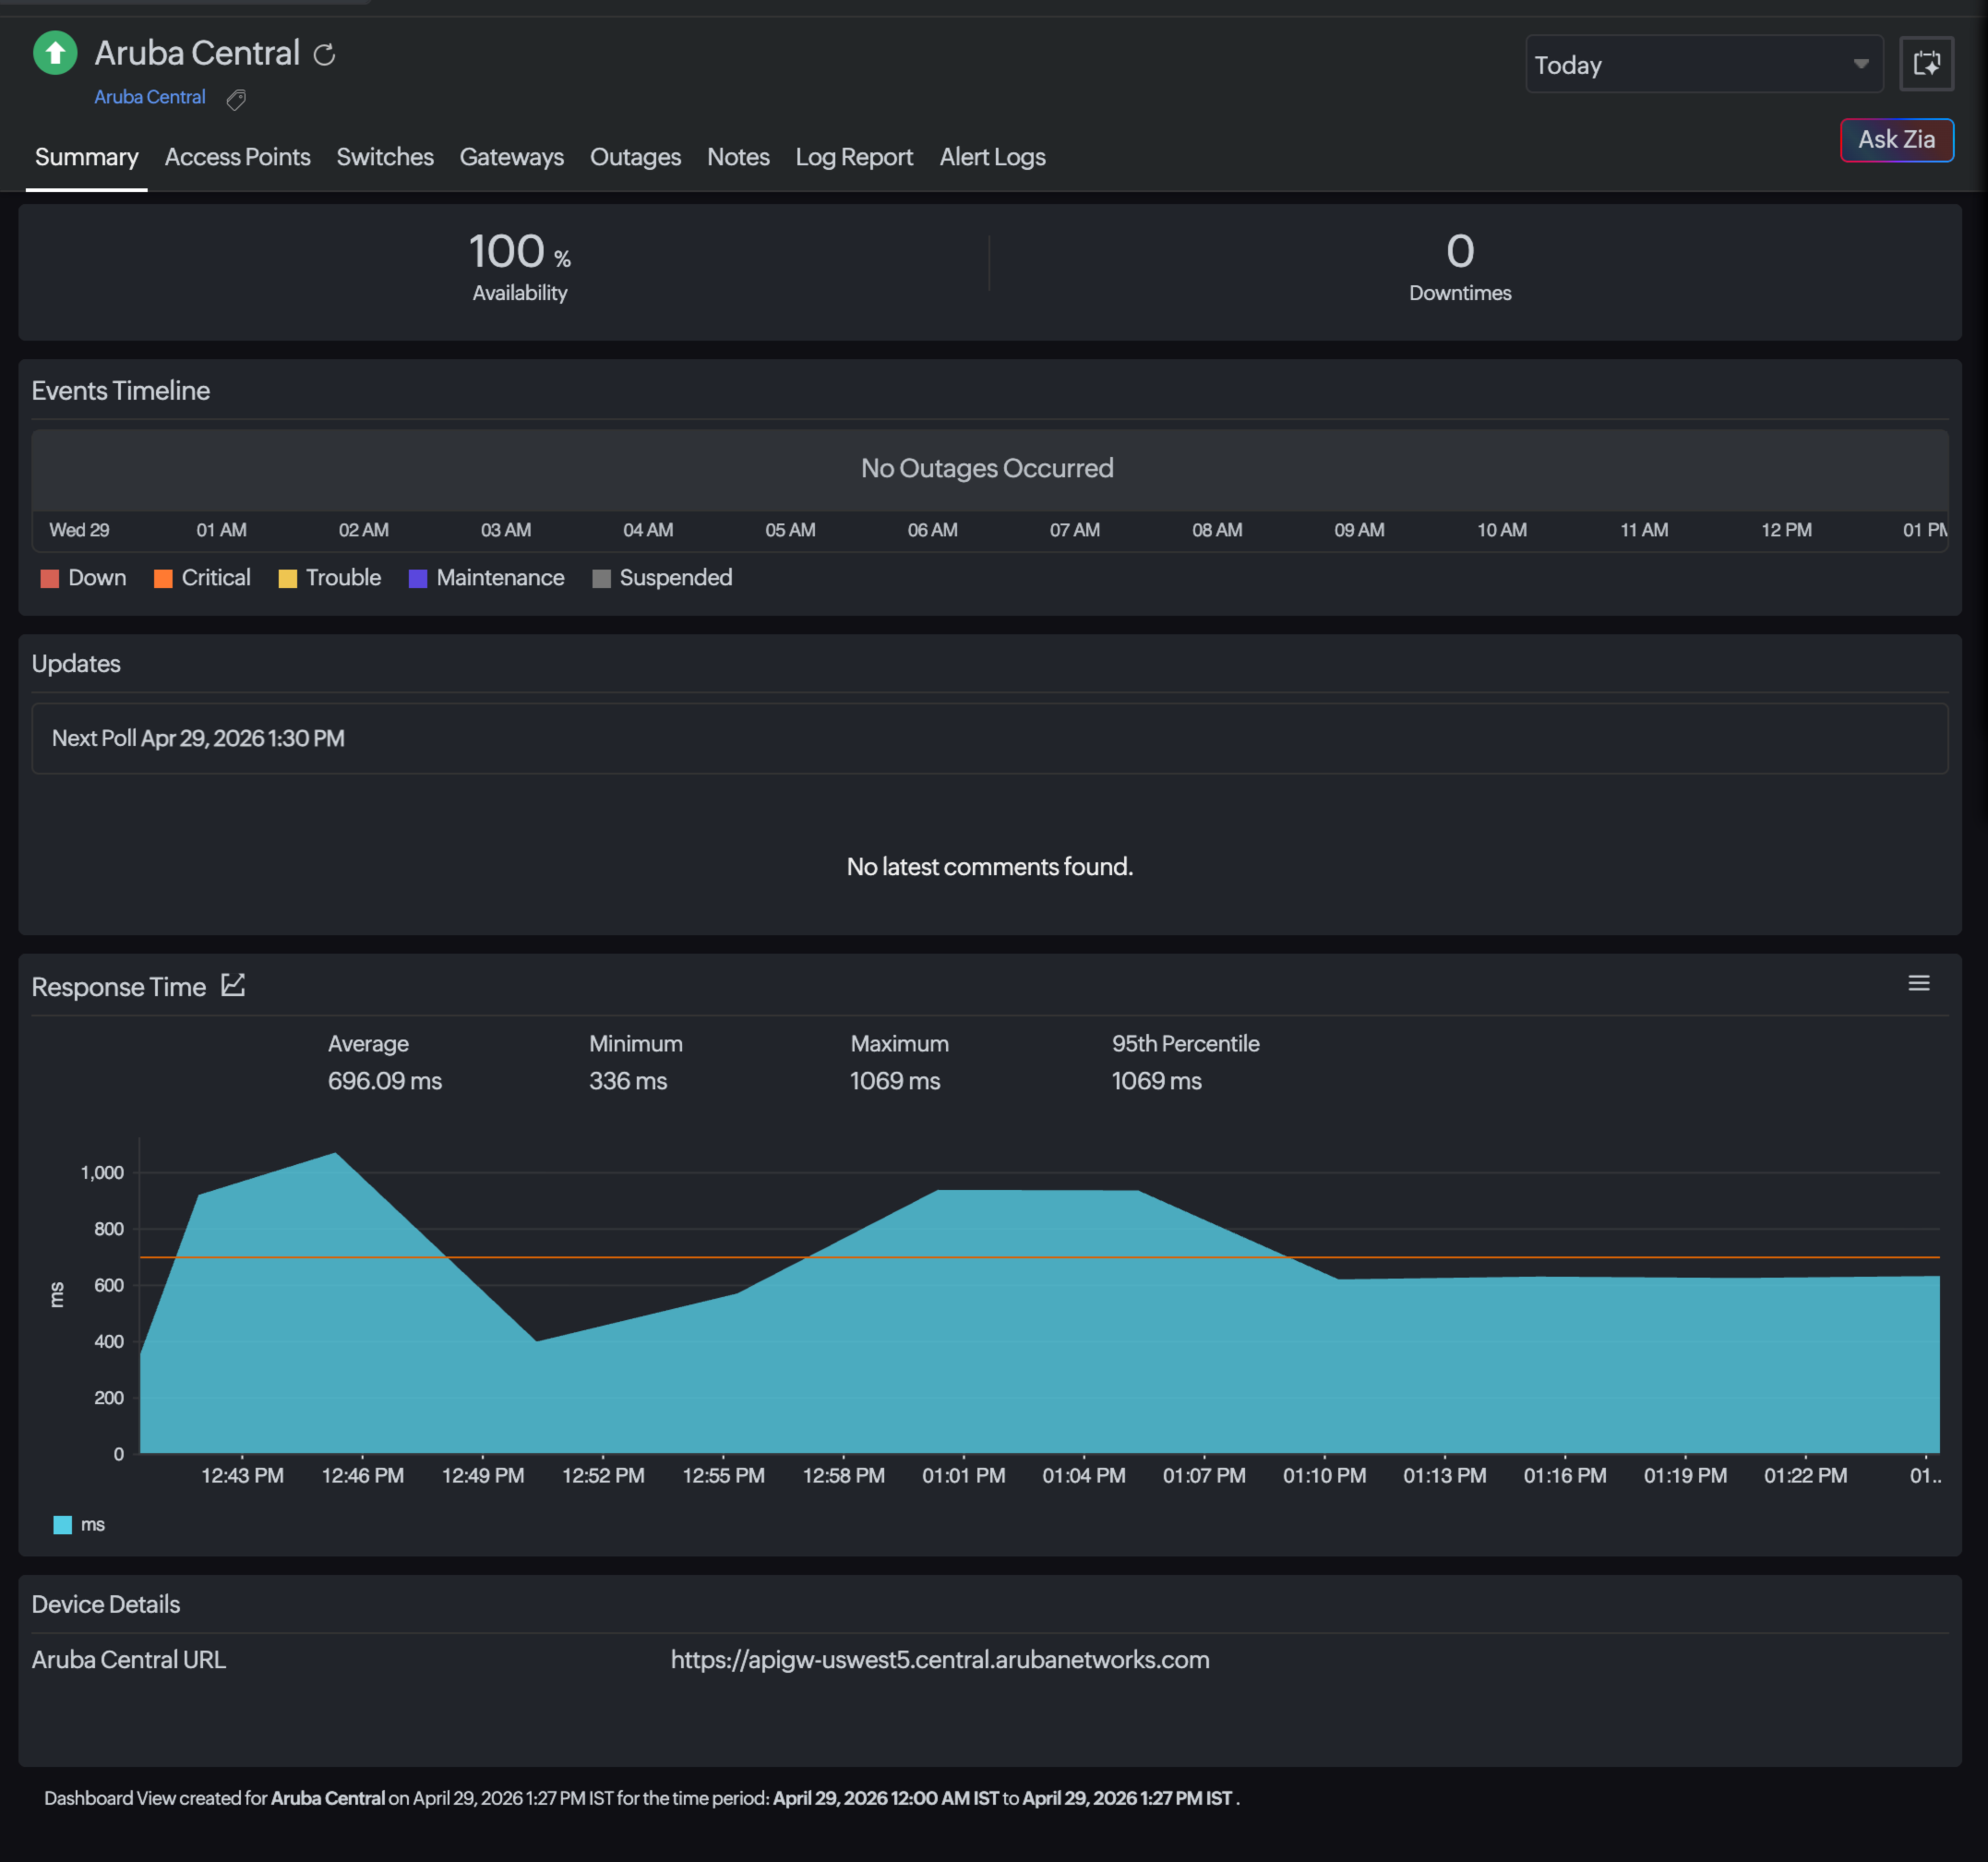
Monitor access points, switches, gateways, client connectivity, device availability, and wireless performance metrics.
-
On this page
- Overview of Site24x7's network monitoring
- Monitoring availability and performance
- Network traffic monitoring
- Network configuration management
- IP Address Management (IPAM)
- VoIP monitoring
- WAN monitoring
- Cisco Meraki monitoring
- Cisco ACI monitoring
- Cisco Catalyst monitoring
- VMware VeloCloud SD-WAN Monitoring
- Aruba Central Monitoring