Monitor Aruba EdgeConnect SD-WANs
Monitor HPE Aruba Networking EdgeConnect SD-WAN devices from a single dashboard to track availability, performance metrics, and network health. Quickly detect outages, analyze performance trends, and maintain stable SD-WAN operations with Site24x7.
Use cases
Explore common use cases for monitoring Aruba EdgeConnect devices and SD-WAN infrastructure:
- Identify downtime and availability issues across EdgeConnect devices.
- Monitor CPU and memory utilization to prevent resource exhaustion.
- Analyze response time trends to validate network performance.
- Track anomalies and maintenance events using timeline visualization.
How it works
Site24x7 collects performance and availability data from Aruba EdgeConnect devices and presents it on a unified dashboard. The monitor aggregates key metrics, such as the availability, response time, CPU usage, and memory utilization, onto a unified dashboard.
Prerequisites
Before adding or viewing an Aruba EdgeConnect SD-WAN monitor, make sure you have a valid Orchestrator URL and credentials to integrate and fetch device data.
Adding a monitor
Add an Aruba EdgeConnect SD-WAN monitor to start collecting performance and availability metrics from your SD-WAN environment.
Viewing the device summary
To view the device summary for your Aruba EdgeConnect monitor:
- Log in to Site24x7.
- Go to SDN > Aruba EdgeConnect > EdgeConnect SD-WAN.
- Click the required EdgeConnect SD-WAN to view its details.
Summary
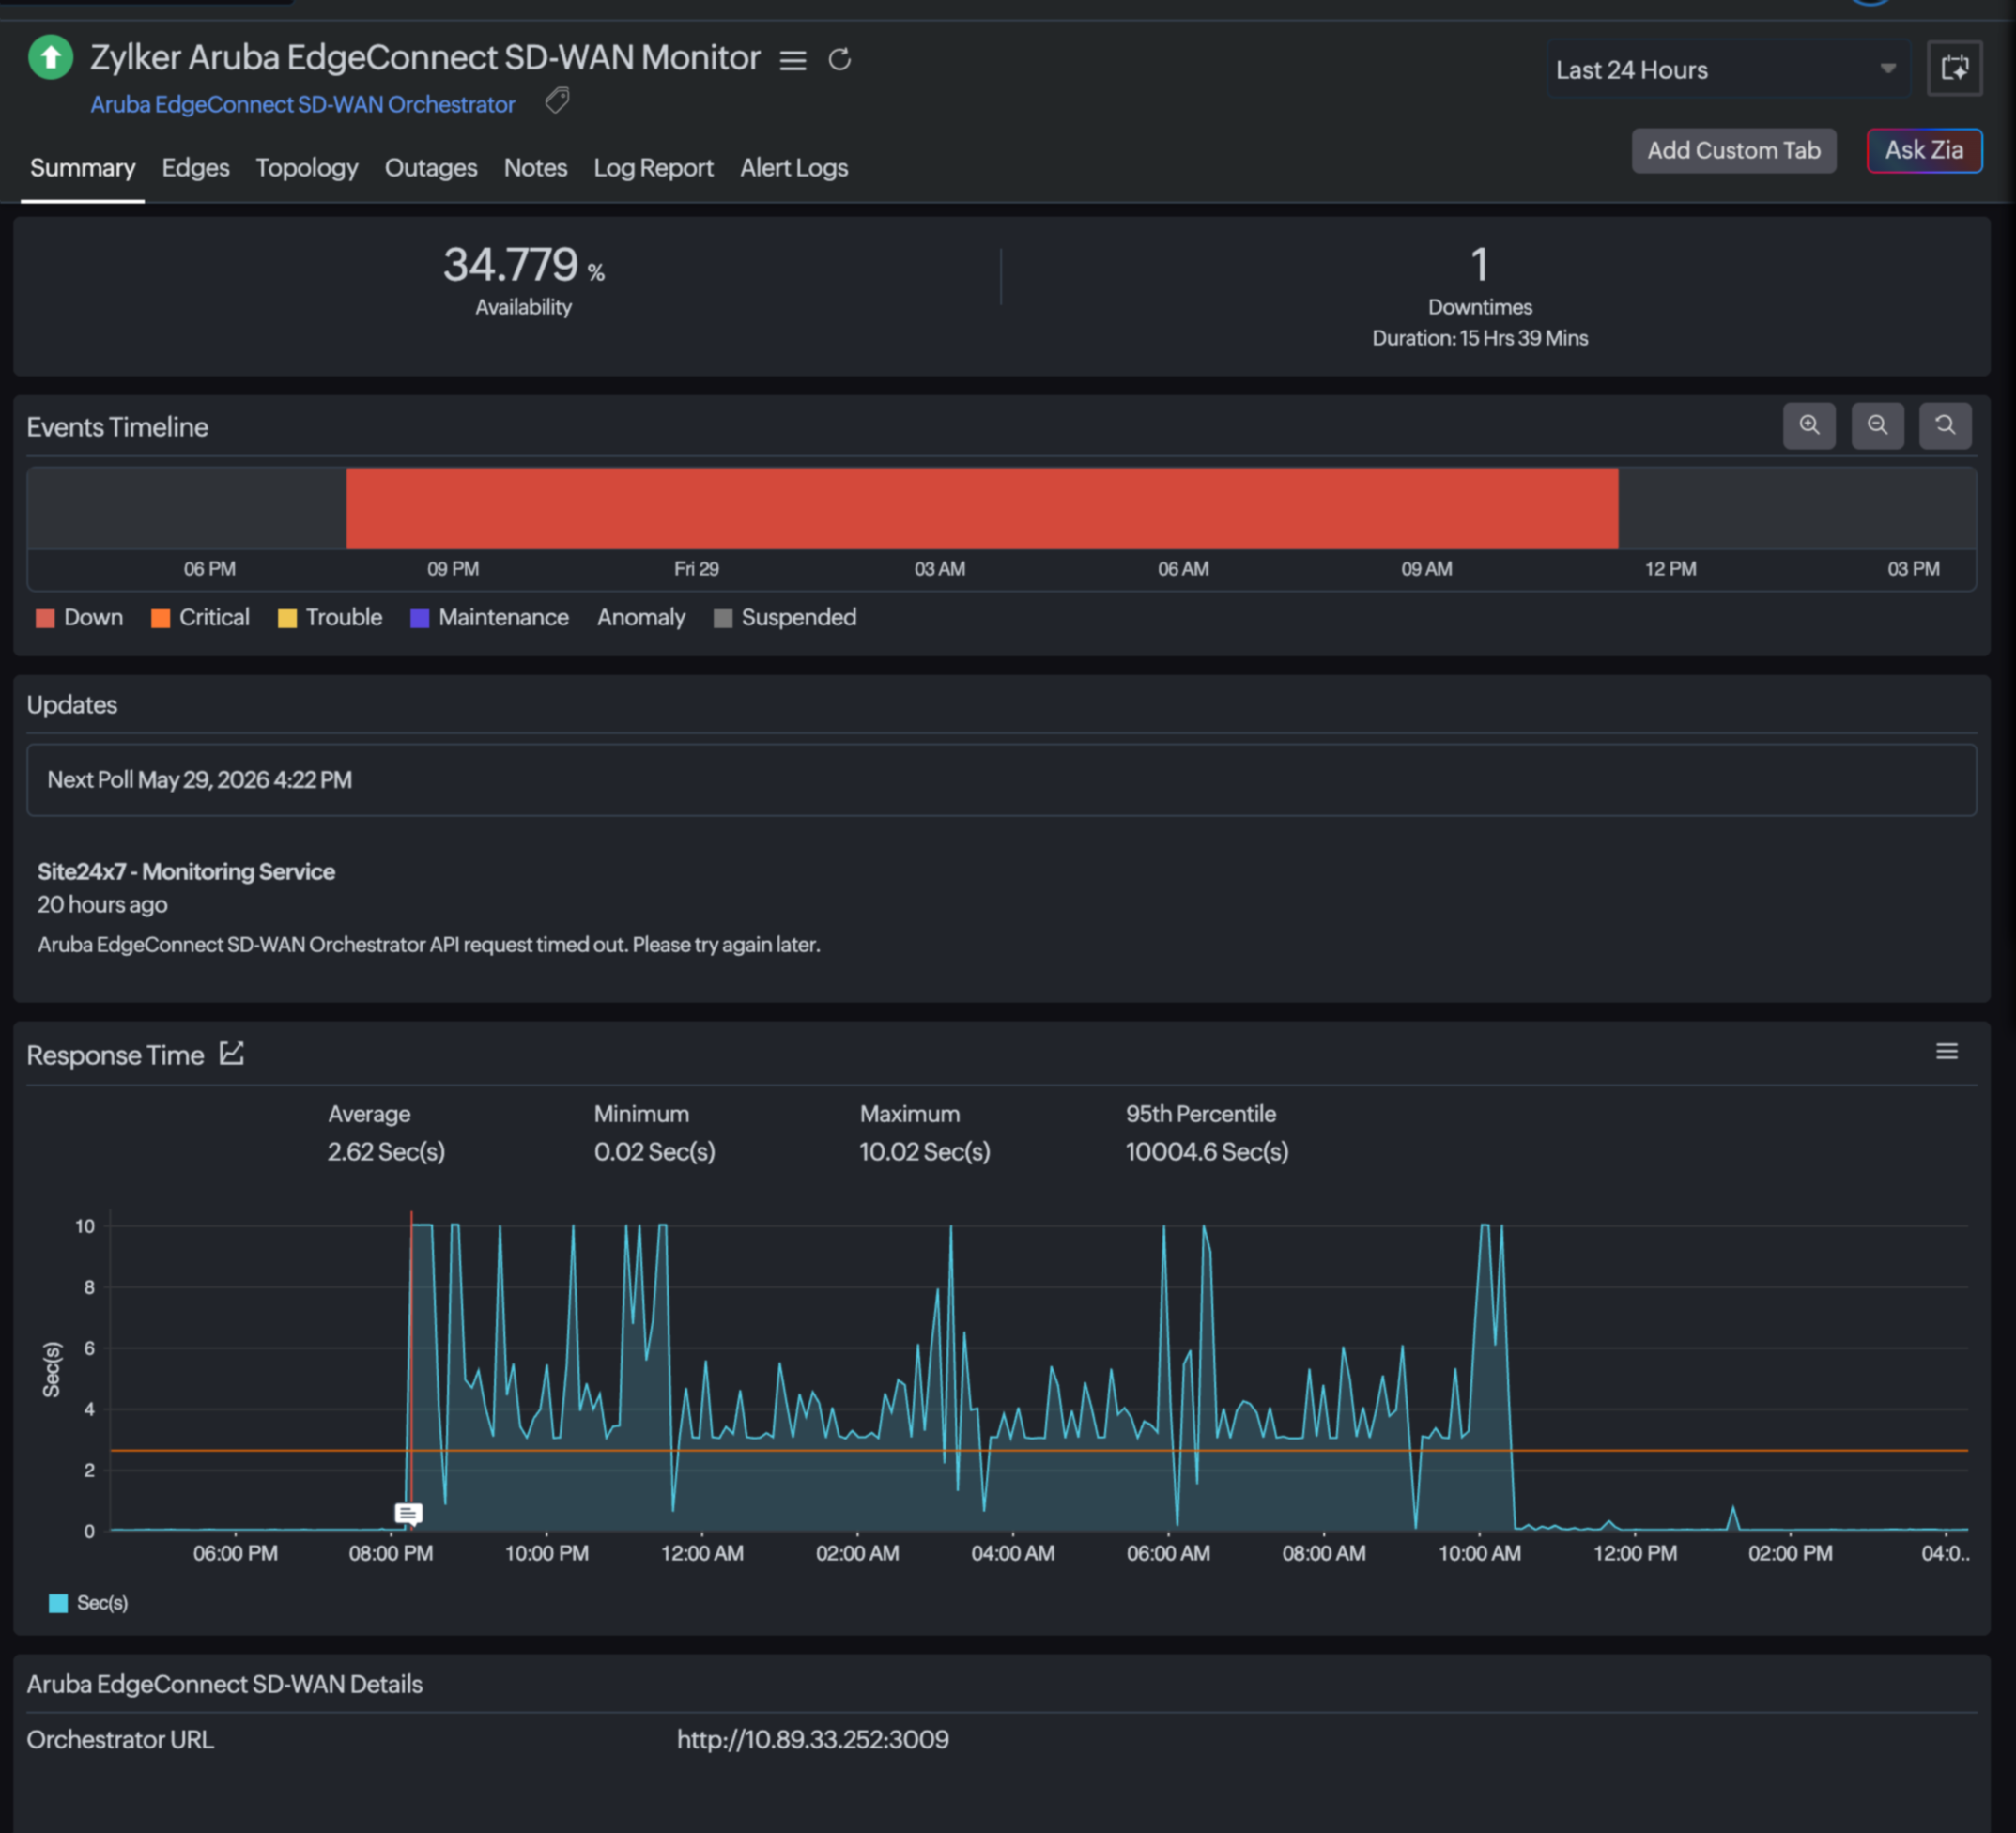
The Summary tab provides a consolidated view of device health and performance.
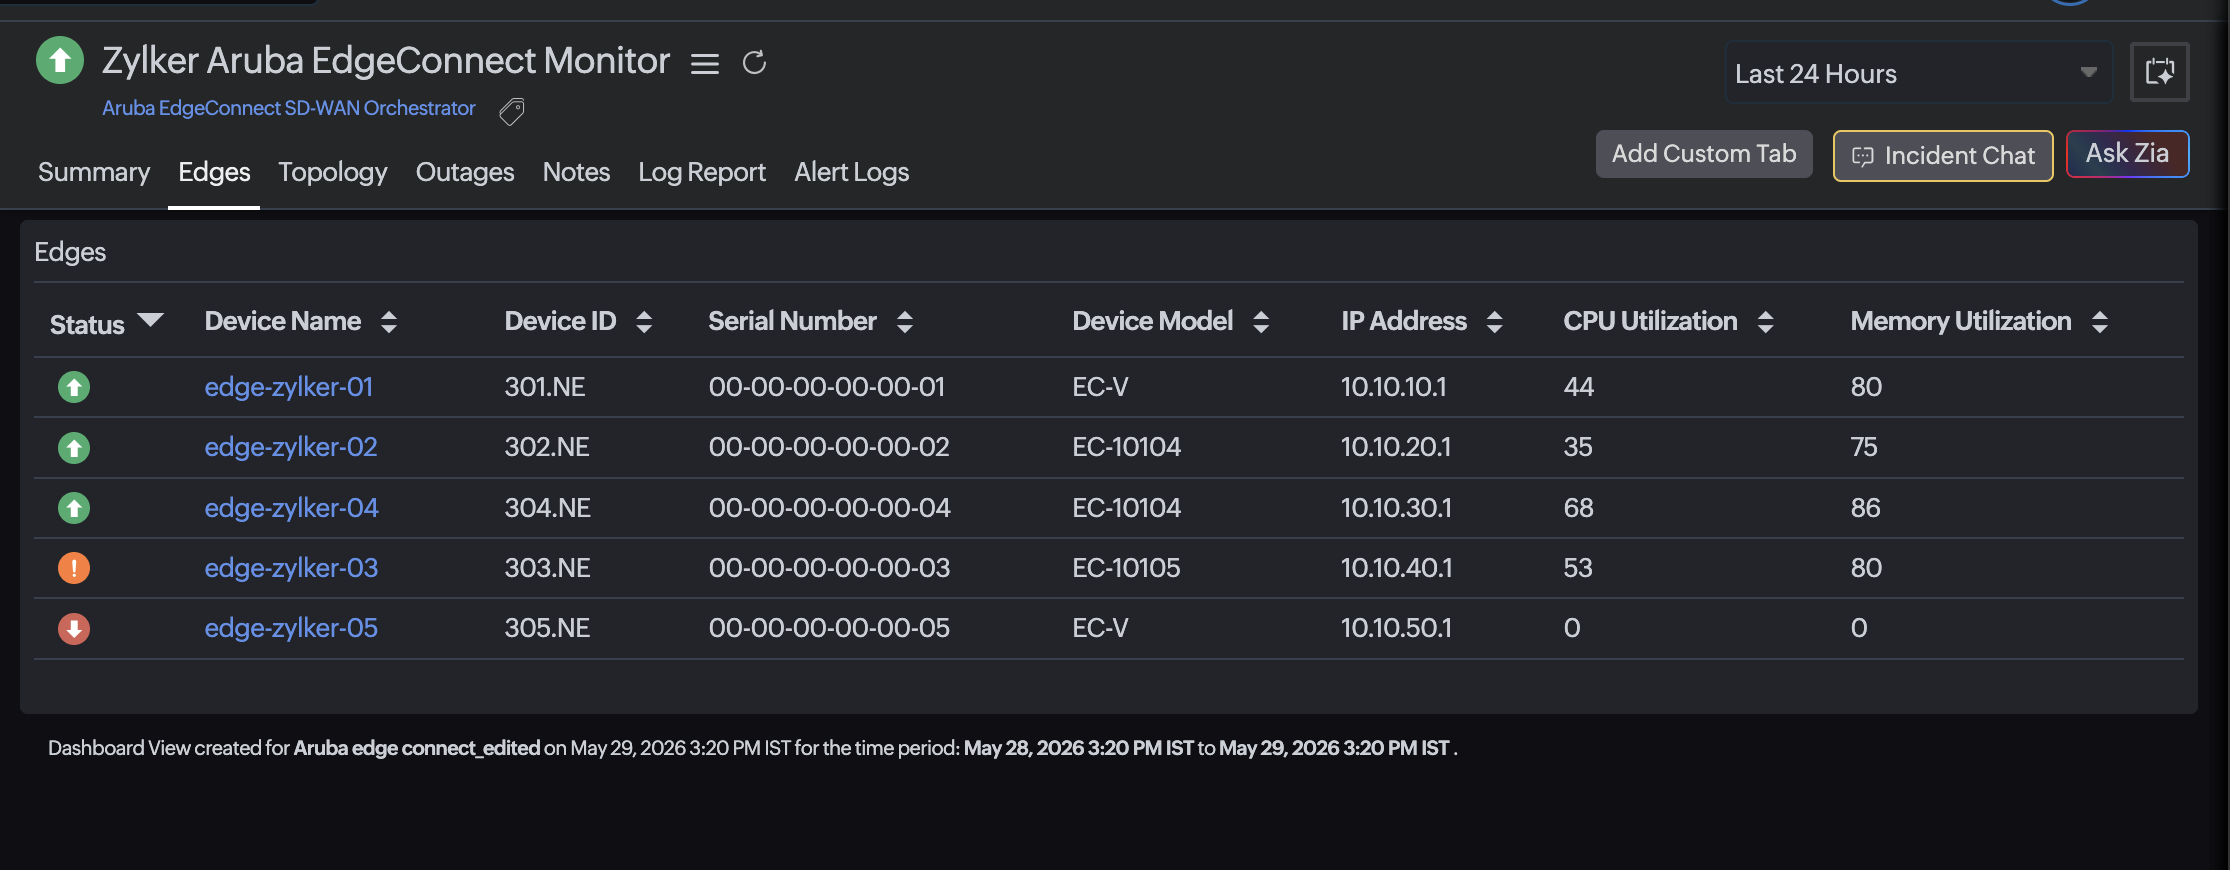
Edges
The Edges tab provides a detailed view of all EdgeConnect devices associated with the SD-WAN monitor. Use this tab to track the device-level performance, availability, and status.
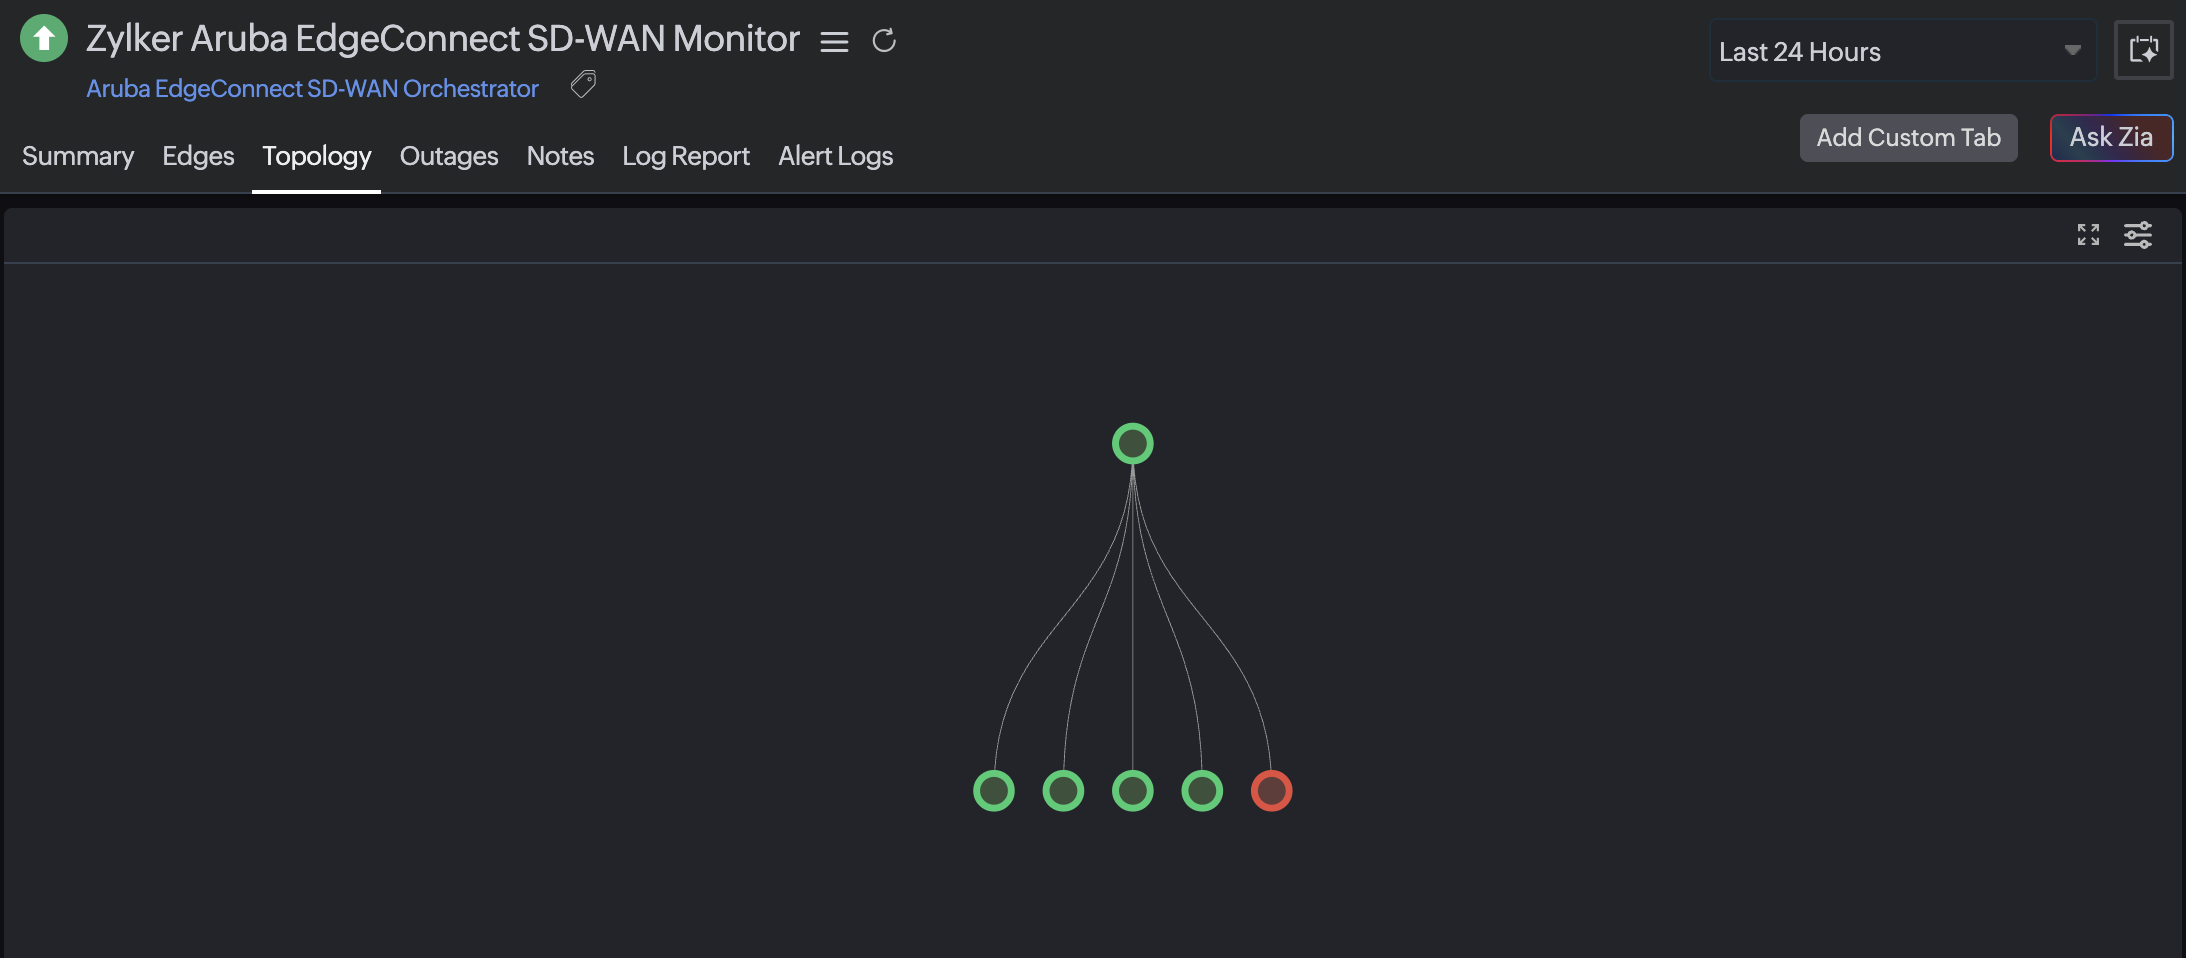
Topology
The Topology tab provides a visual representation of the SD-WAN network, showing how EdgeConnect devices are interconnected.
Events Timeline
The Events Timeline visualizes device status changes over time.
Updates
The Updates section displays recent monitoring activity, including polling updates and system-generated messages.
Performance metrics
The monitor provides key performance metrics, including CPU and memory utilization and the response time, to help you evaluate the device health and network performance. Learn more about all the metrics, their thresholds, and how to interpret them.
Troubleshooting tips
Here are a few common issues and the steps that can be taken to resolve them:
- No performance data displayed
Verify that the device is reachable and that polling is enabled. - Incorrect availability values
Check the network connectivity and polling intervals. - Missing metrics
Ensure the EdgeConnect integration is properly configured. - No events in the timeline
Confirm that monitoring is active and that no filters are applied.