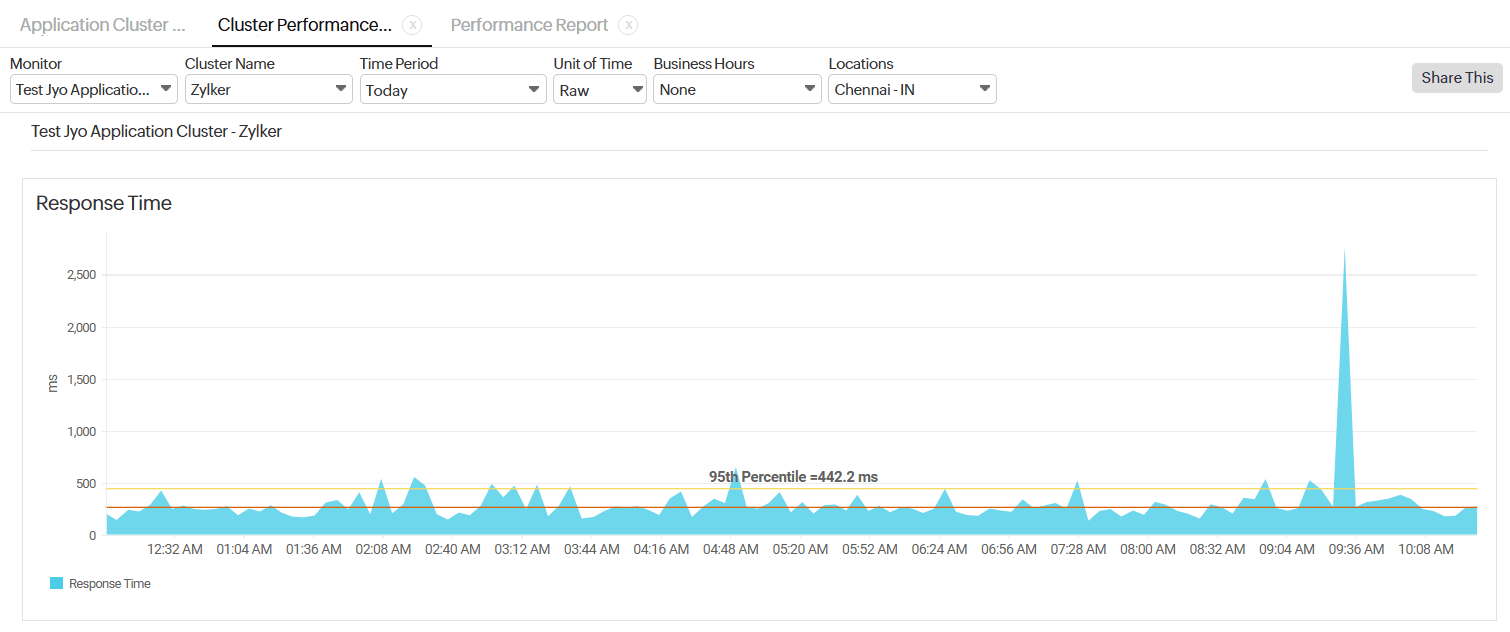
Cluster Performance Report
The Cluster Performance Report provides detailed information on response time and response time by location for a monitor's cluster. In the Application Cluster monitor, you can find the performance of individual clusters based on their locations.
Supported monitor type
Generating a Cluster Performance Report
- Log in to your Site24x7 account.
- Navigate to Reports > Application Cluster > Cluster Performance Report.
- Select the required monitor from the header drop-down and change the listed parameters to view a customized report:
- Monitor: Select the desired monitor from the drop-down.
- Cluster Name: Select the preferred cluster name for the selected monitor from the drop-down.
- Time Period: Choose the required time-period for which the report needs to be generated.
NoteYou can generate reports for time periods from the last one, six, 12, or 24 hours, as well as any custom date range for the previous year.
-
Unit of Time: Select the desired unit of time.
NoteLearn more about the granularity supported for each time period.
- Business hours: Select the time period that is most critical to your business.
- Locations: Select the preferred location or On-Premise Poller agent from which you want to get the report.
- Once the report is generated, click the Share This button in the top-right corner.
- Export CSV: Export the report as a CSV file.
- Export PDF: Export the report as a PDF file.
- Email: Share the report via email. Emails can be sent to only those verified users who have agreed to receive emails from Site24x7.
Interpreting cluster performance reports
Based on the monitor's cluster, you can view and analyze the various performance trends of the selected monitor. The information will be displayed in graphical format.
Response Time

This graph displays the response time of your cluster over a selected period for the selected monitor.
Use the 95th percentile marker to identify outliers and evaluate typical performance under load.
Response Time by Location
This graph displays the application's response time trends from the selected location. This helps to identify latency issues specific to a region and optimize performance based on location.
The 95th percentile line helps pinpoint performance outliers for more accurate analysis.

