Unified Add Monitor view for APM Insight
The Add APM Insight Monitor page provides a single entry point for APM observability, bringing the available APM monitoring and instrumentation options together on a single page.
This unified view helps you identify the appropriate monitoring approach based on your application environment and deployment requirements.
Access the Add APM Insight Monitor page
To access the unified Add Monitor page:
- Log in to your account.
- Navigate to Admin > Add Monitor.
- Under Application Performance Monitoring, click APM Insight Application.
- The Add APM Insight Monitor page will open with the available monitoring options.
Monitoring options
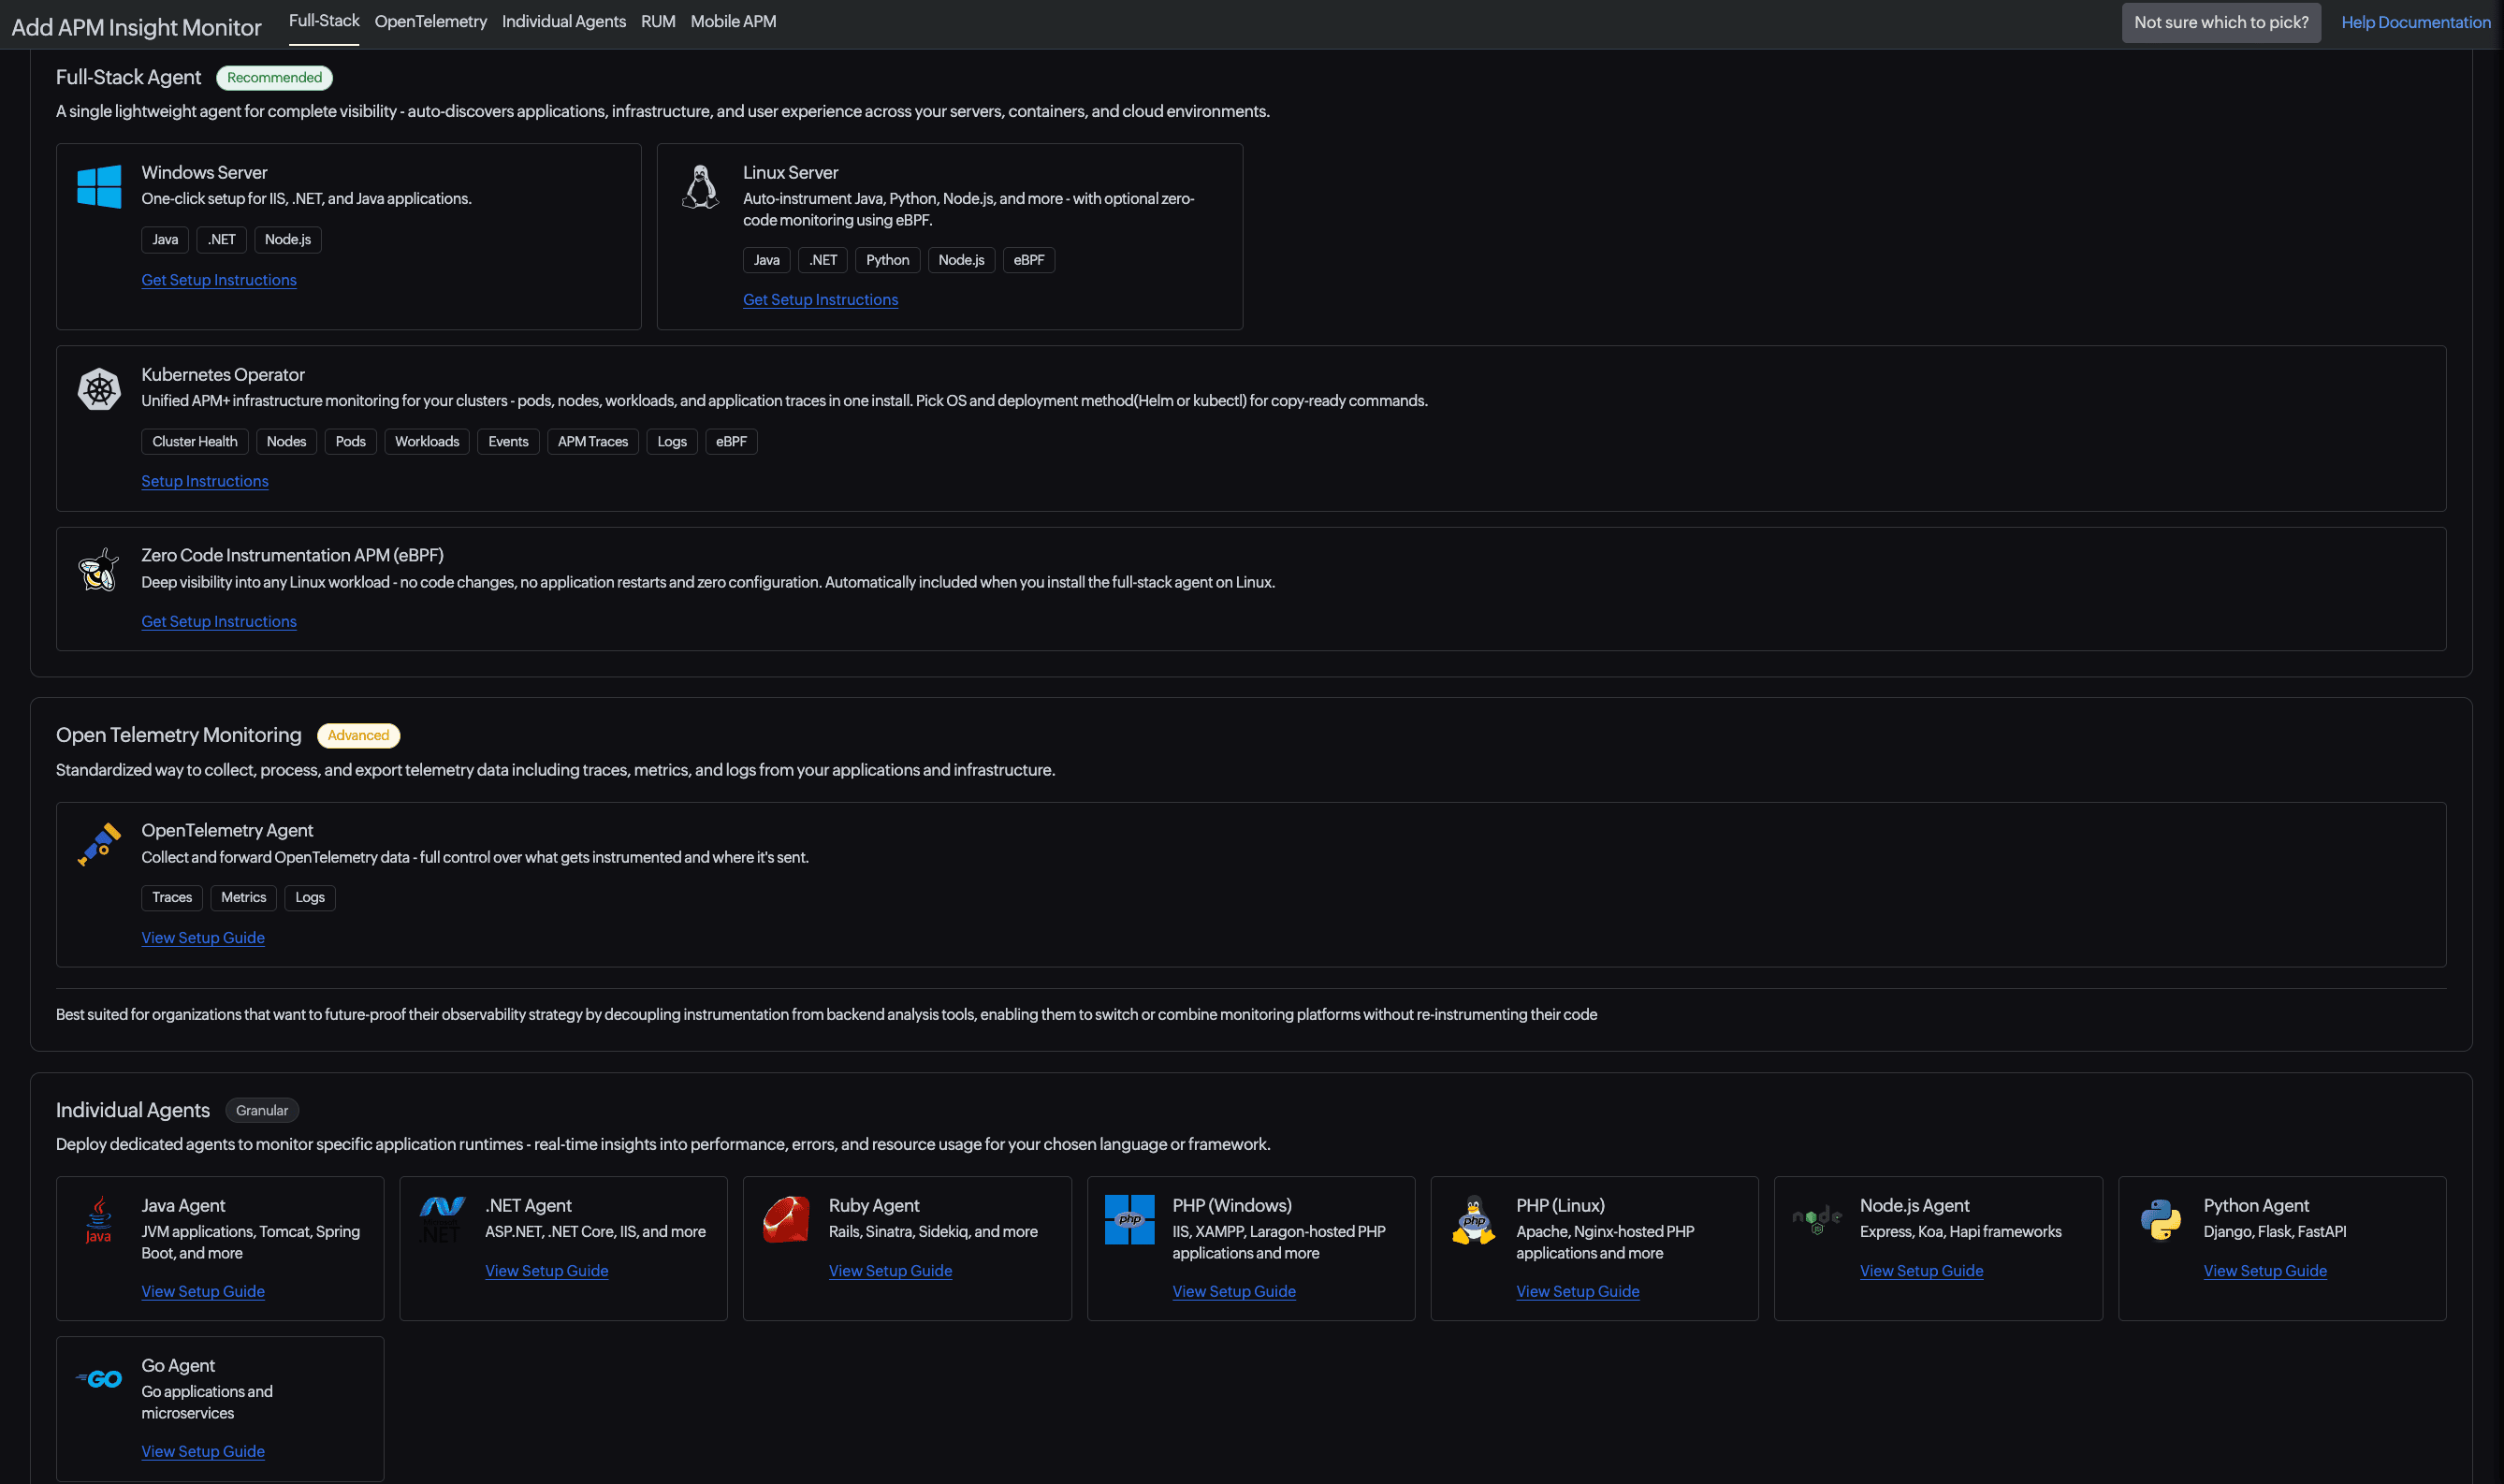
The Add APM Insight Monitor page organizes the available options into the following sections:
Full-Stack
The Full-Stack tab provides options for comprehensive application and infrastructure monitoring from a single setup.
You can configure monitoring for:
- Windows Server: Set up monitoring for IIS, .NET, Java, and Node.js applications.
- Linux Server: Monitor Java, Python, Node.js, and other applications, with optional zero-code monitoring using eBPF.
- Kubernetes Operator: Set up unified APM and infrastructure monitoring for Kubernetes clusters, including pods, nodes, workloads, application traces, logs, and other telemetry.
- Zero Code Instrumentation APM (eBPF): Monitor Linux workloads without code changes or application restarts. This option is automatically included when you install the Full-Stack Agent on Linux.
Use the respective Setup Instructions link to proceed with the required installation.
OpenTelemetry
The OpenTelemetry section enables you to collect and forward telemetry data using vendor-neutral OpenTelemetry standards, including environments where telemetry instrumentation is already in use.
Use the OpenTelemetry agent to collect distributed traces, metrics, and logs from your applications and infrastructure, with visibility into service and trace maps. Click View Setup Guide to proceed with the configuration.
Individual Agents
The Individual Agents section lets you deploy a dedicated APM agent for a specific application runtime or programming language.
The following agents are available:
- Java Agent
- .NET Agent
- Ruby Agent
- PHP (Windows)
- PHP (Linux)
- Node.js Agent
- Python Agent
- Go Agent
Click View Setup Guide for the required agent to view its installation and configuration instructions.
Real User Monitoring (RUM)
The RUM section helps you monitor the experience of users accessing your web applications from their browsers. It provides visibility into page load performance, AJAX/XHR calls, JavaScript errors, Core Web Vitals, user sessions, geographical performance, business analytics, and distributed tracing from browser calls to APM for end-to-end data flow visibility.
You can configure RUM for:
- Traditional Wweb Aapplication: For multi-page applications with full page reloads.
- Single page application (SPA): For client-rendered applications with dynamic route changes, such as applications built using React, Angular, or Vue.
Click Get JS Snippet for the required application type to proceed with the setup.
Mobile APM
The Mobile APM section provides monitoring options for native and cross-platform mobile applications. It helps track application crashes, ANRs or hangs, network performance, screen rendering, user sessions, and other mobile application performance data.
The available options include:
- Native SDKs: Android and iOS
- Cross-platform frameworks: React Native and Flutter
Click View SDK Setup for the required platform or framework to proceed with the configuration.
Navigate using the tabs
The tabs at the top of the Add APM Insight Monitor page provide quick access to the different sections.
By default, the Full-Stack tab displays the unified page containing all the available monitoring options. You can scroll through the page to explore each section.
You can also use the OpenTelemetry, Individual Agents, RUM, and Mobile APM tabs to directly navigate to the corresponding section on the same page. This makes it easier to access the setup option you need without manually scrolling through the entire list.
If you are unsure which monitoring option to select, click the Not sure which option to choose? info icon for guidance on choosing the appropriate monitoring option.
Licensing
Licensing varies based on the monitoring option you use. The following table provides an overview of how licensing is calculated:
| Monitoring option | Licensing calculation |
|---|---|
| Full-Stack |
Licensing depends on the monitoring components enabled. Server monitoring is based on the number of servers or VMs monitored, application performance monitoring (APM) is based on application instances, and Kubernetes monitoring is based on containers, with node-level pricing also available. |
| OpenTelemetry | Licensing depends on the Site24x7 monitoring services used for the telemetry data collected through OpenTelemetry. |
| Individual Agents | Application performance monitoring (APM) is licensed based on the number of application instances monitored. |
| Real User Monitoring (RUM) | Licensing is based on the number of page views monitored. Know more about pageviews. |
| Mobile APM | Mobile APM licensing is based on Credits. |
Note: Licensing and pricing are subject to change. Refer to the pricing page for the latest details.
-
On this page
- Access the page
- Monitoring options
- Navigation using tabs
- Licensing