Audit Logs
Audit Logs provides visibility into user actions for compliance and accountability within each Site24x7 account. It records configuration changes, user logins, API calls, resource deletions, and more, along with details such as who performed the action, when it occurred, how it was initiated (e.g., through an API or bulk operation), and what changed. This helps you quickly trace the source of misconfigurations, unauthorized changes, and operational issues.
What can Audit Logs do?
Audit Logs supports a range of investigative and compliance-related scenarios:
- When alerts stop arriving for a critical server, identify who suspended the monitor and when, enabling quick recovery and accountability.
- Track API-driven changes to uncover misconfigured scripts or unauthorized updates that silently modify monitor settings and thresholds.
- Trace bulk operations down to individual monitor audit records for faster investigations.
- Monitor subscription-related changes to understand how billing actions impact monitoring coverage and resource limits.
- Review user access activity to detect suspicious logins, trace configuration changes, and support security investigations.
Who can access Audit Logs?
Audit Logs can be accessed by users with the role of Admin, Super Admin, or MSP Admin, and by custom role users who have been granted the relevant permission.
How is Audit Logs accessed?
Audit Logs is accessible from multiple entry points within Site24x7, letting you reach the relevant audit trail from wherever you are working:
- From Home: Navigate to Admin > Operations > Audit Logs.
- From monitor detail pages: Navigate to Home > Monitors, click any monitor, and select the Audit Logs tab.
- From Monitor Groups: Navigate to Home > Monitor Groups, click any monitor group, and select the Audit Logs tab.
- From Alarms: Navigate to Home > Alarms > Audit Logs.
- From AppLogs: Navigate to Admin > AppLogs and select Audit Logs as the log type.
NoteWhen accessing Audit Logs from a monitor or monitor group page, enable the Include related audit activities check box to include audit events from associated resources such as Configuration Profiles.
How does the Audit Logs page work?
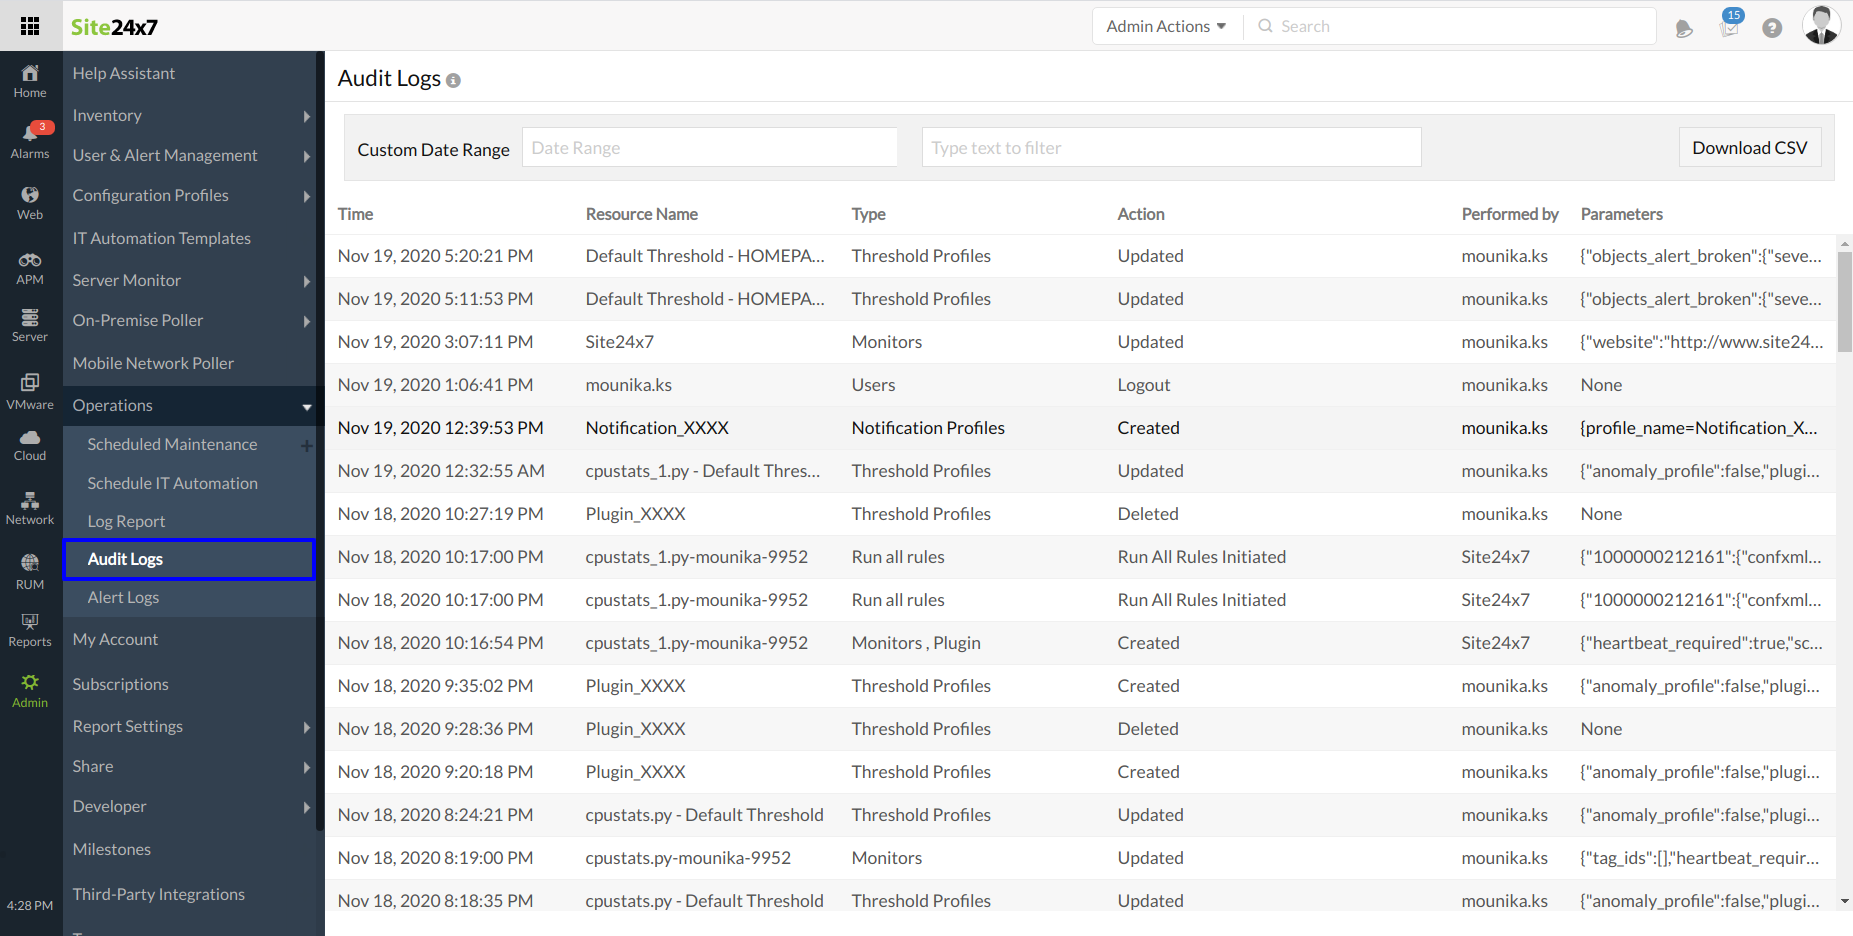
The Audit Logs page uses the same query-language-based search as AppLogs, giving you a consistent and powerful way to filter and explore log data. The page is organized into three sections:
Query field
The query field lets you filter audit data and manage your search experience. From here, you can switch between the Audit Logs list and a dashboard view, access previously saved queries from the history menu, download or email results as a PDF or CSV, and share queried logs with your team.
Log Events
Filtered log results are visualized as a chart, available in Line, Area, or Bar chart formats, giving you a quick view of activity volume and trends over the selected time period.
Log details
The log details table displays individual audit entries. You can customize the columns displayed, switch between a tabular view and a raw JSON view, adjust font size for readability, and save a default view using + Create New View. Key columns include Time, Performed By, Resource name, Action, Resource Name, Type, Description, New Parameters, Old Parameters, IP Address, Browser, Device Type, Country, Session Identifier, and Source.
What fields can Audit Logs be filtered by?
When building a search query, you can filter audit log data using the following fields:
- Performed By: The user who initiated the action.
- User ID: The unique identifier of the user who initiated the action.
- Action: The operation performed, such as Create, Update, Delete, Login, Logout, Activate, or Suspend.
- Resource Name: The name of the resource that was modified.
- Type: The category of the resource, such as monitor, user, or configuration profile. If the resource is a monitor, then the monitor type is given.
- Description: The summary text of the activity performed. For Delete and Suspend activities, the description provided by the user is shown without modification.
- IP Address: The source IP address associated with the action.
- Browser: The browser used to perform the operation.
- Device Type: The device used, such as desktop or mobile.
- Country: The geographical location from which the action originated.
- Session Identifier: The encrypted form of session ID associated with the user activity.
- Source: Where the action originated—web console, mobile app, API, or Terraform.
What does drilling into a log entry show?
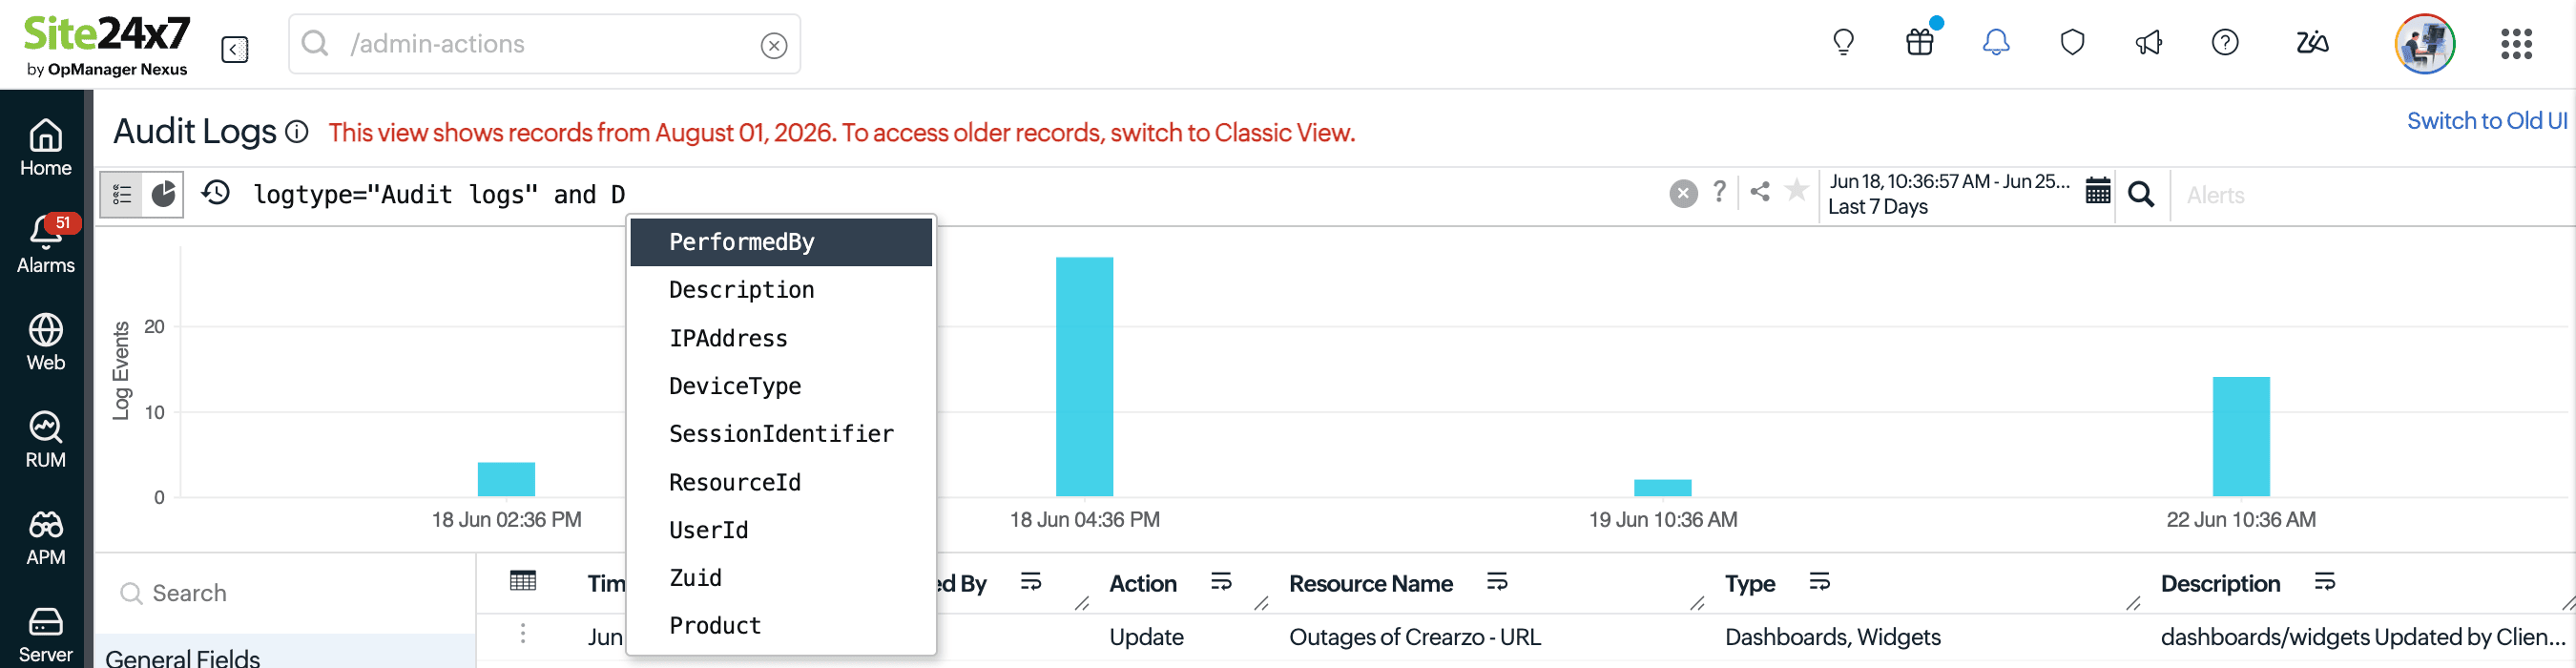
Clicking any audit log entry opens a detailed panel showing the full context of the event:
- Resource Name, Type, and Action: Displays details such as which monitor was updated, the type of the monitor, and what operation was performed (e.g., Create, Update, Delete, Login, Suspend).
- Time, Performed By, and Source: Displays the time the change happened, who did it, and whether it originated from the mobile app, API, or Terraform.
Browser, Device Type, Country, and IP Address: Displays the environmental and location context for the action. - Description: Displays a summary of why the activity was performed.
- Changes: Displays a summary of which resources were modified, with the previous and new changes displayed side by side.
- Parameter Changes: Displays a side-by-side comparison of old and new configuration parameters. You can click Show changes only to filter down to just the modified fields and use the navigation controls to move through differences in large configurations.
How are alerts set up based on Audit Logs?
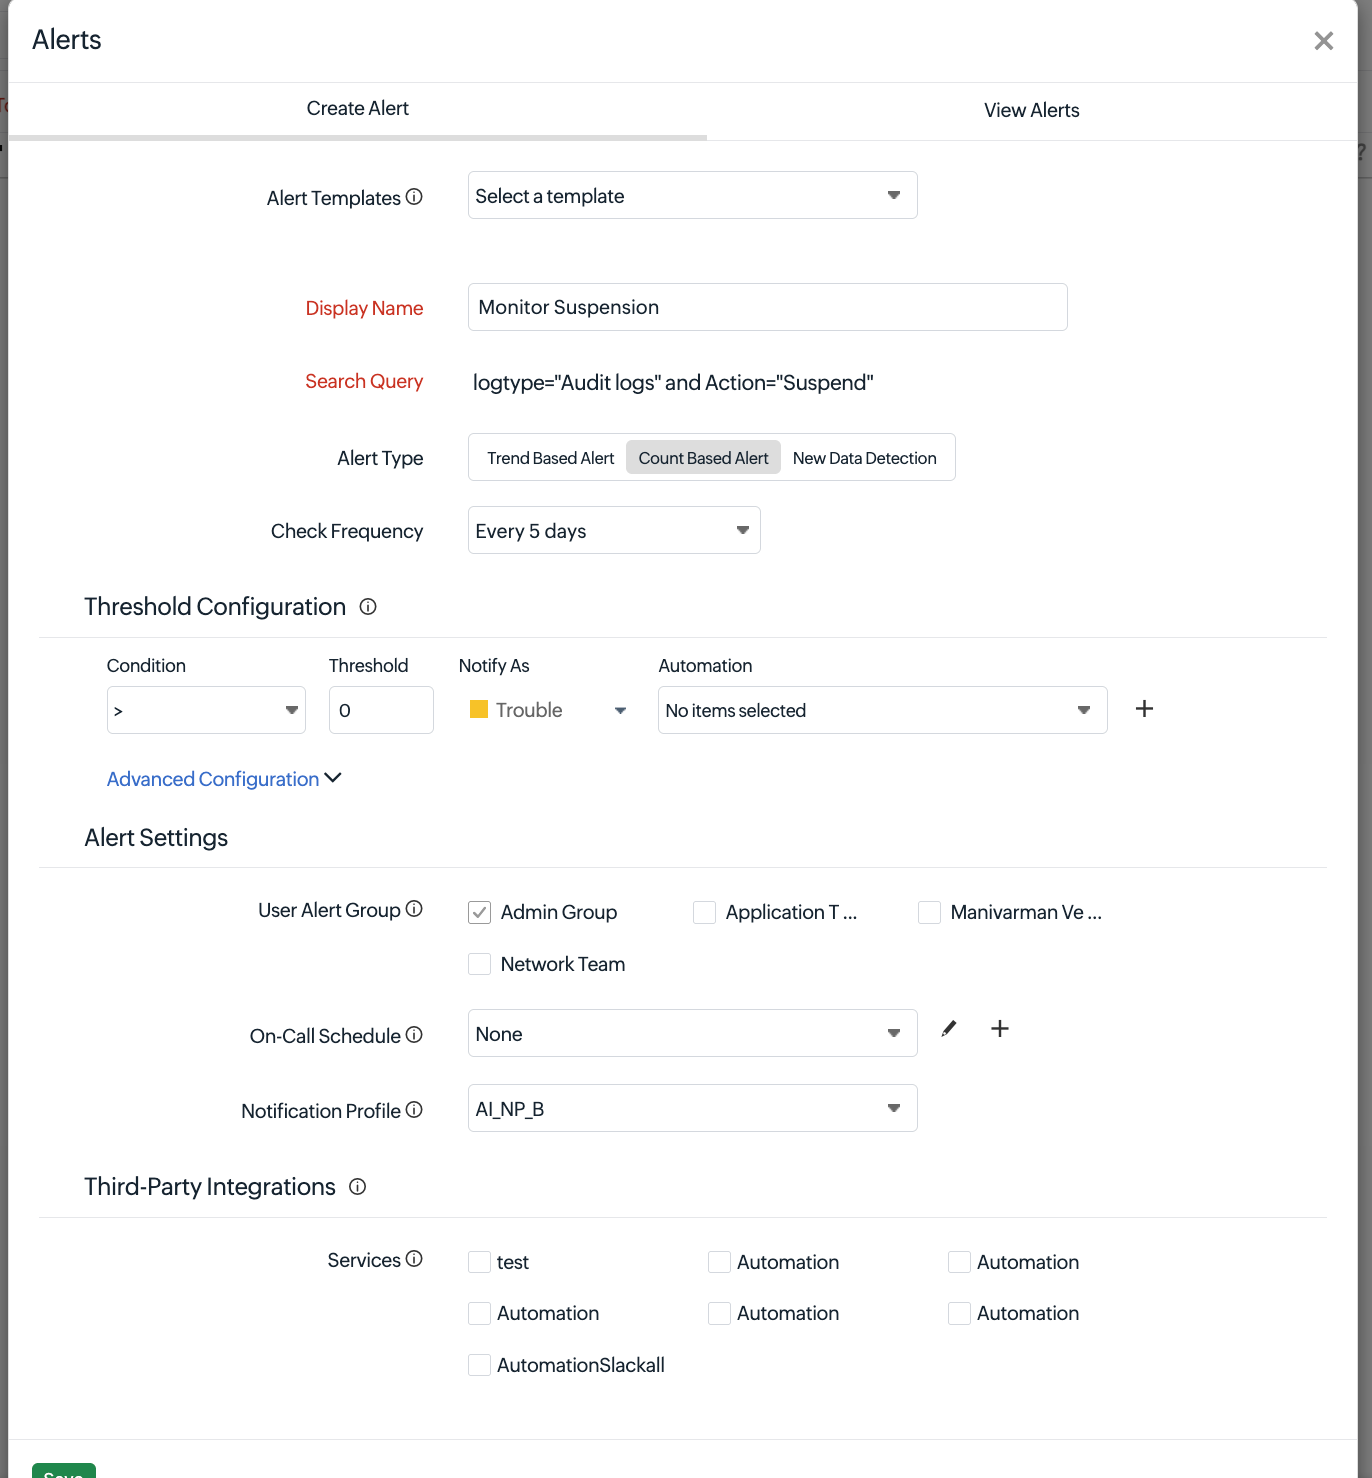
You can create alert templates directly from the Audit Logs page to get notified when specific log conditions occur, without continuously monitoring logs manually. Site24x7 provides default quick templates for common scenarios such as Recent Deletions, Recent Suspensions, Excessive Write Operations, Excessive API Requests, and User Activity.
To create a custom alert template, configure the following:
- Display Name: Provide a name for the alert template.
- Search Query: This field is pre-filled with your current query.
- Alert Type: Choose a type of alert from the following:
- Trend Based: Detects anomalies against a configured baseline
- Count Based: Triggers when matching log records cross a threshold
- New Data Detection: Notifies when new matching entries appear within a configured time window.
- Check Frequency: Select how often the query should be evaluated.
- Threshold Configuration: Configure the conditions under which alerts should be sent.
- Alert Settings: Select the User Alert Groups, On-Call Schedule, and Notification Profile.
- Third-Party Integrations: Select the services that should receive alert notifications.
Use the View Alerts tab to review all configured alert templates, check when each was last triggered, when it was last evaluated, and the latest query value. This makes it easy to validate alert behavior and tune templates over time.
How is Audit Logs licensed?
The first 10 alert templates in Audit Logs are free. Every additional 10 alert templates consume license capacity equivalent to one Basic Monitor. This applies to all pricing plans introduced after 2024.
How long is data retained in Audit Logs?
Audit log retention defines the duration for which audit records are stored. This helps you access historical activity for auditing, compliance, troubleshooting, and security investigations while preventing unnecessary storage consumption. Site24x7 retains audit log data for 13 months.
How are Audit Logs widgets added to a dashboard?
You can add Audit Log data directly to a custom dashboard for at-a-glance visibility. To do this, first save the query you want to visualize, then follow the steps below:
- Navigate to Home > Dashboard, and open or create a dashboard.
- Click Add Widget. In the left navigation menu, select any AppLogs widget, choose Audit Logs as the log type, select your saved query, and click Add Widget.
Related articles
-
On this page
- What can Audit Logs do?
- Who can access Audit Logs?
- How is Audit Logs accessed?
- How does the Audit Logs page work?
- Query field
- Log Events
- Log details
- What fields can Audit Logs be filtered by?
- What does drilling into a log entry show?
- How are alerts set up based on Audit Logs?
- How is Audit Logs licensed?
- How long is data retained in Audit Logs?
- How are Audit Logs widgets added to a dashboard?