Application Cluster monitor
The Application Cluster monitor checks the availability and response time of service URLs bundled as a cluster. This monitor enables you to track multiple clusters and view a summary of all URLs within a cluster on a single page. You can also import URLs and add them to the monitor.
Use case
An e-commerce platform uses data sharding to manage its large user base and growing transaction volume. In this setup, customer and order data are distributed across multiple independent clusters (shards), with each shard handling a subset of users.
When users interact with the application—such as logging in or checking their order history—they are routed to the specific shard that holds their data. This design supports scalability but introduces the risk of localized outages; if a single shard cluster goes down, the users associated with that shard will face issues like login failures or inaccessible order details. For DevOps and operations teams, monitoring the availability and performance of each shard cluster becomes critical to ensure an uninterrupted user experience.
Site24x7’s Application Cluster monitor offers a robust solution for this scenario. It enables teams to monitor multiple clusters independently, with each cluster supporting up to five endpoint URLs. This allows the platform to group and track key services—like APIs, databases, or application instances—associated with each shard.
By providing real-time insights into availability, response time, and resource usage, the monitor helps identify and isolate outages at the shard level. Granular alerts ensure that teams are notified the moment a specific cluster encounters issues, allowing for targeted remediation. Historical reports and trend analysis further support proactive maintenance and capacity planning. With Site24x7’s Application Cluster monitor, the e-commerce platform gains the visibility and control it needs to maintain a seamless customer experience, even in a complex, distributed architecture.
Key benefits
- Early detection of partial outages: Quickly identify issues in specific shard clusters before they impact a wider user base.
- Faster root cause analysis: Gain shard-level insights to isolate and resolve problems swiftly.
- Increased system resilience: Enhance stability with proactive monitoring and rapid incident response.
- Improved user experience: Ensure consistent access and performance for users by minimizing localized outages.
Adding an Application Cluster monitor
- Log in to Site24x7.
- Click Admin > Inventory > Monitors > Add Monitor.
- Select Application Cluster on the Add Monitor page.

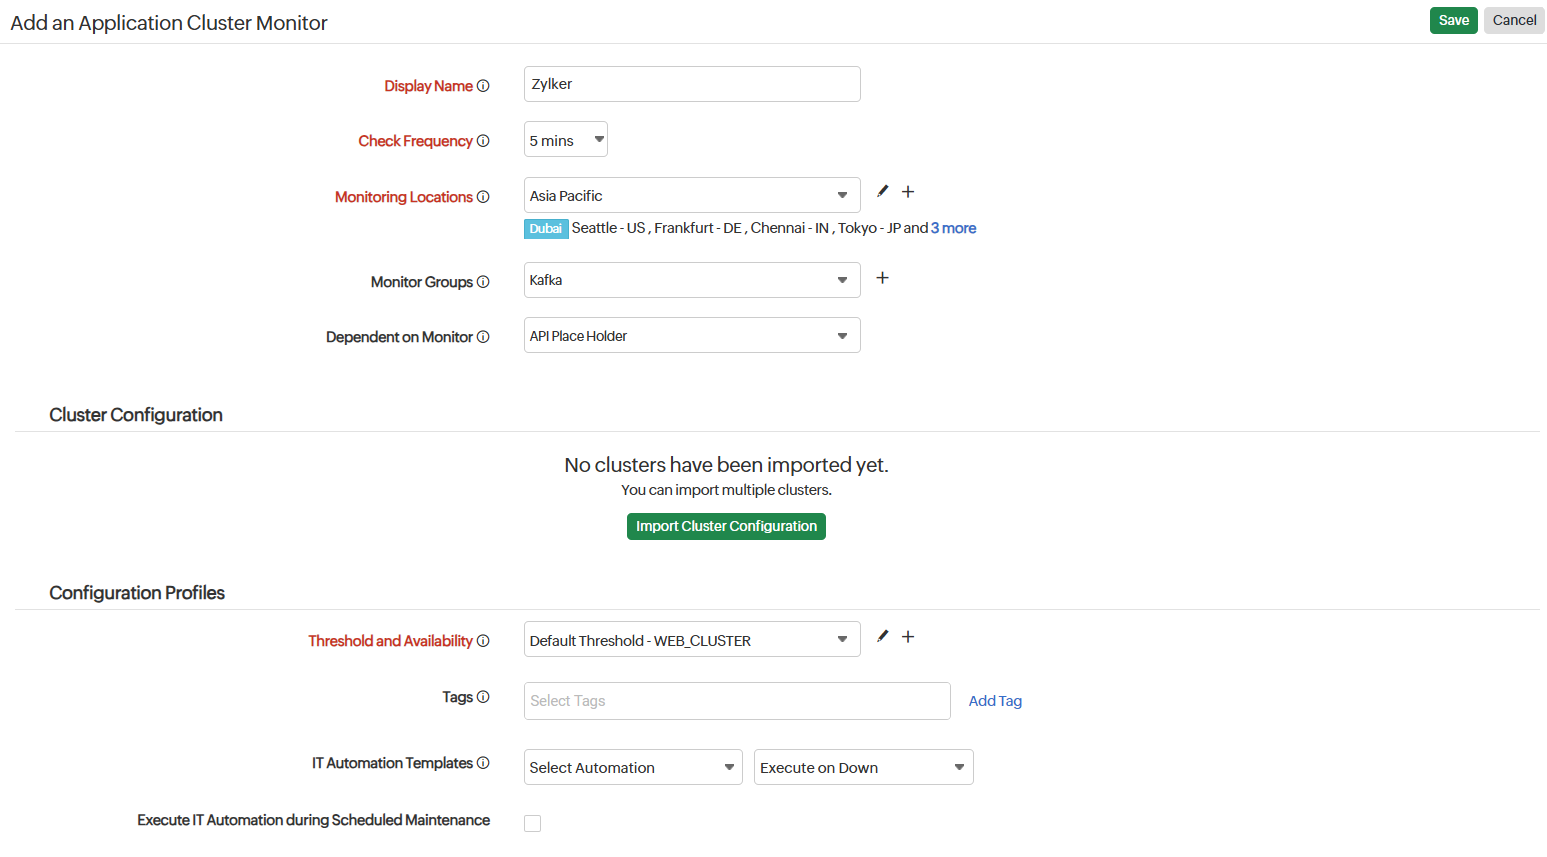
- Provide the basic details of the monitor:
- Display Name: Provide an appropriate name for the monitor.
- Check Frequency: Choose the monitor poll frequency from the drop-down menu. The frequency can be set from one minute to 30 minutes.
-
Monitoring Locations: Select a location profile from the drop-down list from where the Application Cluster should be monitored. You can also add a new location profile and map it with the monitor.
-
Monitor Groups: Associate the Application Cluster with a monitor group. Choose an existing monitor group or create a new one.
-
Dependent on Monitor: Select a dependent monitor from the drop-down. Site24x7 will suppress alerts for the configured monitor if the dependent monitor is already down.
-
Provide the details under Cluster Configuration:
You can import the cluster configuration by clicking the Import Cluster Configuration button. -
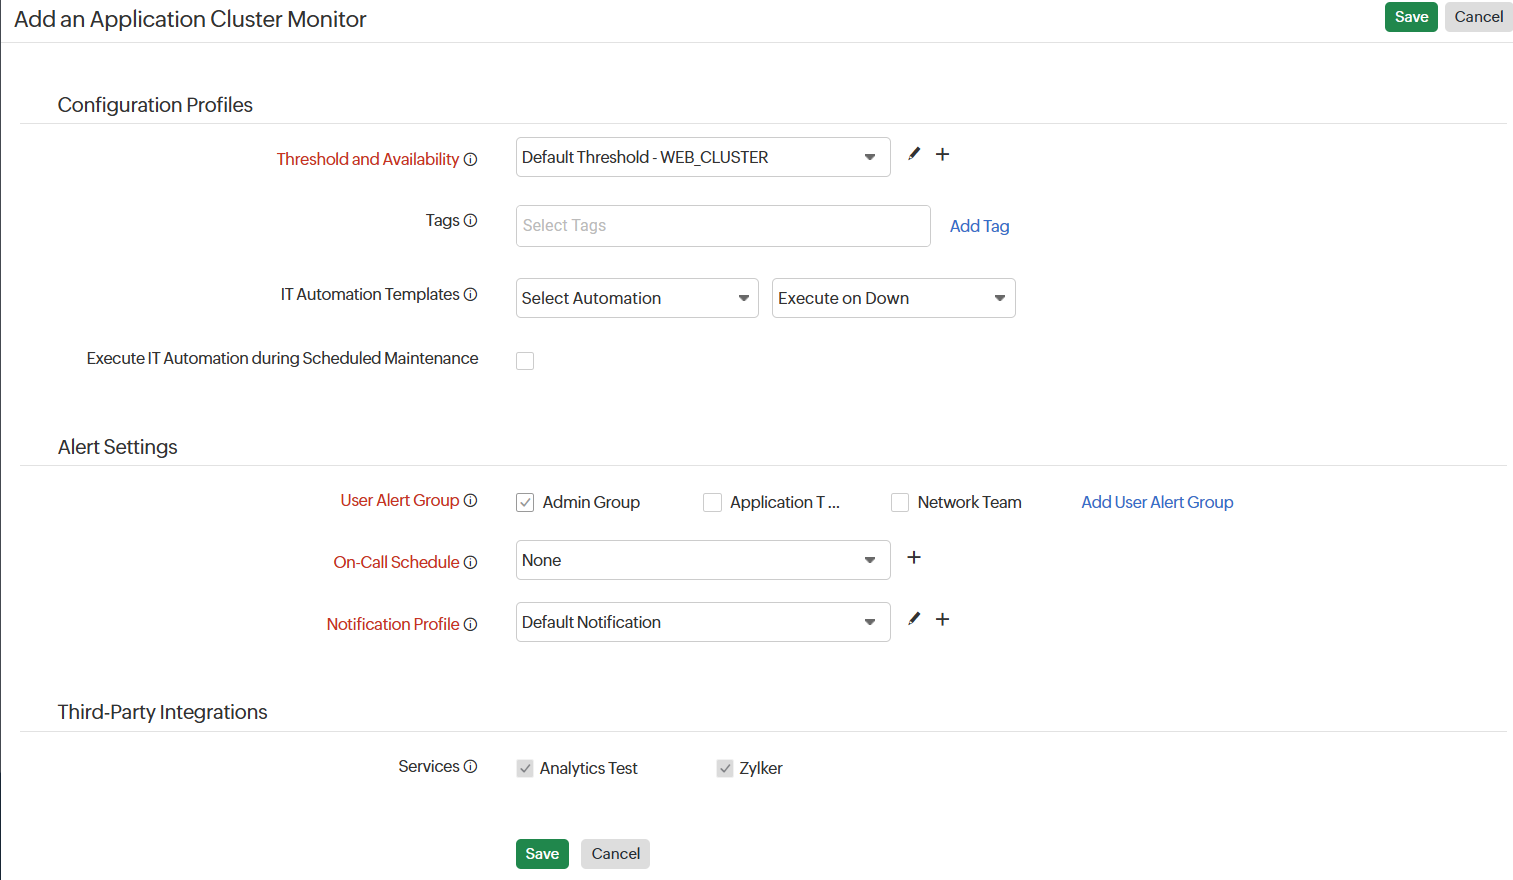
Specify the following details for Configuration Profiles:
- Threshold and Availability: Select a threshold profile from the drop-down list, use the default threshold profile available, or create a new one, and get notified when resources breach the configured threshold.
- Tags: Associate your monitor with a predefined tag or multiple tags to help organize and manage your monitors creatively.
- IT Automation: Select an automation to be executed when there is a change in the state of the Application Cluster monitor. The defined action gets executed when there is a state change and selected user groups are alerted.
- Execute IT Automation during Scheduled Maintenance: Select the check box to enable the option to execute an IT automation—script executions, server commands, and more—during this period.
Configuring a scheduled maintenance window allows you to suppress alerts for selected IT resources during routine maintenance tasks.
Learn more about IT automation.
-
Enter the following details in Alert Settings:
-
User Alert Group: Select the user group that needs to be alerted during an outage, or add multiple users to a group.
-
On-Call Schedule: The On-Call Schedule option helps you ensure that notifications are sent to assignees in specific shift hours, helping them to quickly respond to alerts or incidents. Choose an on-call schedule of your preference from the drop-down.
-
Notification Profile: Configure who gets notified in case of downtime and when. Choose a notification profile from the drop-down list, use the default profile available, or create a custom notification profile.
You can receive alerts if the monitors are associated to user groups irrespective of the on-call shift you've configured.
-
- Third-Party Integration: Set up integrations and associate your monitor with a preconfigured third-party service. This lets you push your monitor alarms to selected services and facilitate improved incident management.

- Click Save to save the Application Cluster monitor.
Import Cluster Configuration
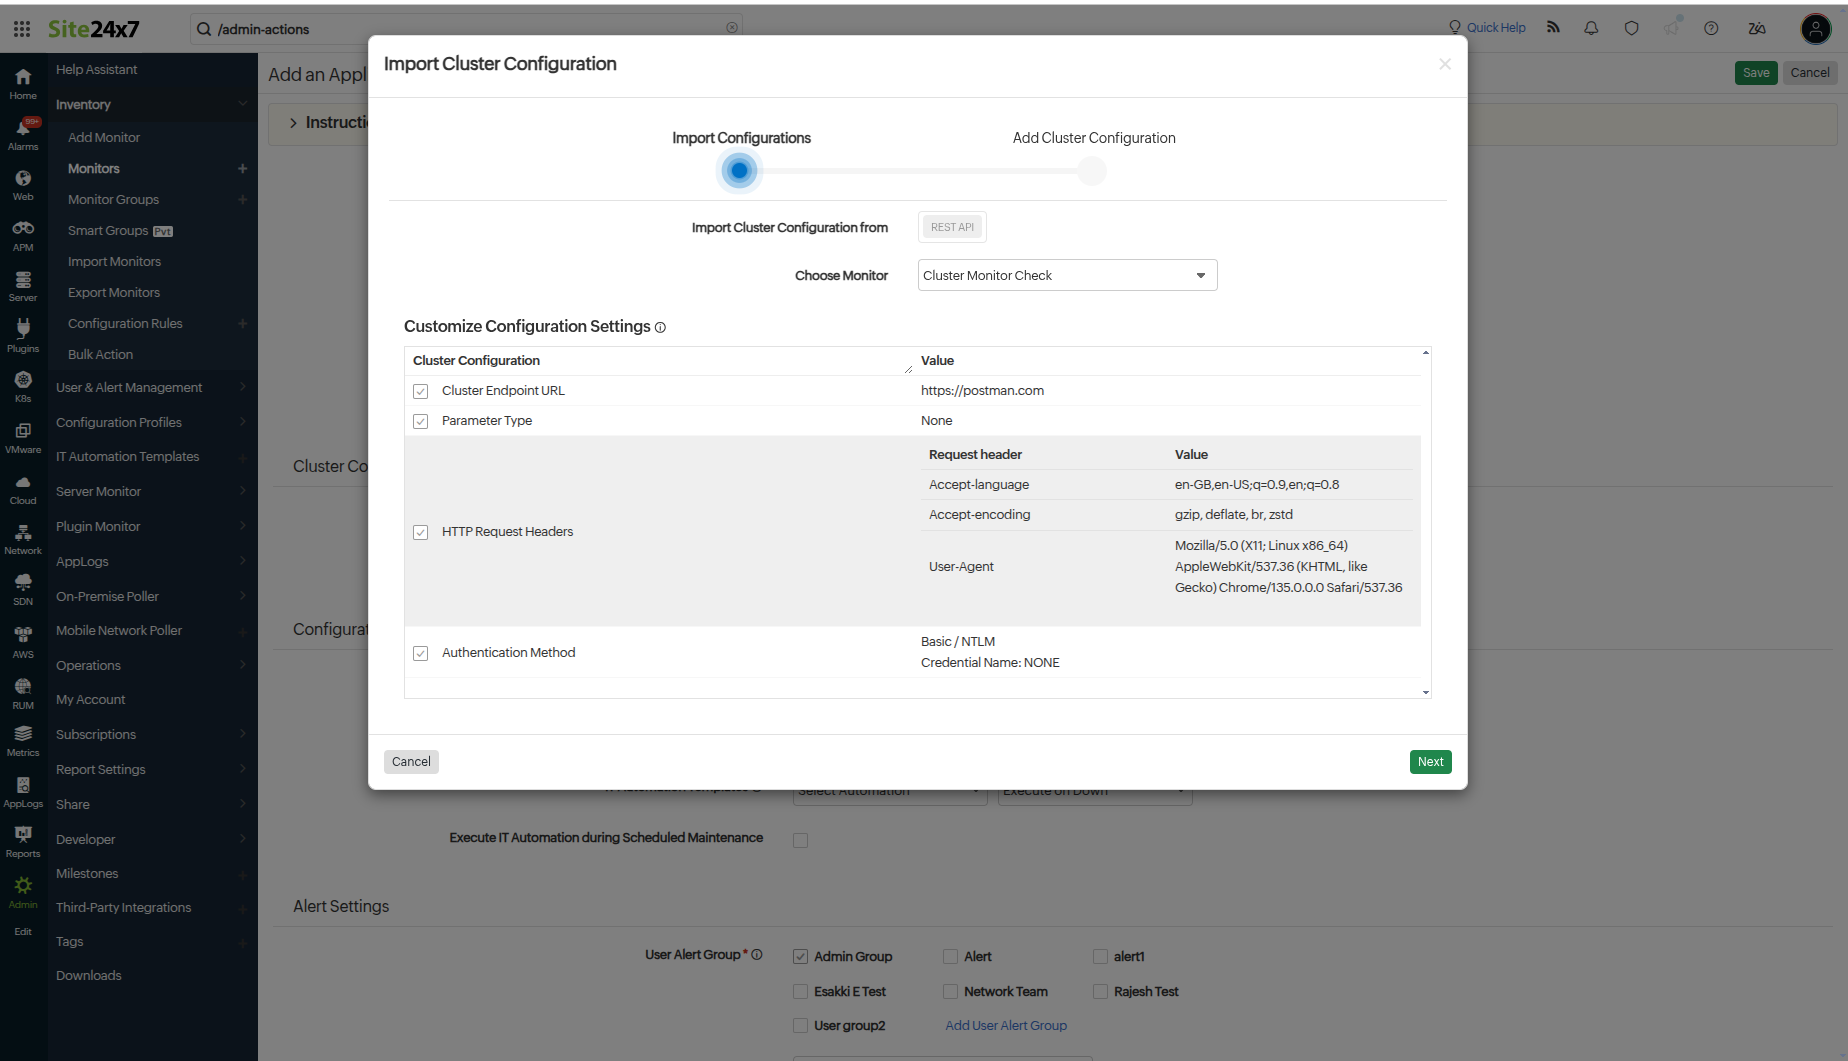
You can import configurations such as Cluster Endpoint URL, Parameter Type, HTTP Request Headers, and Authentication Method from existing REST API monitors to streamline the addition of the cluster configuration.
The main purpose of this import configuration is to transfer configuration settings from an existing monitor, allowing you to modify specific configurations as needed for individual clusters.
Additionally, you can add up to ten clusters within an Application Cluster monitor, customizing their settings to fit your requirements.
Import Configurations
Follow the steps below to import the configuration settings and customize it:

- Import Cluster Configuration from: Select the type of monitor (REST API) for which you want to import the cluster configurations.
- Choose Monitor: Select an existing monitor based on the monitor type from the drop-down list.
- Under Customize Configuration Settings, choose the Cluster Configuration that you want to import. The configuration values will be displayed in the Values section; you can either modify these values in the next section or retain them as-is:
- Cluster Endpoint URL: The endpoint URL that has been selected. The URL can be an HTTP/HTTPS address or a cURL command.
- Parameter Type: The type of parameter used in the selected monitor, which can be either None or GraphQL.
- HTTP Request Headers: The Request header name and header Values of the endpoint URL are listed here.
- Authentication Method: Specifies the authentication method used by the selected monitor.
- Click Next to proceed to the Add Cluster section and specify the below details.
NoteYou must select at least one cluster configuration setting to complete adding the cluster and its configurations.
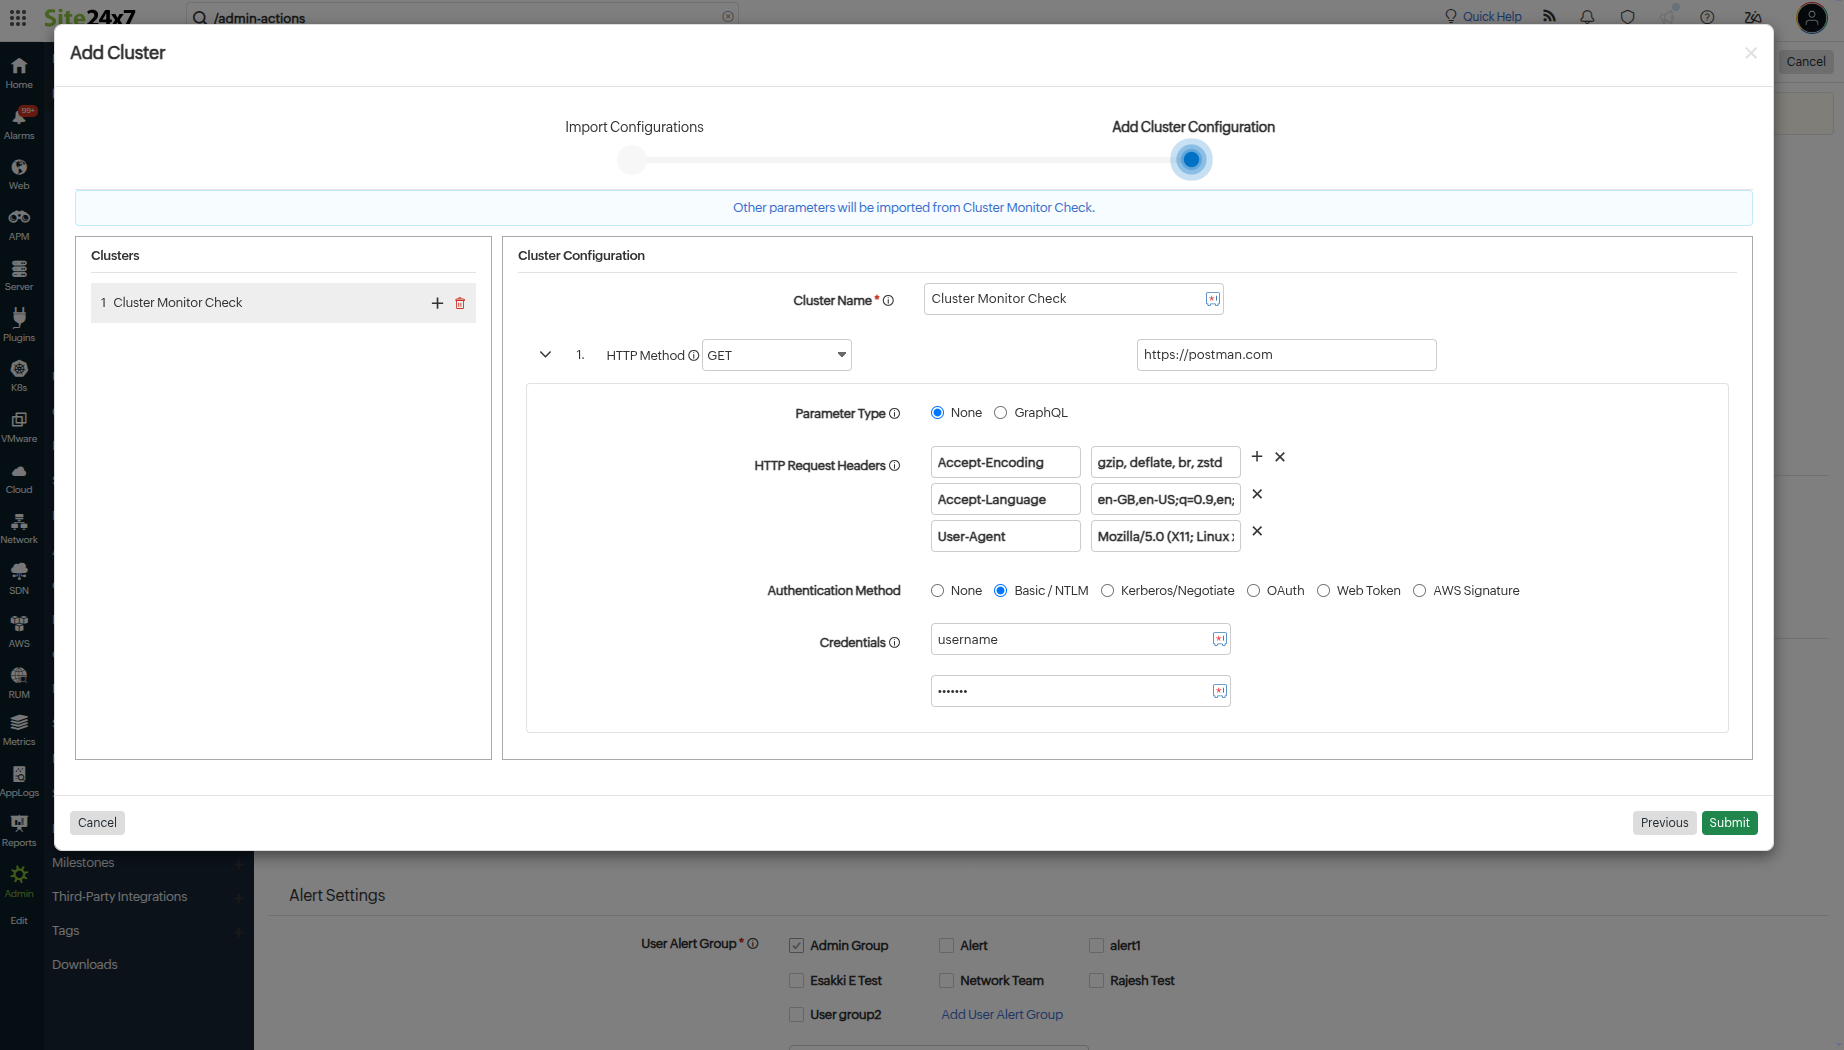
- Add Cluster Configuration:

You can add multiple clusters in the Add Cluster section. All the clusters will contain the selected configurations of the previous page. You can retain the configurations or modify them.
A default cluster will be added automatically based on the selected monitor type and monitor. This section contains two tabular views:
The left section, Clusters:
-
Displays a list of clusters by name. You can add a new cluster by clicking the + icon. A maximum of ten clusters can be added.
-
To edit a cluster name, select the desired cluster and update its name directly.
-
To delete a cluster, click the delete [delete] icon.
The right section, Cluster Configuration:
-
Shows the corresponding cluster configurations of the selected cluster in the left section.
NoteYou can add up to ten endpoint URLs in a single cluster.
-
- Cluster Configuration:
-
Cluster Name: The name for identifying the cluster.
-
HTTP Method: Specify the method to be used for connecting with the site (POST, GET, PUT, DELETE, HEAD, or PATCH). Select the appropriate option from the drop-down to configure your form submission method. Also, select the appropriate body type for POST, PUT, PATCH HTTP, and PROPFIND methods.
Monitoring WebDav URLs
Web Distributed Authoring and Versioning, or WebDAV, is a protocol that allows users to edit, share, copy, or move documents through an HTTP web server.
The following primary HTTP methods that are used by WebDAV are currently supported in Site24x7:- PROPFIND
- PROPPATCH
- MKCOL
- COPY
- MOVE
- LOCK
- UNLOCK
By using these methods, you can now perform:
Calendar URL monitoring
Calendaring extension to WebDAV (or CalDAV) is an extension of WebDAV that allows users to access or manage calendar-related information on a remote server. It uses the iCalendar format. Using CalDAV, you can synchronize data across devices, retrieve calendar events, schedule new events, set reminders, and more.
Examples: Google Calendar and Apple Calendar provide CalDAV access to their services.Contact URL monitoring
vCard extension to WebDAV (or CardDav) is an address book client or server protocol that allows users to access or share data on a web server. It uses the vCard format for the data. CardDAV helps to retrieve, store, and manage personal contact-related information over a remote server.
Examples: Google Contacts and Apple's iCloud Contacts use CardDAV.NoteYou can also create a custom method by clicking Custom from the drop-down list.The POST method submits the parameters to access the URL. The POST submission method supports request sending in FORM, Text, XML, or JSON formats.
In the GET method, the entire HTML response is fetched and checked for the presence of your configured keywords.
-
- If you have selected the fields Cluster Endpoint URL, Parameter Type, HTTP Request Headers, and Authentication Method, ensure you provide the required details for each selected field.
NoteLearn more about the HTTP configuration fields in the REST API monitor.
- Click on the Submit button to save your cluster configurations.
NoteWhen you edit this cluster monitor, all settings of the imported REST API monitor will be displayed.
Learn more about the performance of the Application Cluster monitor.
