The fragile web: 2025's lessons on uptime, reality, and engineering rigor

If you are into IT operations or leadership, you likely spent at least one weekend in 2025 huddled over a laptop while the rest of the world slept. For the last decade, our industry has pursued five nines (99.999% uptime) as the holy grail. We architected redundant systems, deployed across multiple availability zones, and optimized our code u...
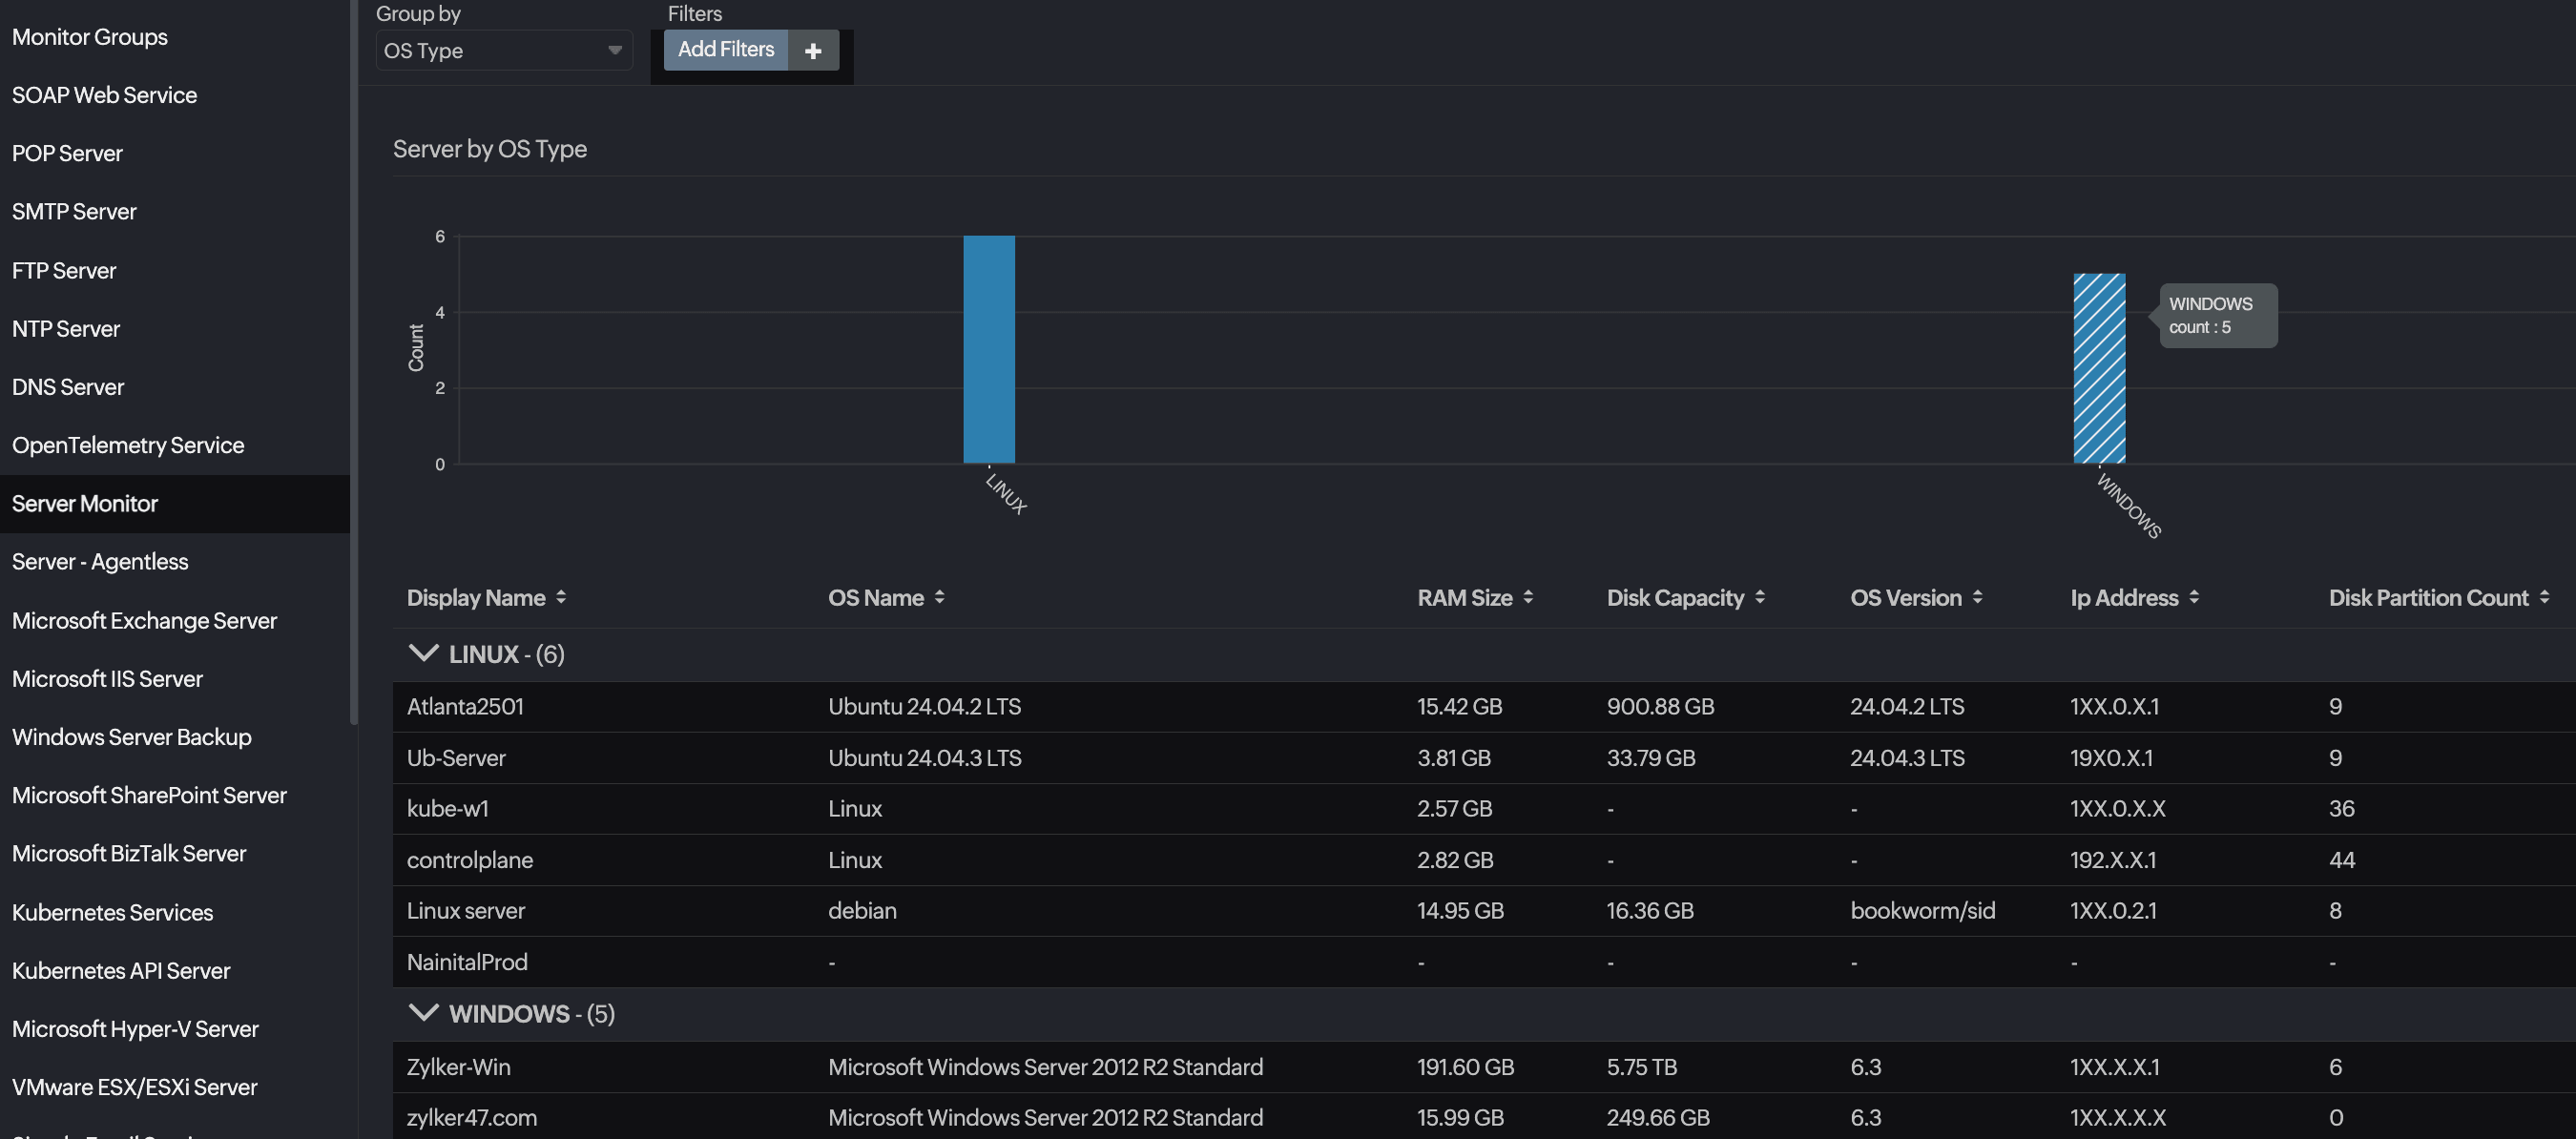
How to prevent outdated server inventory risks with efficient server monitoring
Top server monitoring tools for 2026: A comprehensive comparison guide
Site24x7 wrapped 2025: A year of growing together

Why DPDP compliance must include network configuration governance

India’s Digital Personal Data Protection (DPDP) Act places accountability on how organizations collect, process, and store personal data to help organizations stay steps ahead of threat actors. Forrester’s CIO roadmap highlights a clear shift: compliance is no longer limited to policies and consent workflows. CIOs must extend governance deepe...
Empowering IT teams: Site24x7's mobile app updates in 2025
Powering modern IT with a smarter observability platform
Since its inception, the Site24x7 platform has been the central pillar of monitoring. In 2025, it evolved beyond monitoring to become a comprehensive decision-making layer for modern IT operations. With a strong focus on usability, intelligence, governance, and scalability, this year’s enhancements were designed to help teams see clearly, act...
Digital Risk Analyzer 2025: Digital security fortified
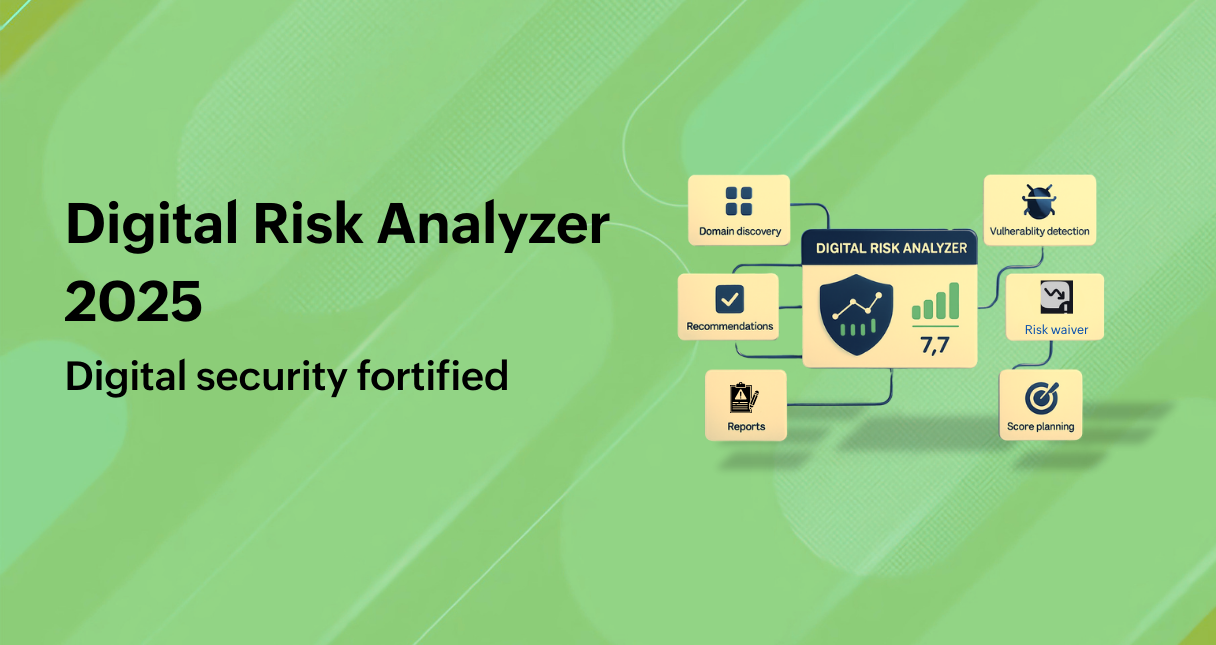
With enhanced scalability, deeper visibility, and actionable security intelligence, Digital Risk Analyzer continues to evolve to help teams identify, prioritize, manage, and mitigate digital risks more effectively. This solution now extends its digital risk management capabilities to MSP environments.
Large-scale asset coverage is simpl...
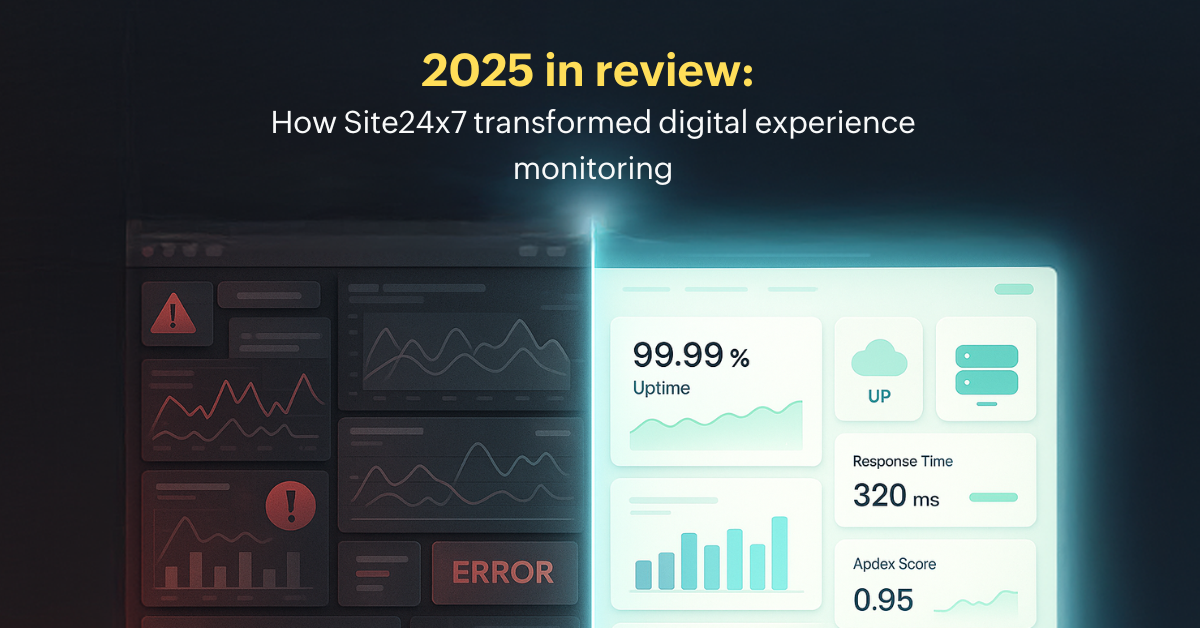
Faster resolution, better outcomes: Site24x7's digital experience monitoring innovation recap
Why OTT platforms crash and what it teaches us about traffic surges
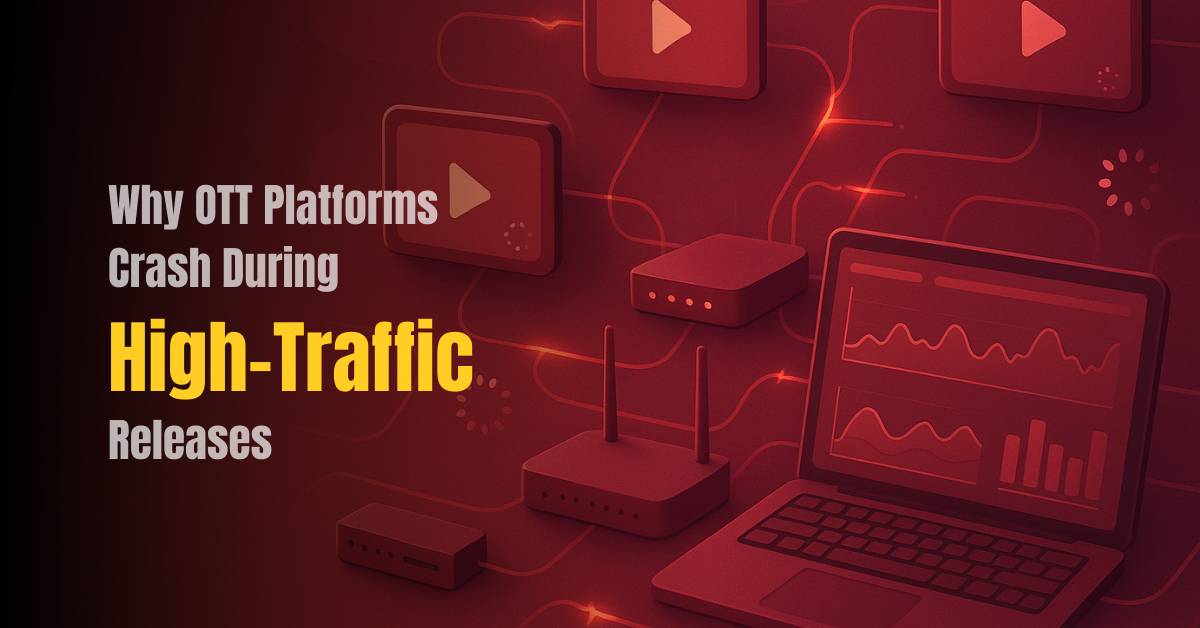
Minutes after the newest episodes of a beloved series dropped, a well-known streaming OTT (over-the-top) platform crashed. The impact was instant: streams wouldn’t load, logins failed, and users across regions started refreshing their screens, wondering if the issue was on their end. Outages like this don’t often happen, especially for an eng...