VMware VeloCloud SD-WAN Topology Map
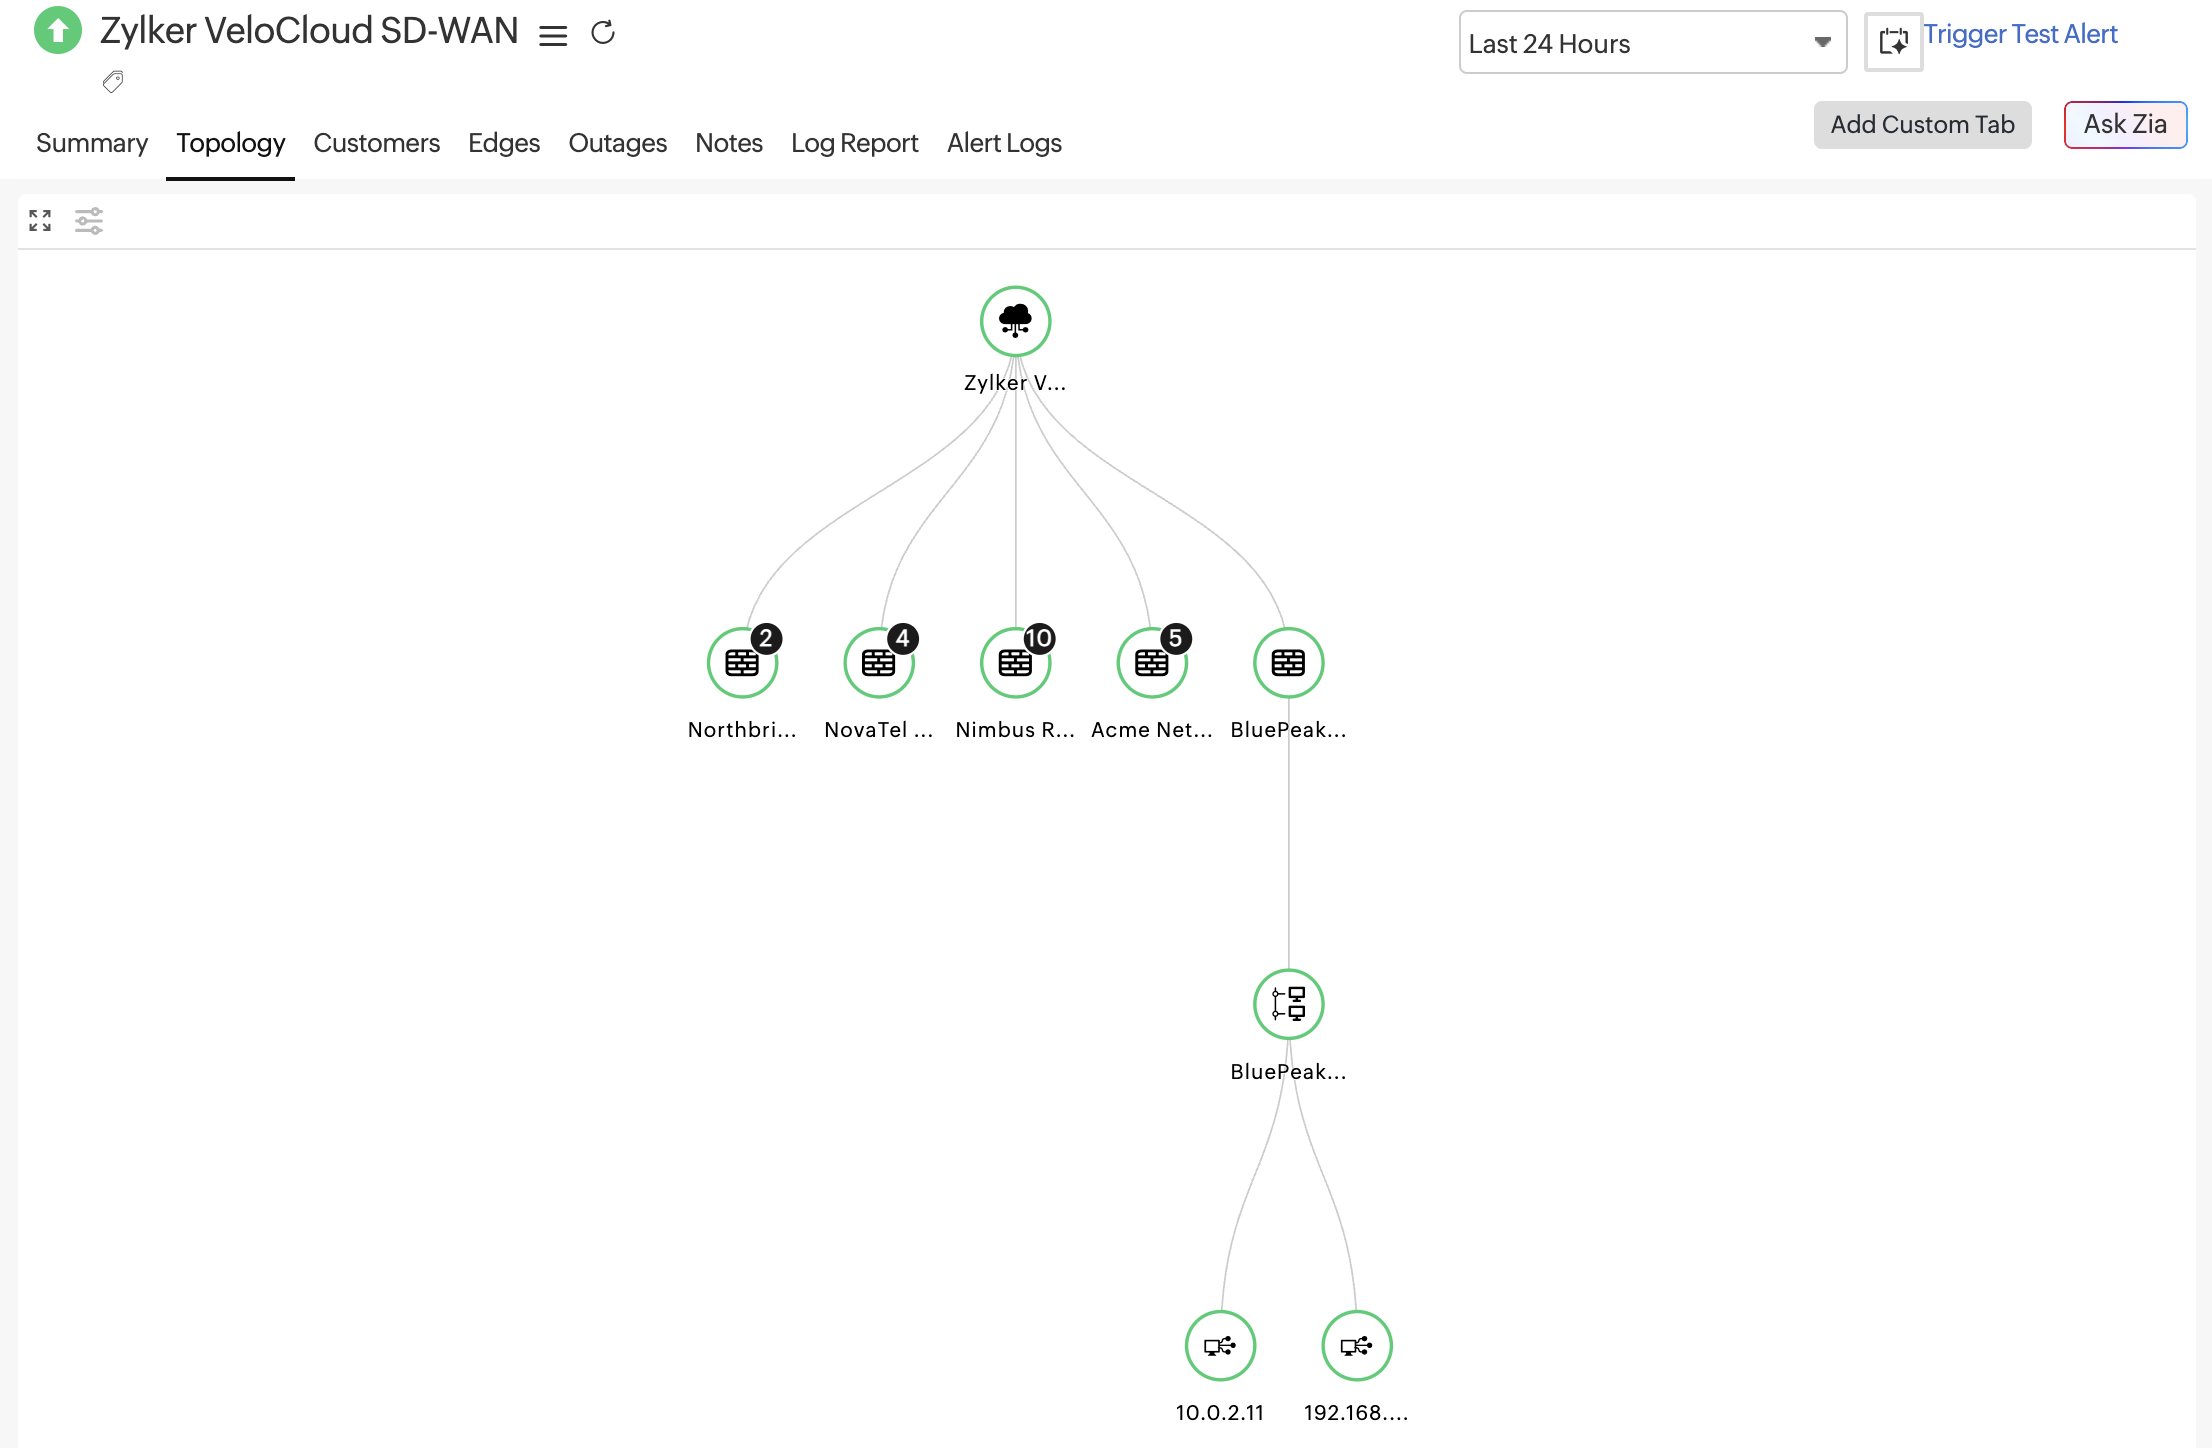
The VMware VeloCloud SD-WAN Topology Map provides a real-time, visual representation of your SD-WAN fabric. It illustrates how VMware VeloCloud Gateways , Edges , Customers , and Links are interconnected, enabling you to quickly understand site-to-site connectivity, overlay paths, and overall network health.
Use cases
The topology map helps you:
- Troubleshoot outages: Instantly see which devices are down and how they impact downstream sites.
- Validate SD-WAN design: Ensure hubs, branches, and customer groupings reflect your intended architecture.
- Isolate problem areas: Identify whether issues originate at the gateway, hub, or edge level.
- Monitor growth: Track how new branches and customers are added to the SD-WAN fabric over time.
Viewing the topology map
To view the topology map:
- Log in to your Site24x7 account .
- Navigate to SDN > VeloCloud > VeloCloud SD-WAN from the left pane.
- Click the required device and navigate to the Topology tab.
Note
The topology automatically refreshes to reflect the latest device states.
Interacting with the topology map
You can interact with the topology to explore your SD-WAN fabric:
- Hover over a node or link to view details.
- Zoom in/out to focus on dense areas or view the full topology.
- Pan the map to move across large topologies.
- Expand or collapse branches to reduce clutter and focus on specific sites or customers.
- Try the following views:
- Vertical view: Displays the topology in a top-down hierarchy, making it easier to follow control flow and trace connectivity from core gateways or hubs down to branch Edges and Links.
- Horizontal view: Arranges the topology from left to right, which works well for wide-screen displays and helps analyze lateral relationships between peers, such as branches, customers, or interconnected Edges.
Best practices
- Regularly review the topology to detect unexpected paths or design drift.
- Use it during incidents to identify the blast radius quickly.
- Combine topology insights with tunnel metrics, such as latency, jitter, and packet loss, for a deeper root cause analysis.
- Collapse non-critical branches in large deployments to maintain a focused view.
Troubleshooting tips
If the topology does not load or looks incomplete:
- Ensure API/collector connectivity to the VMware VeloCloud Orchestrator.
- Verify that all relevant edges and gateways are authorized for monitoring.
- Check the selected time range.
- Confirm that devices are actively reporting.