AppLogs Alerts
Site24x7's AppLogs Alerts allow you to set thresholds and send notifications to your predefined user alert groups so you can thwart critical operational issues right when they start.
In this doc, we'll cover:
- Use cases for AppLogs Alerts
- Monitor-level support for AppLogs Log Types
- Configuring alerts
- Alerts based on relative time
- Managing alerts
- Persistent alerts
- AppLogs Alerts Status Widget
- Frequently asked questions
- Can I edit the log type in my alert query?
- What happens when an alert is created for a log type?
- Can I configure multiple alerts for a single log type?
- Can I delete or suspend a log type monitor if it has associated alerts?
- Is there a relationship between log collection error status and log type monitor status?
- What should I do if I have monitor permissions and want to create my first alert for a log type?
Use cases for AppLogs Alerts
- You want to monitor the average response time of a particular URL in your IIS server, and receive alerts if the response time exceeds the configured threshold. In this case, you can use the following query to create an alert:
By configuring the attribute as AVG(timetaken) > 60000 and setting the check frequency to 30 minutes, you'll receive an alert when the average time taken for the particular request exceeds one minute (60000 milliseconds). This condition will be checked every 30 minutes.logtype="IIS Access Logs" and stemuri="/EmpApp/" AVG(timetaken)
- You want to receive an alert when too many response 500 errors occur in your IIS server. In this case, use the following query:
By configuring the attribute as count > 10 and setting the check frequency to five minutes, you'll receive an alert when there are more than 10 500 status code requests within five minutes. This condition will be checked every five minutes.logtype="IIS Access Logs" and statuscode=500
- You want to receive an alert when a distinct source IP has generated too many response 404 errors in your IIS server. Use the following query:
By configuring the attribute as count > 100 and setting the check frequency to 10 minutes, you'll receive an alert when there are more than 100 404 status code requests from any distinct source within 10 minutes. This condition will be checked every 10 minutes.logtype="IIS Access Logs" and statuscode=404 groupby clientip
- You want to receive an alert when too many response 500 errors are thrown from any particular monitor in your IIS server. Use the following query:
By configuring the attribute as count > 10 and setting the check frequency to five minutes, you'll receive an alert when there are more than 10 500 status code requests from the "TEST_SERVER" monitor within five minutes. This condition will be checked every five minutes.logtype="IIS Access Logs" and statuscode=500 and monitor_name = "TEST_SERVER"
NoteIf you want to receive alerts if the response 500 error from any of the agents installed in your IIS server exceeds the configured threshold, then use the following query:
logtype="IIS Access Logs" and statuscode=500 groupby monitor_name
Monitor-level support for AppLogs Log Types
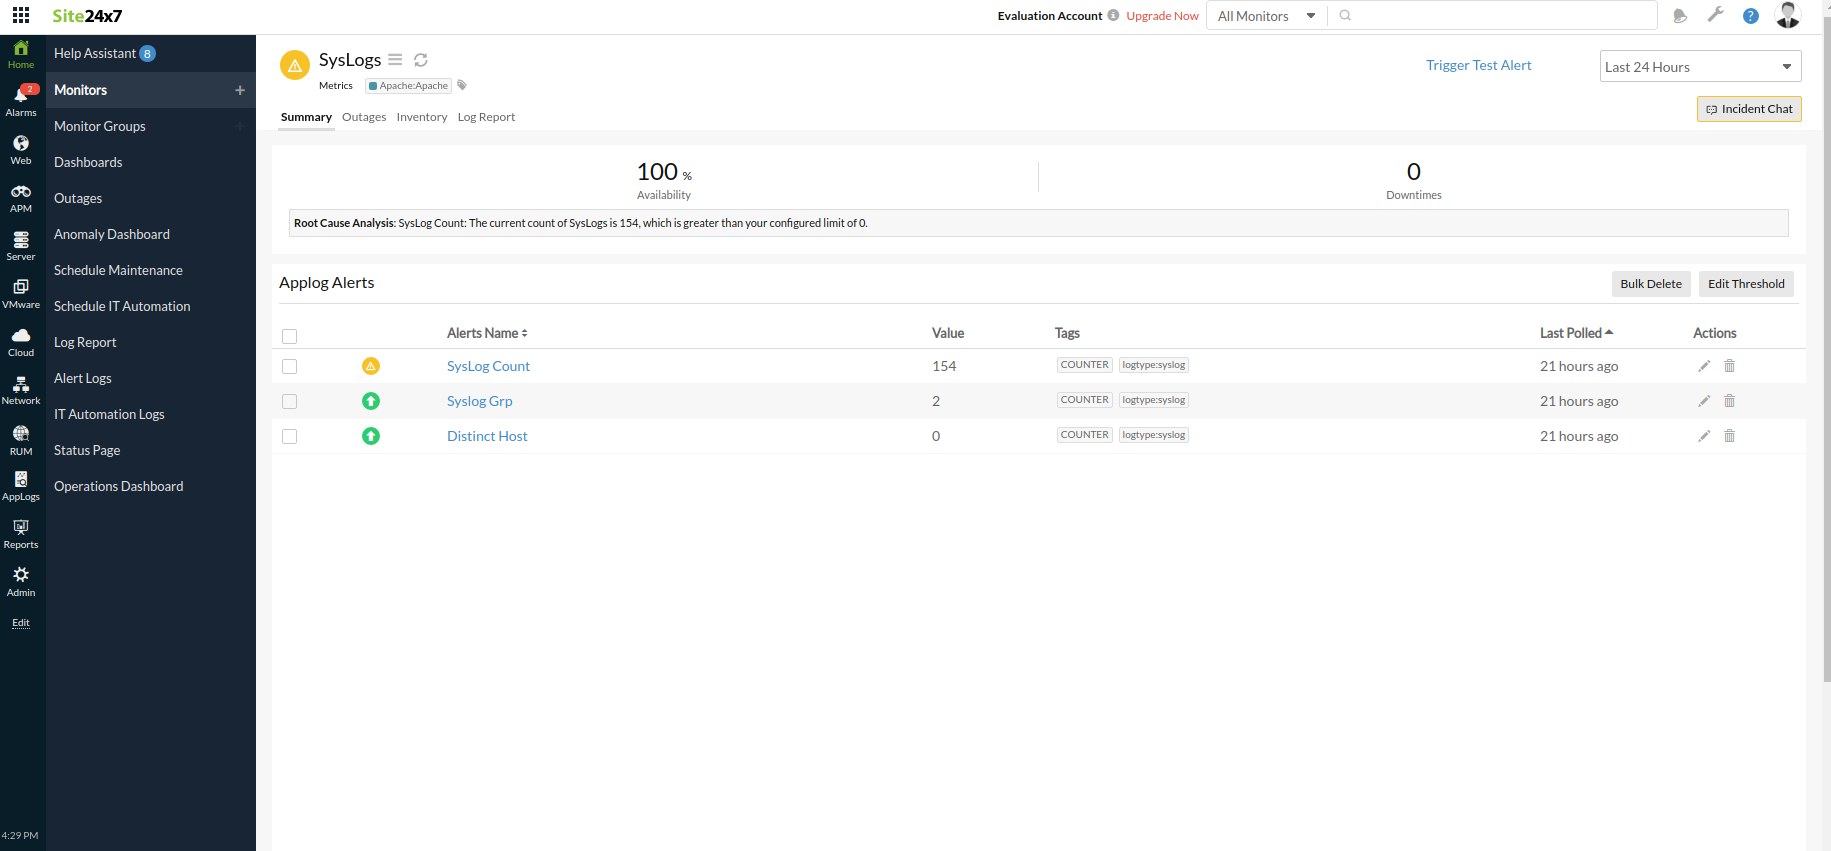
Once you configure an alert for a Log Type in AppLogs, your Log Type will be treated as a monitor.
With your Log Type treated as a monitor, you can:
- View your AppLogs monitors along with other monitors from Home > Monitors page.
- Configure Notification Profiles.
- Receive notifications via third-party ITSM and collaboration tools of your choice.
- Mark your Log Type monitor as in Maintenance mode to stop receiving AppLogs alerts.
- Configure your monitor to change to the Trouble state when any of the AppLogs alerts are generated.
- Edit thresholds and delete all AppLogs alerts for a Log Type in bulk from the AppLogs Monitor Summary page.
Configuring alerts
To configure alerts from the AppLogs Search page:
- Log in to your Site24x7 account and navigate to the AppLogs tab.
- Enter a valid query.
- Click Alerts at the right-most corner of the query field.
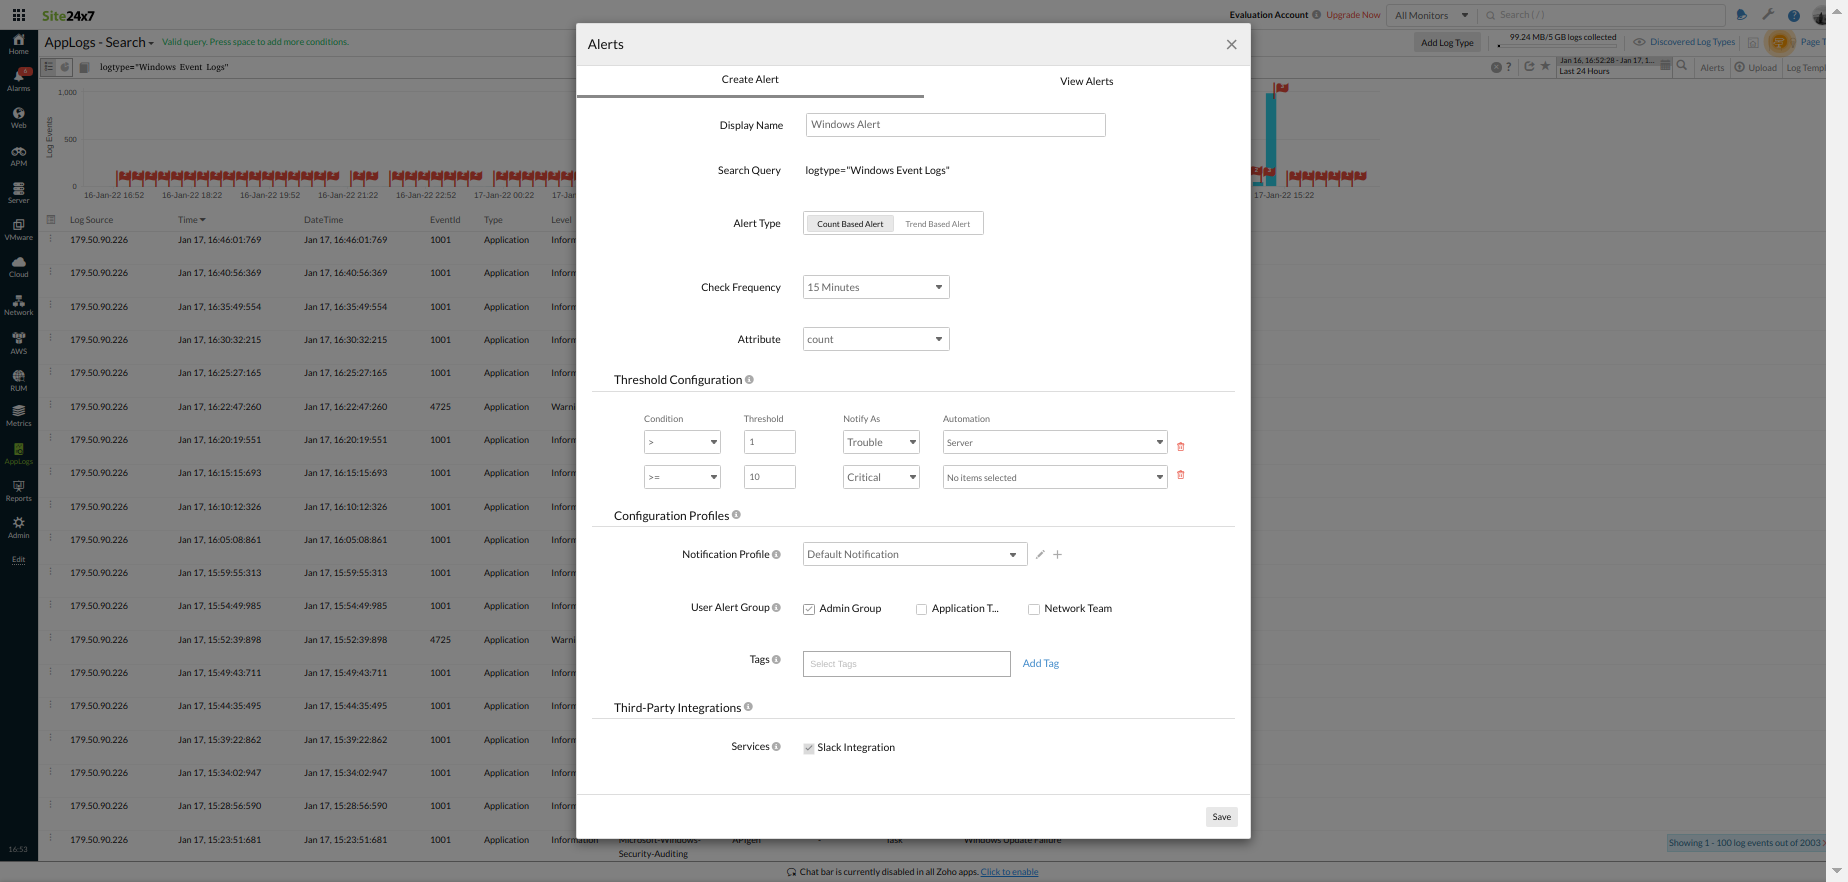
- Enter the following in the Configure Alert pop-up:
- Display Name: Enter a display name to identify the alert.
- Query: Your query will be displayed here (refer step 2).
- Alert type: Toggle between the following and set the conditions.
- Trend Based Alert: The alert will be based on the trend learned over a period of the configured days using the Exponentially Weighted Moving Average (EWMA) algorithm. For this your should also configure the Trend Observation in days. This is simply the period of observation to learn the trend of your log collection, after which you'll start to receive alerts.
- Count Based Alert: Count is simply your number of log lines, beyond which you'll receive alerts.
- New Data Detection: Newly detected data alerts provide timely notifications about data that has not appeared within a specified timeframe, offering better visibility into your log activity.
- Detection Frequency: When New Data Detection is selected, the Detection Frequency field appears, allowing you to set the frequency in hours. This frequency determines how often Site24x7 will check for newly detected data and trigger alerts for data that hasn't been observed within the specified timeframe. Additionally, this value sets the maximum limit for the Check Frequency field described later in the document. For instance, if the Detection Frequency is set to 24 hours, the Check Frequency cannot exceed 24 hours.
Default queries for New Data Detection
The following are some of the preconfigured queries designed to identify newly detected data across various log types. These queries have a detection frequency of three days and a check frequency of one day. These can be customized as needed to suit specific monitoring requirements:
- New URIs with more time taken: This identifies new request URIs with a duration exceeding 1,000ms in IIS access logs.
Query: logtype="IIS Access Logs" and timetaken>1000 groupby stemuri - New 500 error codes for request URIs: This detects new URLs failing because of 500 status codes in IIS access logs.
Query: logtype="IIS Access Logs" and statuscode=500 groupby stemuri - New events in Windows event logs: This captures new event IDs in Windows event logs.
Query: logtype="Windows Event Logs" groupby eventid - New exceptions in Java logs: This tracks new exceptions grouped by Java class names in Java logs.
Query: logtype="Java Logs" and message "exception" groupby classname - New URIs with larger response sizes: This flags new URIs with response sizes exceeding 1MB in Apache access logs.
Query: logtype="Apache Access Logs" and responsesize>1048576 groupby url
- New URIs with more time taken: This identifies new request URIs with a duration exceeding 1,000ms in IIS access logs.
- Detection Frequency: When New Data Detection is selected, the Detection Frequency field appears, allowing you to set the frequency in hours. This frequency determines how often Site24x7 will check for newly detected data and trigger alerts for data that hasn't been observed within the specified timeframe. Additionally, this value sets the maximum limit for the Check Frequency field described later in the document. For instance, if the Detection Frequency is set to 24 hours, the Check Frequency cannot exceed 24 hours.
- Attribute: Choose an attribute from the drop-down list and set a condition (>, <,>=, <=, !=, or=). For trend based alerts, you can set the attribute as either 'increases by' , 'decreases by' , or 'increases or decreases by' . Next, you can set a value as the threshold for that attribute.
Configuring alerts based on relative time
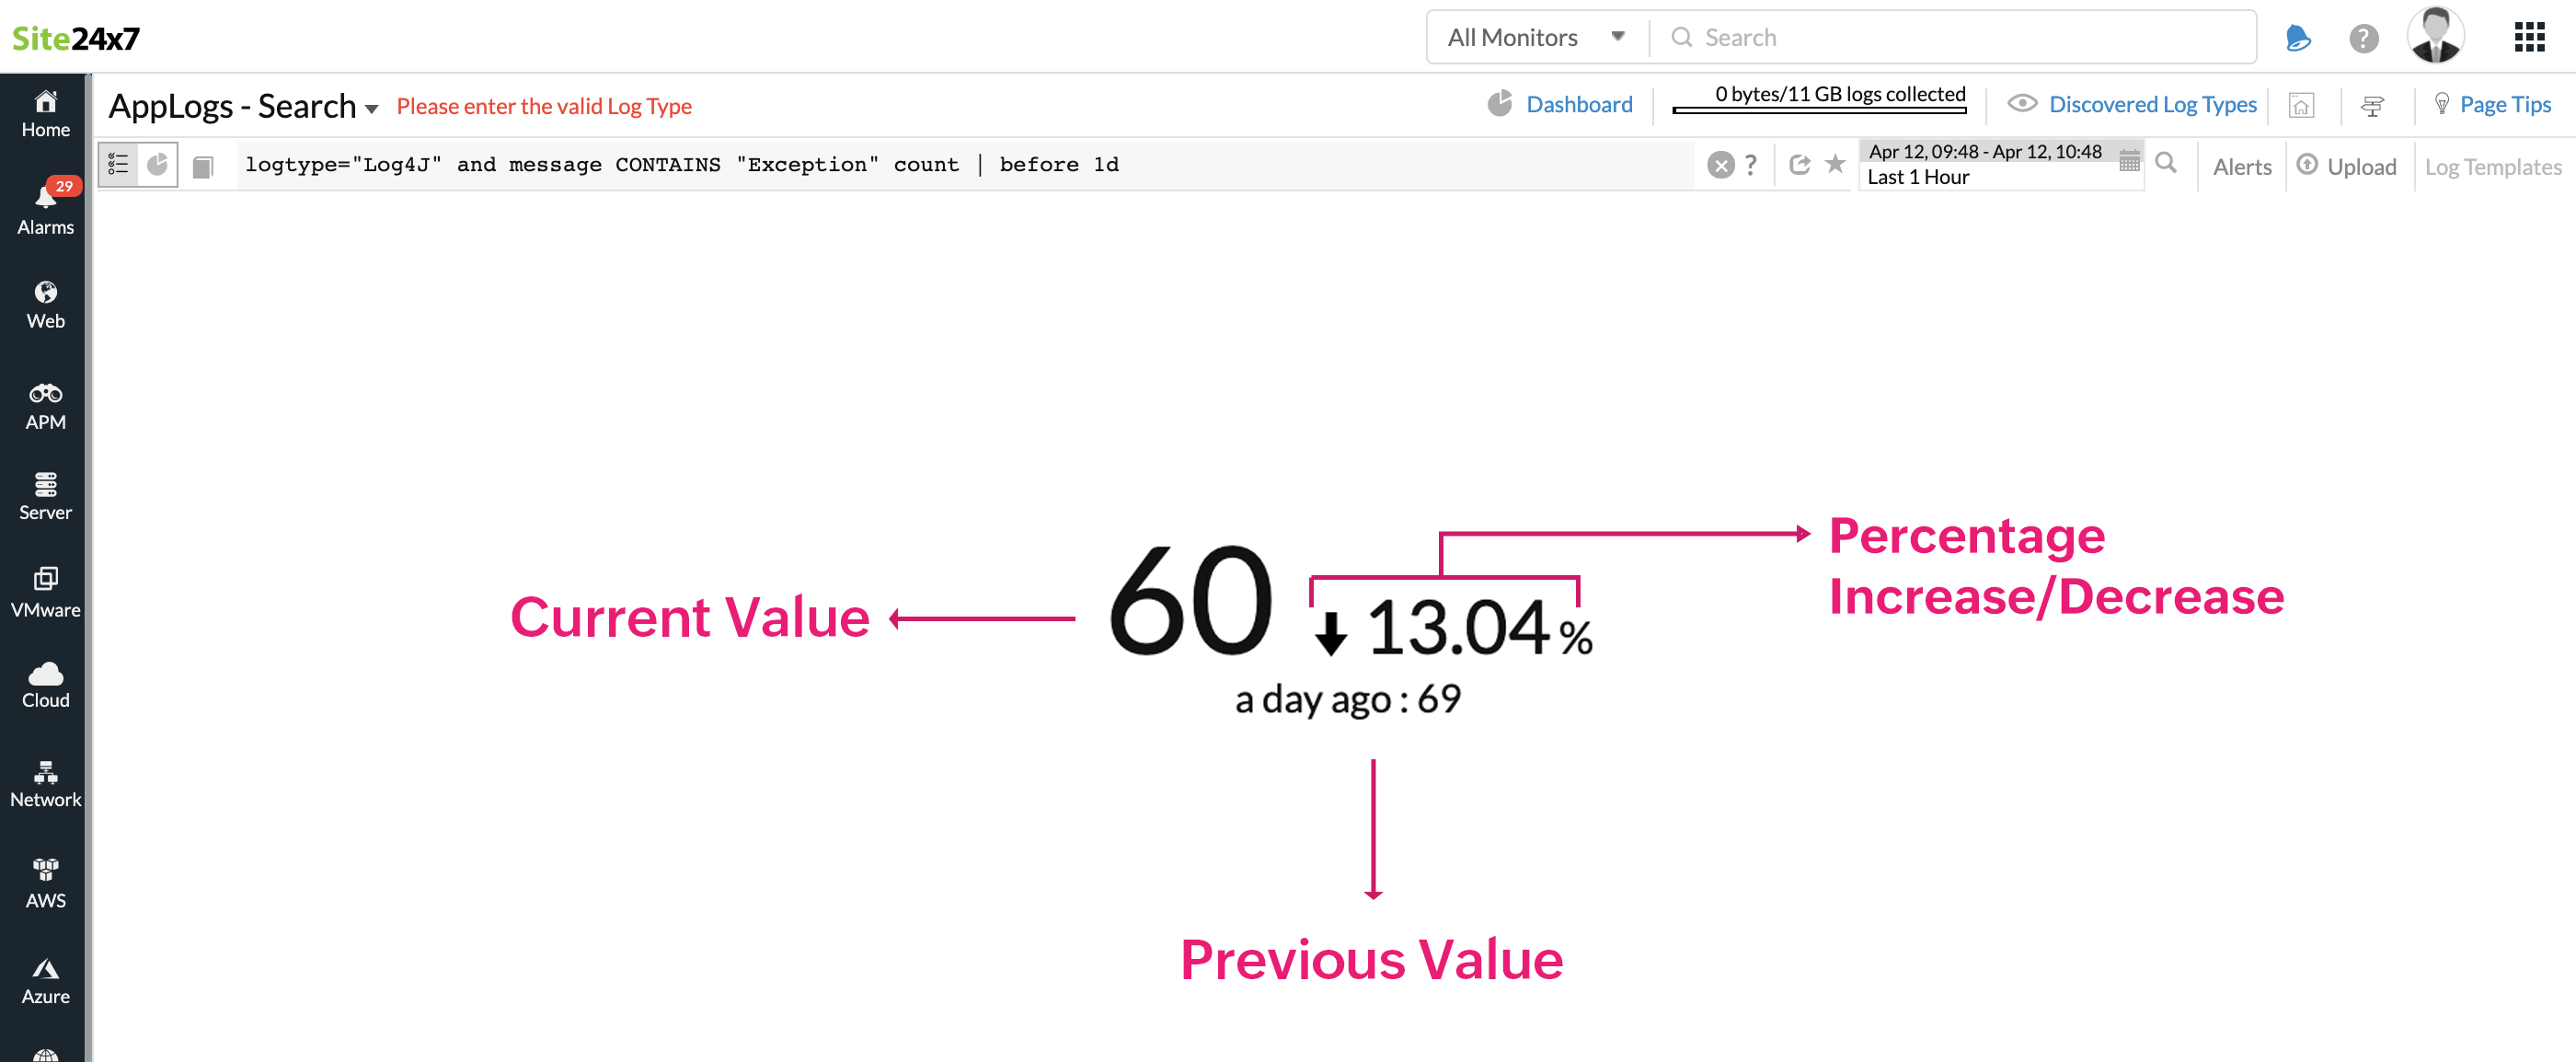
When your query contains "before", you'll be able to compare the results for the same time, before one day, seven days, or the period you provide. In that case, the Attribute will show fields like Difference Value and Difference Percentage in the drop-down menu. Here, you can choose based on which of the two you'd like to receive an alert. Your results will show the current value, previous value (before 'x' time), and the percentage increase or decrease. You can choose to receive alerts based on the difference value or the difference percentage for the threshold you configure. This kind of alert can be helpful to track your key performance indicators and receive alerts when there is a sudden increase or decrease compared to previous period.
For instance, in the below screenshot, we compare the current exception count of the Log4J logs with that of the exception count one day ago, at the particular period of 09:48 - 10:48. The query result displays the current value, previous value, and percentage decrease in the exception count. You can configure alerts based on the query entered and choose to receive alerts based on the difference between the two exception counts or the percentage difference.
 Note
NoteBy default, the "count" attribute will be selected, and you can only configure one attribute per alert. You can also configure alerts for the min, max, or avg of a number field in your logs.
- Check Frequency: Select a Check Frequency, with options ranging from 5 minutes to 5 days, from the drop-down menu.
- Threshold Configuration: Threshold Configuration helps the alarms engine decide the state of a specific AppLogs Alert. Add the conditions and set the value on how you would like to receive an alert.
- Configuration Profiles
- Notification Profile: The Notification Profile helps with configuring who gets notified and when in case of downtime. Choose a Notification Profile from the drop-down list, use the default profile available, or create a custom Notification Profile.
- User Alert Group: Select which group should be alerted about an anomaly. You can also create new user alert groups and associate them with this query.
- Tags: Associate your monitor with a predefined Tag or multiple Tags to help organize and manage your monitors creatively.
- IT Automation Templates: Select an Automation Template to be executed when there is a change in the state of the AppLogs monitor. The defined action gets executed when there is a state change and selected user groups are alerted.
NoteAll the Configuration Profiles settings are applied at the monitor level for the Log Types. Changing any of these settings for one AppLogs Alert in the Log Type will affect all the alerts created under the Log Type.
- Third-Party Integrations: Associate your monitor with a preconfigured third-party service. This lets you push your monitor alarms to selected services and facilitate improved incident management. If you haven't set up any integrations yet, navigate to Admin > Third-Party Integrations to create one.
- Click Save.
You can also set up e-mail, SMS, voice call, and instant messenger alerts for AppLogs Alerts. Learn about the licensing for AppLogs Alerts.
Managing alerts
To manage your configured alerts from the Admin tab:
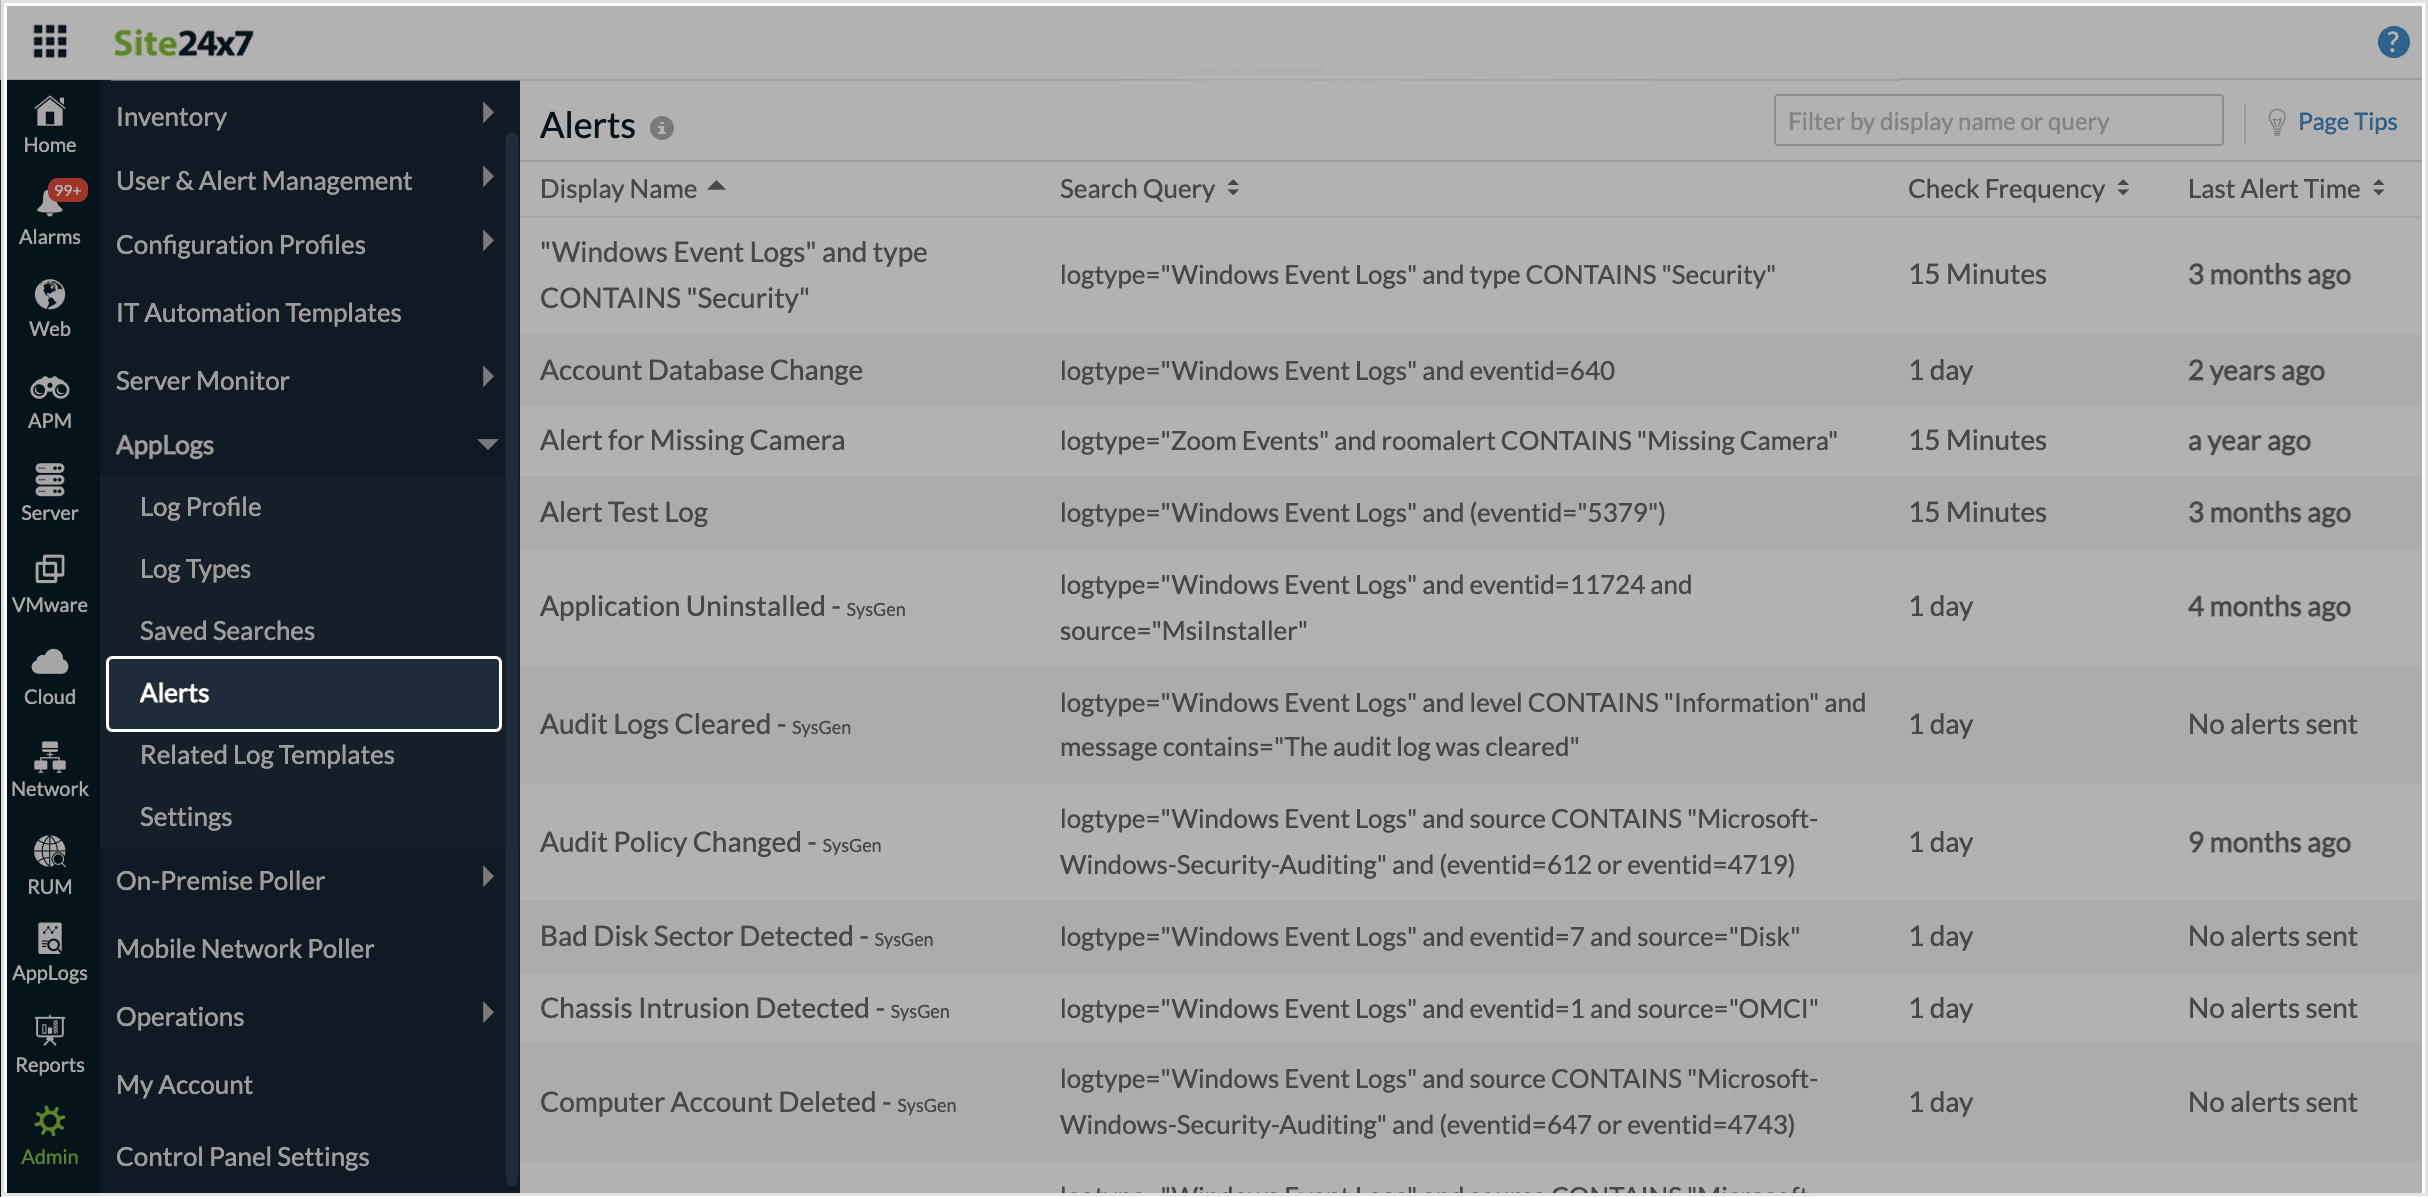
- Go to Admin > AppLogs > Alerts. This page lists all your configured alerts.
- You can edit an alert's configuration by clicking on it.
- To edit an alert's Search Query, click on the
 icon near an alert. You'll be redirected to the AppLogs Search page where you can edit an alert's properties, including the Search Query.
 - You can also delete configured alerts from here.
Bulk actions on the alerts
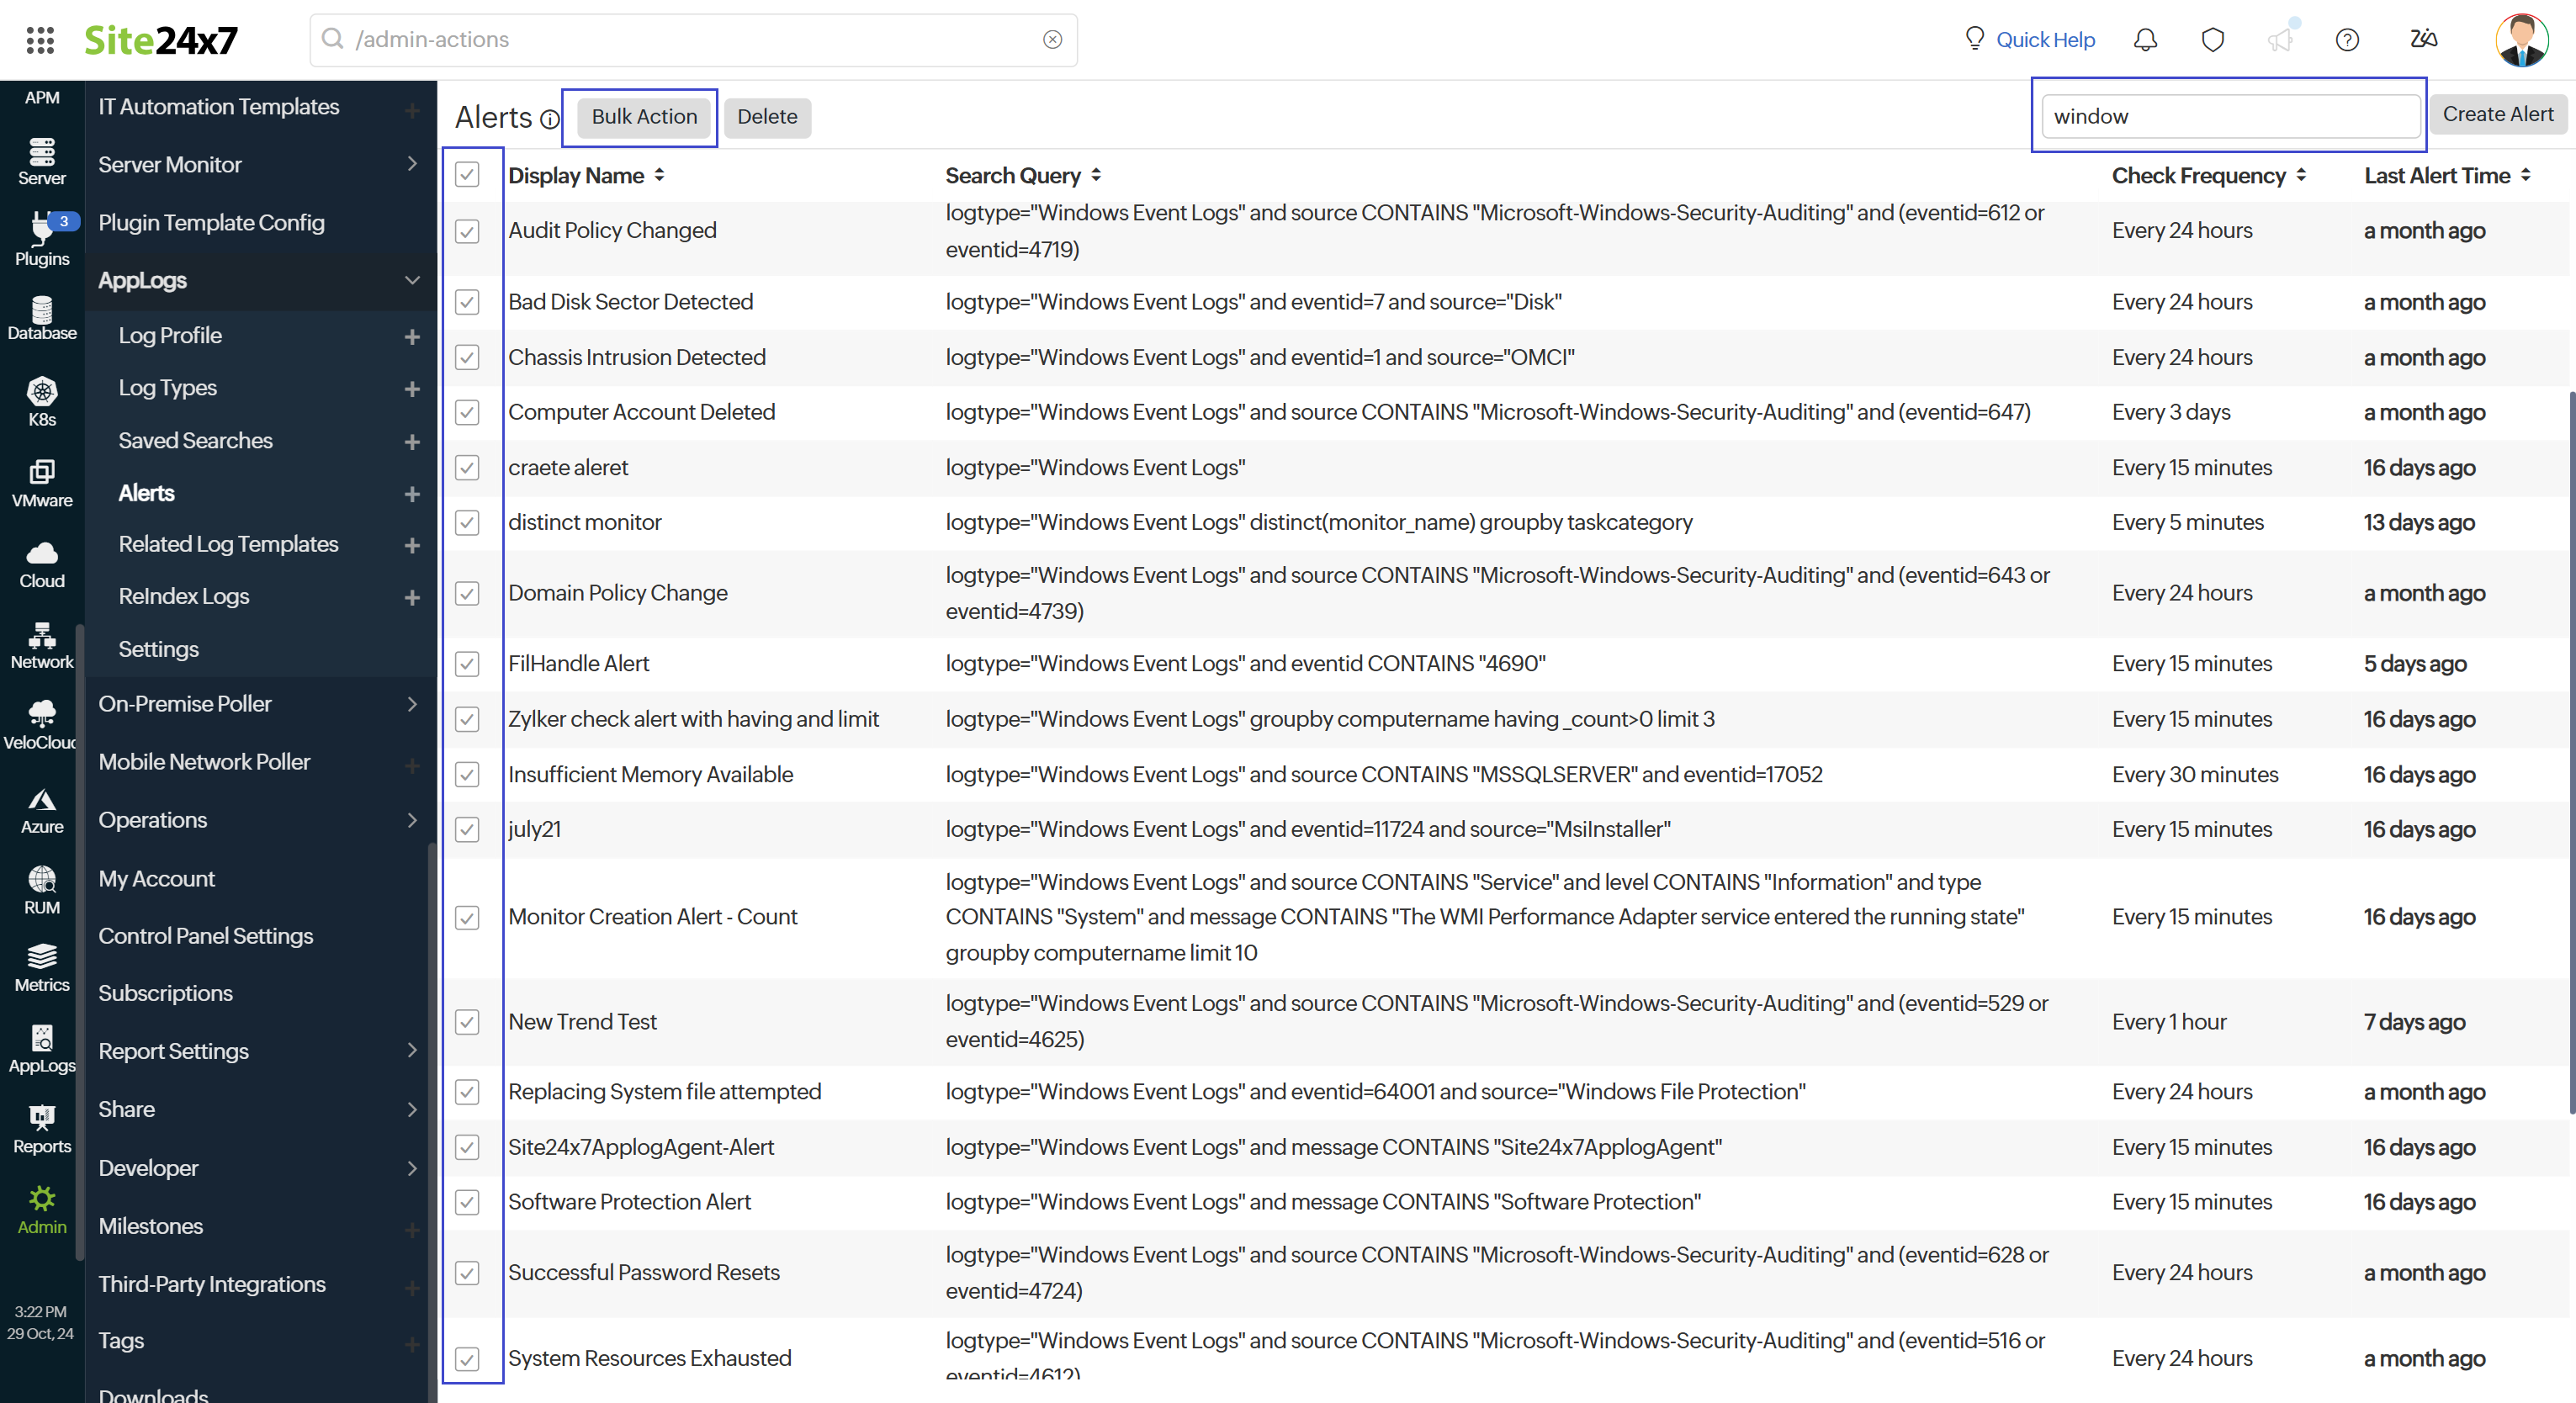
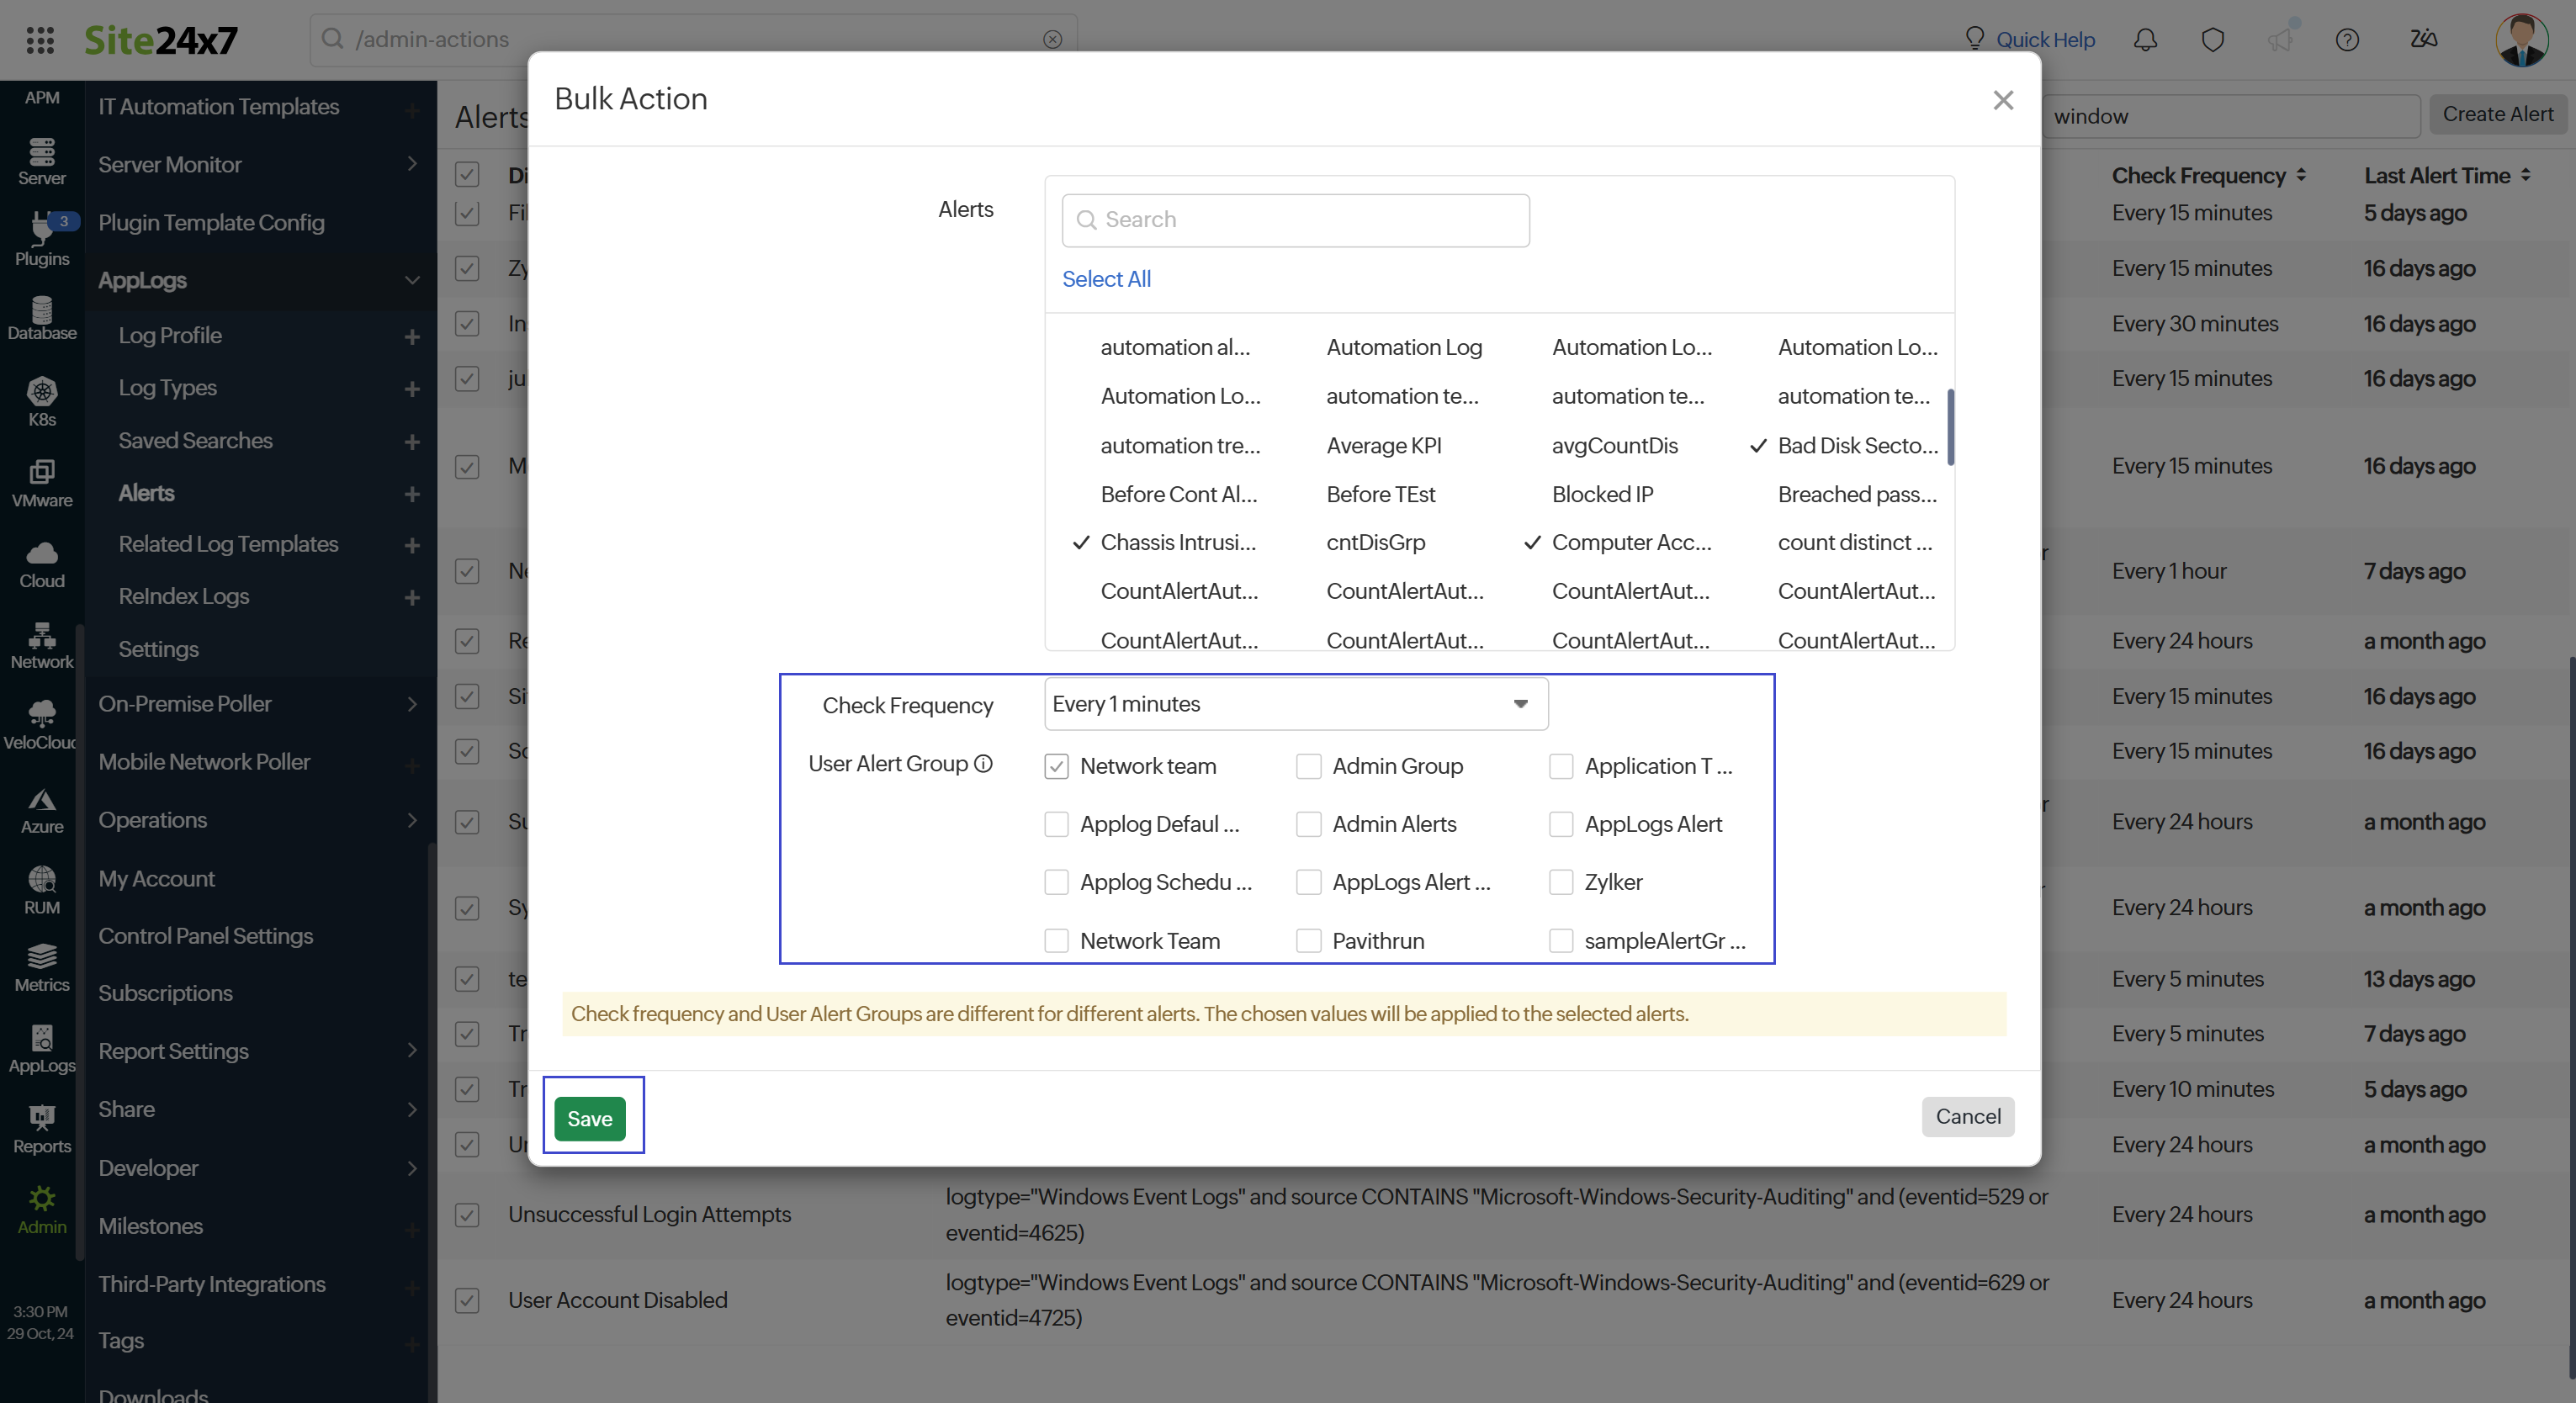
You can update the check frequency and user alert groups for AppLogs alerts in bulk using the Bulk Action button.
To do this:
- Navigate to Admin > AppLogs > Alerts.
- Enter a display name or search query in the search box at the top right corner of the page.
- Select the alerts by clicking the checkbox before the display name, or click the checkbox at the top to select all search results.
- Click Bulk Action to open a pop-up.
- Select the desired Check Frequency to update the selected alerts.
- Select the User Alert Group to update the selected alerts.
- Click Save.
- The chosen values for Check Frequency and User Alert Group will apply only to the selected alerts.
You can also perform bulk deletion of alerts. To do this, repeat steps 1 to 3, then click Delete.
Persistent alerts
Alerts are triggered only when the alert's status changes. For instance, if the alert associated with a monitor encounters an issue at 8:30pm, an alert will be sent indicating the problem. No further alerts will be sent while the alert associated with a monitor remains in that state. The next alert will be triggered when the alert associated with a monitor switches to a different status, such as critical or up.
To ensure continuous notifications, configure persistent alerts in the notification profile associated with the log type monitor. Persistent alerts provide ongoing notifications until you acknowledge the critical or trouble alarm. They operate based on the frequency set in the Notify After Every field.
Use case
Let's look at a use case for persistent alerts.
If you want to get an AppLogs alert whenever an HTTP 500 error happens in your application, here’s how you can do it:
HTTP 500 errors usually indicate serious issues that can affect users and the overall functionality of your site. You can set a count-based or trend-based alert to receive instant notifications.
Here’s an example of setting a count-based alert with a check frequency of every five minutes:
logtype="Application logs" and apiname CONTAINS "my-app" and statuscode="500"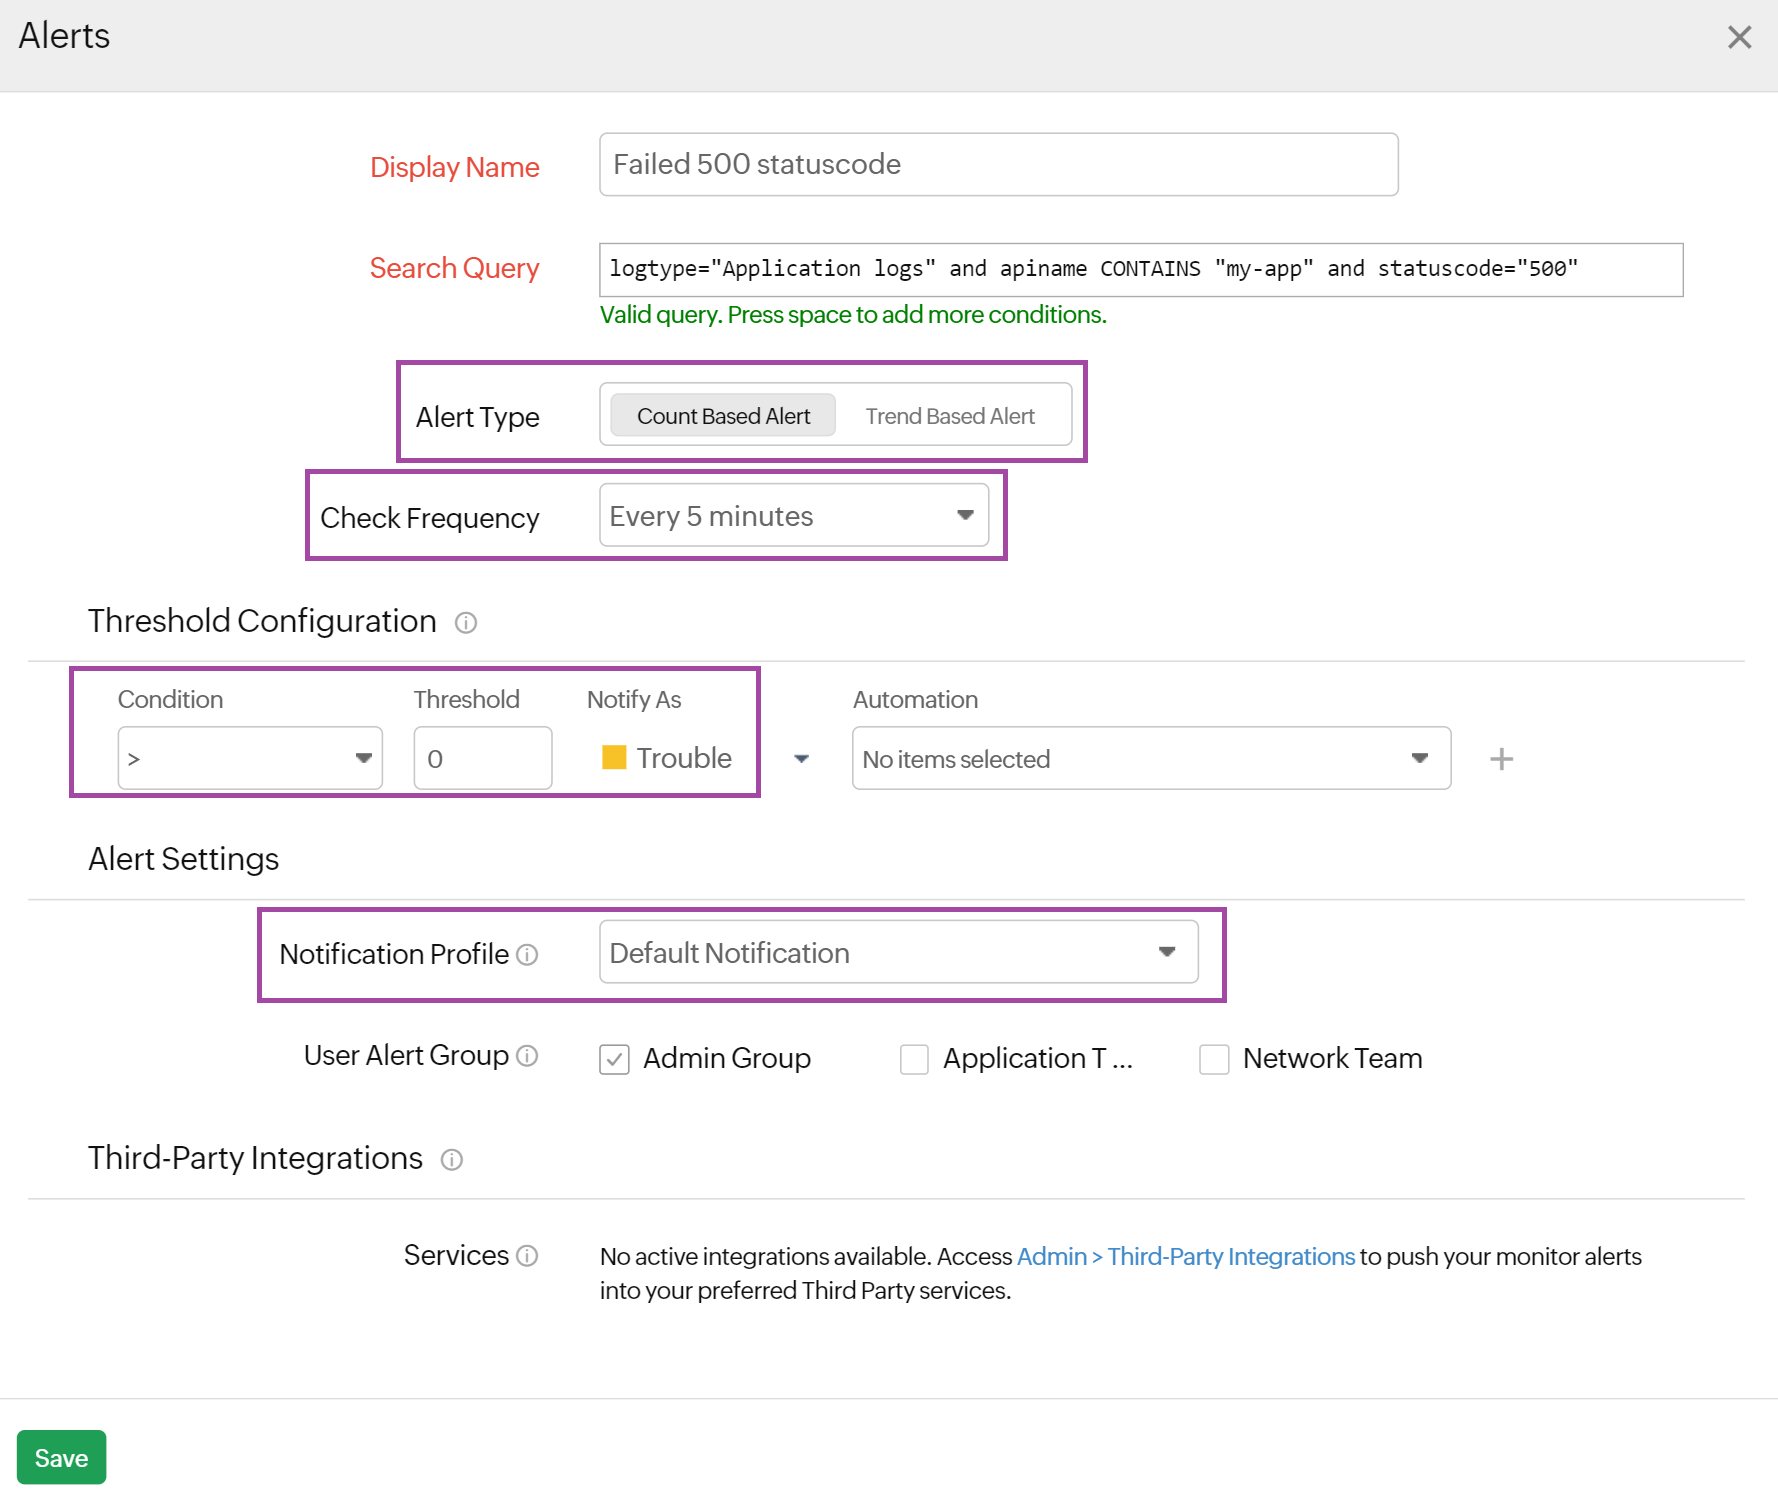
If the query results exceed the set threshold, an alert will be triggered. For instance, if the check frequency is set to five minutes and logs trigger an alert at 9am, you will get an alert.
To get continuous notifications for HTTP 500 errors, regardless of the monitor's status, you can set a persistent alert in the notification profile (via Admin > Configuration Profiles > Notification Profile).
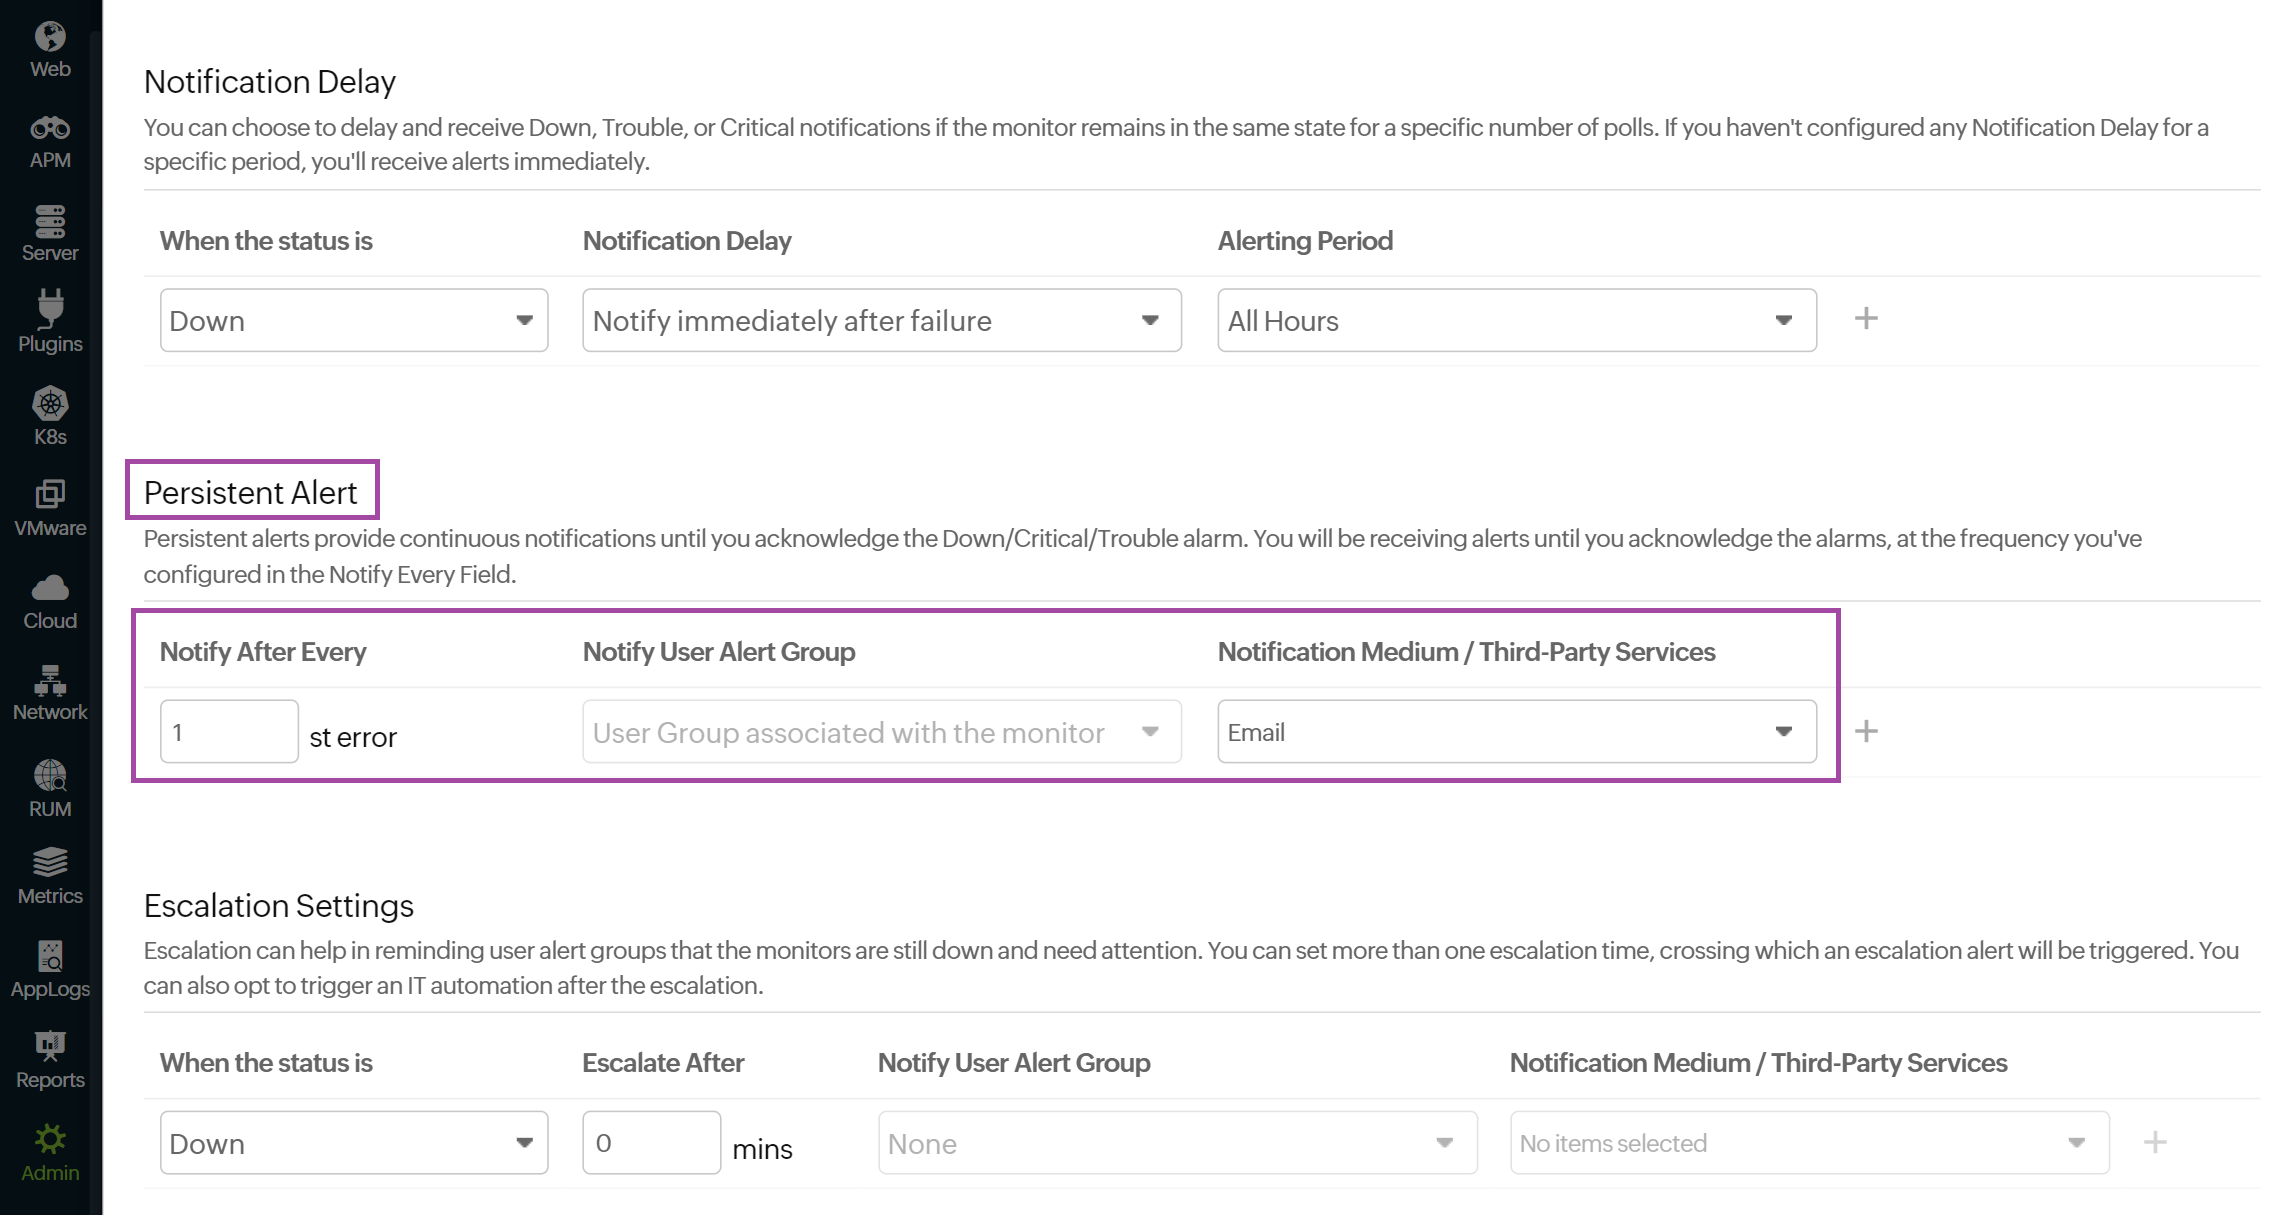
Set the Notify After Every field to 1 to receive alerts whenever new matching logs are found.
With persistent alerts, the system checks again at 9:05am. If new matching logs are found, they will be included in the alert.
Each monitor has a limit of 30 persistent alerts available for trouble or critical states.
AppLogs Alert Status Widget
Managing multiple log types can result in multiple alerts. Each alert that is triggered will eventually modify the status of the respective log type. For instance, out of 10 alerts, even if one has an issue, then the log type monitor status switches to Trouble.
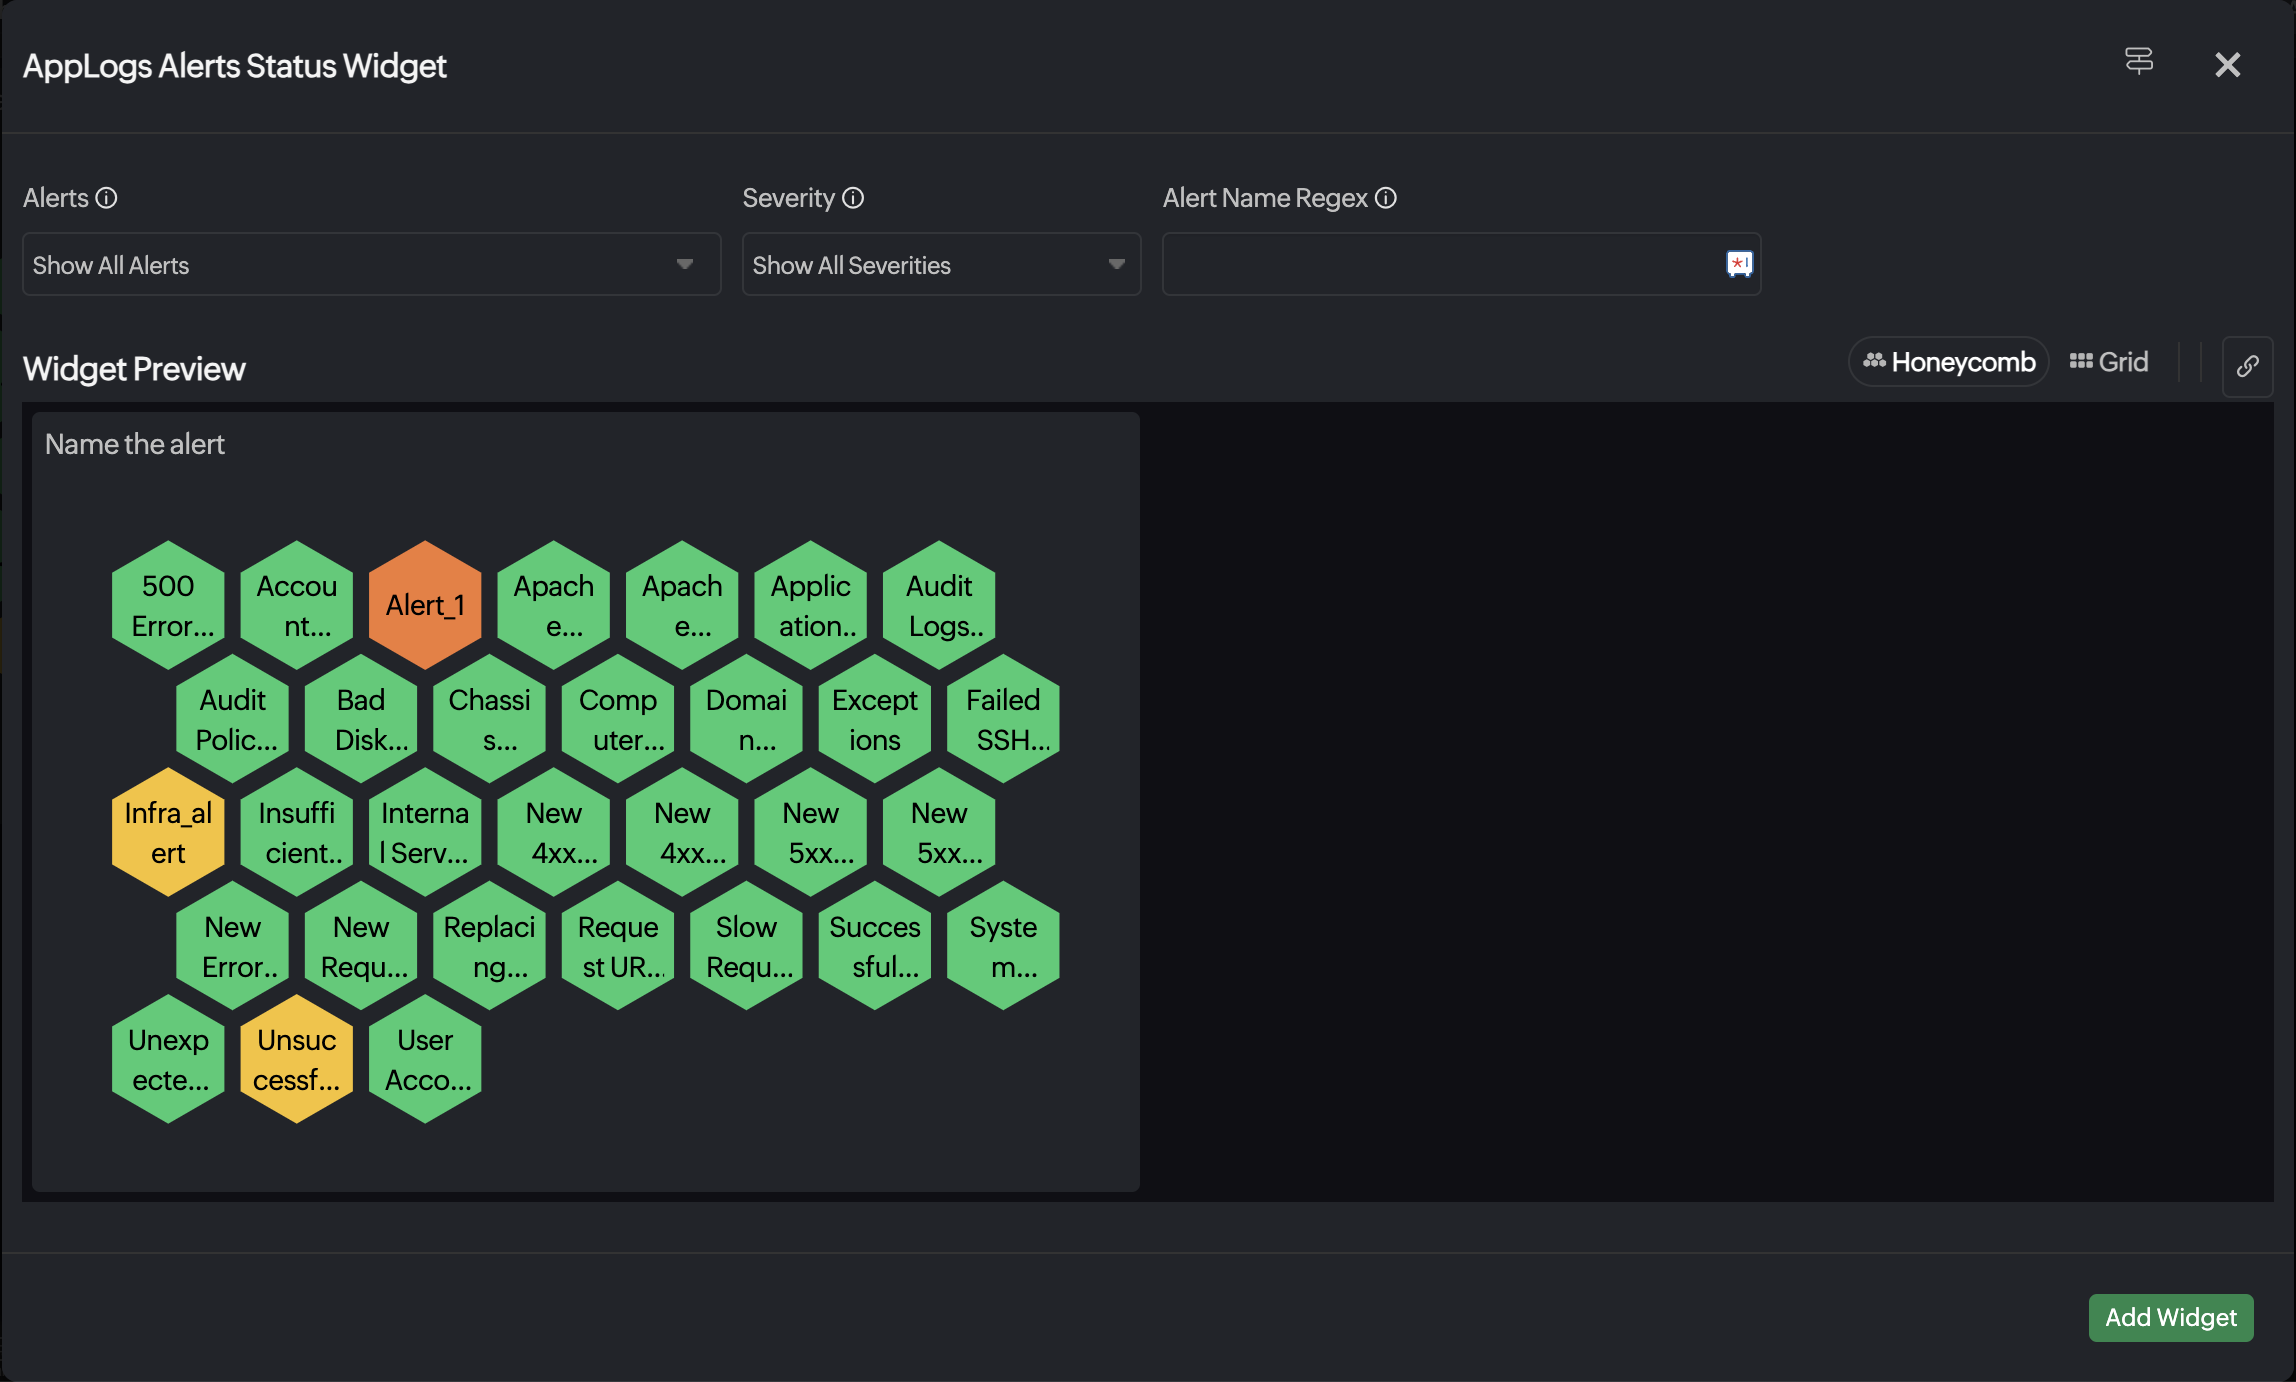
The AppLogs Alert Status Widget displays each AppLog alert as a color-coded tile, instantly reflecting its severity status: such as Critical, Trouble, or Up, along with the reason behind it to help you take immediate action. Clicking on a tile reveals detailed log information, giving you full context with the search query.
Easily toggle between Grid and Honeycomb in the widget based on your visual preference, with Honeycomb set as the default.
Configuring AppLogs Alerts Status Widget
To configure the status widget, use the following steps:
- Go to Home > Dashboards > Custom Dashboards tab > click Create new on the top right corner of the dashboard view.
- If you wish to edit an existing dashboard, select the preferred dashboard. Click Edit Dashboard at the top.
- In the Dashboard page, from the tool bar, you can perform the following actions:
- Click Add Widget to add the widgets you want from the left panel.
- Under AppLogs > click Alerts Status.
- Alternatively, you can type in the left panel search bar for Alerts Status and click on the alert image.
- In the AppLogs Alerts Status Widget pop-up, provide the following details:
- Name of the Widget: Provide a custom name to the widget for identification.
- Alerts: Multiple alerts and log types can be selected.
- Severity: Filter by severity status: Critical, Trouble, and Up.
- Alert Name Regex: Supports regular expression input to filter alert names based on custom patterns. Example: To show all the alert names that start with K8s, use the regex: K8s.*
- Click Add Widget.
The AppLog Alerts Status Widget will be added to your dashboard.
Frequently asked questions
1. Can I edit the log type in my alert query?
No, you cannot edit the log type (e.g., logtype="sample") in the alert query. If you need to change the log type, you must delete the existing alert and create a new one with the desired log type. However, you can edit the conditional or aggregation query following the log type.
2. What happens when an alert is created for a log type?
When you configure a first alert for the log type, it will automatically create a log type monitor with the log type name as its display name.
Note: AppLogs also offers default alerts for default log types. In both cases—whether it's a system-generated alert or a custom one—the first alert for a log type automatically generates a log type monitor using the log type name as its display name.
3. Can I configure multiple alerts for a single log type?
Yes, you can configure multiple alerts for a single log type. All alerts created for the log type are associated with the same log type monitor.
4. Can I delete or suspend a log type monitor if it has associated alerts?
No, you cannot delete or suspend a log type monitor that has associated alerts. To delete the monitor, you must first delete the alerts linked to it. To delete alerts, navigate to Metrics > AppLogs and delete the alert, or you can even delete it from Admin > AppLogs > Alerts.
5. Is there a relationship between log collection error status and log type monitor status?
No, there is no connection between the log collection error status and the log type monitor status. The log collection error status does not impact the log type monitor status. The log type monitor status is determined by the status of the alerts associated with the log type.
6. What should I do if I have monitor permissions and want to create my first alert for a log type?
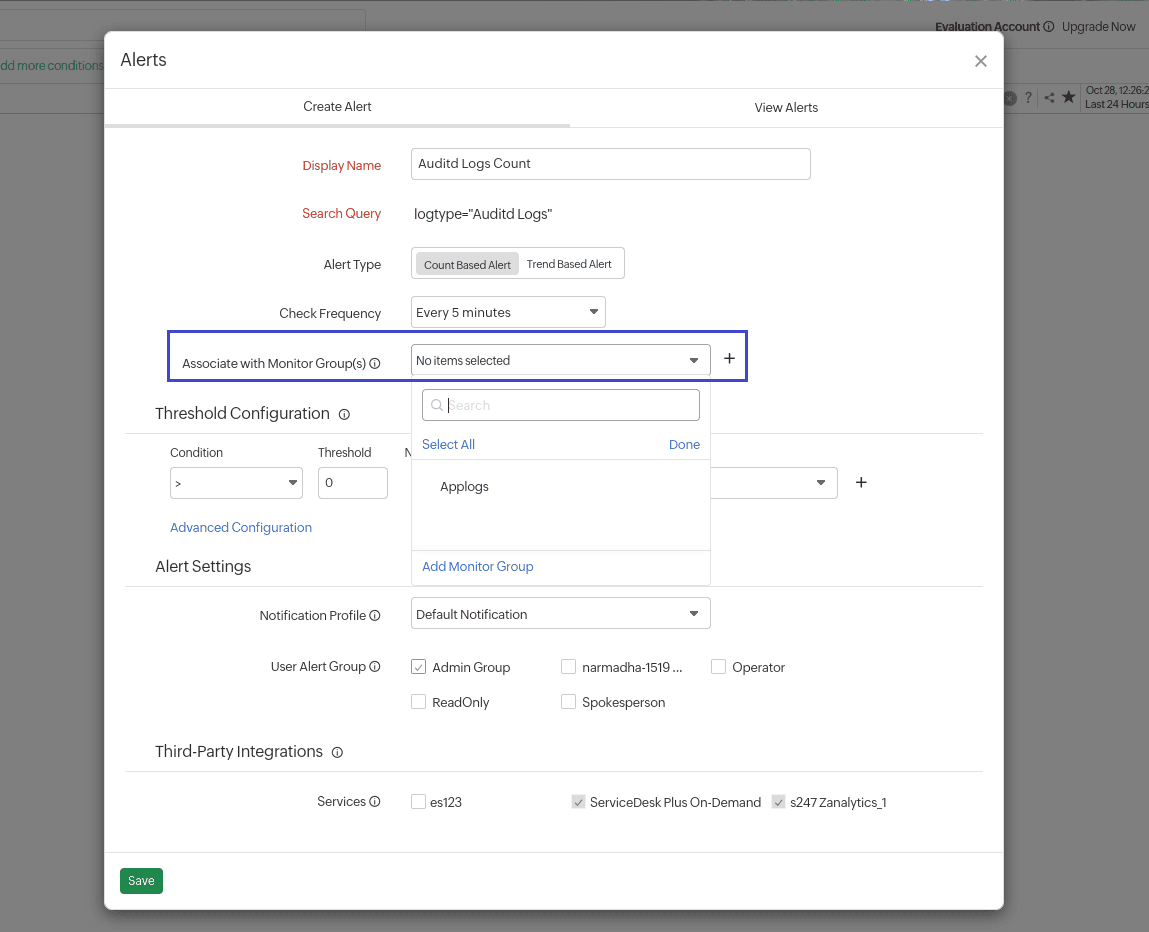
When creating your first alert for a log type, you must associate it with a monitor group to set it up correctly. If another user does not have permission for that monitor group, they will not be able to create the alert.
Related articles
- Configuring voice calls and SMS alerts
- Licensing for AppLogs Alerts
- Log management with Site24x7
- Supported log types
- Query language search
- Saving search queries
- Predefined alerts
Further reading
Blog: Track events in real time: Enhance monitoring with proactive log analysis
