Check the health and availability of your Linux servers for optimal performance with Site24x7's Linux monitoring tool.
I/O wait time is a metric used to measure the amount of time the CPU waits for disk I/O operations to complete. A high I/O wait time indicates an idle CPU and outstanding I/O requests—while it might not make a system unhealthy, it will limit the performance of the CPU.
The CPU’s I/O wait signifies that while no processes were in a runnable state, at least one I/O operation was in progress. In simple terms, I/O wait is the time spent by the CPU waiting for I/O completion.
I/O wait simply indicates the state of the CPU or CPU cores. High I/O wait means the CPU is outstanding on requests, but a further investigation is needed to confirm the source and effect.
Here are a few possible causes of high I/O wait time:
High I/O wait forces the server to handle higher bandwidth to perform other computations while waiting on IO requests. I/O wait is a common metric to analyze system performance. When high I/O wait occurs frequently, it can negatively impact system performance by slowing down the system or causing issues such as low transaction throughput in the database and health degradation in applications and databases.
The two commands most commonly used to identify and troubleshoot I/O wait time in Linux are top and vmstat. These commands will display various CPU-level statistics, including I/O wait time.
top commandThe top command is the easiest and most widely used command for identifying I/O wait time in Linux. It displays a dynamic and real-time view of the system, CPU-level statistics, and a running list of processes managed by the kernel.
Syntax:
top [options]
Example:
Running the top command will display an output similar to the one shown below:
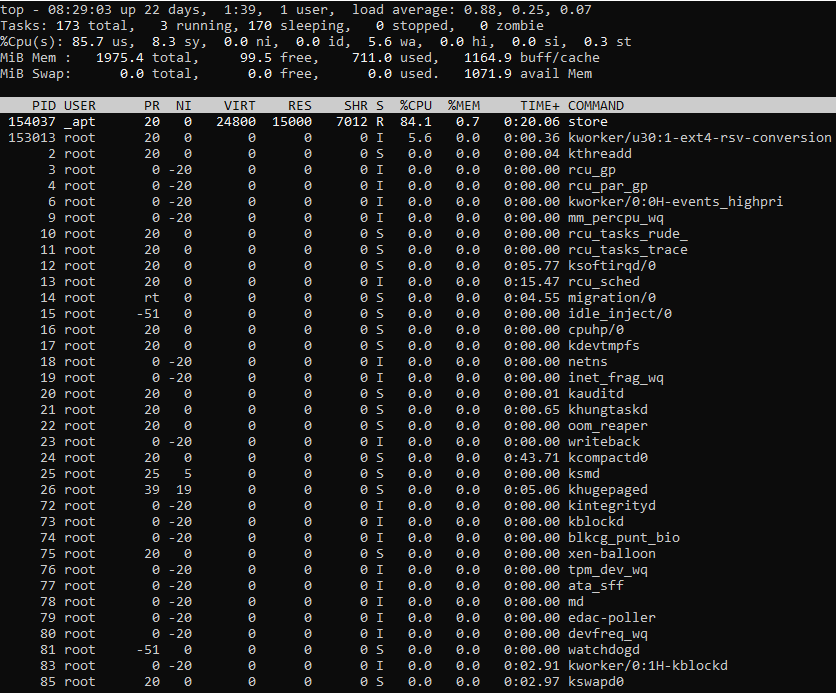 Fig. 1: Output of the
 top command
We’ll focus on the %Cpu(s)line. It displays, among other important statistics, the I/O wait time. The I/O wait time is denoted by the wa label in the %Cpu(s) line.
wa denotes the percentage of time the CPU was waiting for I/O to complete. If you are on a multi-core processor system, you can press 1 while the top command is running to get a breakdown of CPU usage per CPU.
vmstat commandThe vmstat command is another performance monitoring tool provided by Linux. It delivers information about memory, processes, CPU, and more. By default, vmstat displays the statistics since the system’s last reboot. It can also show real-time statistics that update after a specified interval.
Syntax:
vmstat [options][delay [count]]
The two parameters commonly used with the vmstat command are:
Example:
Running the vmstat command will give you an output similar to the one shown below:
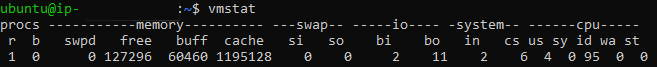 Fig. 2: Output of the
 vmstat command
The output is divided into four sections; we will focus on the CPU section. The columns in this section are similar to the %Cpu(s) line of the top command. Along with the I/O wait time (wa), we also get some additional information through the vmstat command, such as the total free memory or the number of blocks swapped to and from I/O. Having less free memory, for example, can lead to a high I/O wait time.
Once you’ve confirmed that you’re dealing with a high I/O wait time, the next step should be finding processes responsible for these I/O operations. One of the easiest and most frequently used commands for this is iotop.
iotop commandThe iotop command is identical to the top command in the sense that it is used to monitor the disk I/O usage along with the running list of processes or threads responsible for it. It is based on Python and requires kernel access to monitor the processes doing I/O.
Syntax:
iotop [options]
Example:
Running the iotop command will give you an output similar to the one shown below:
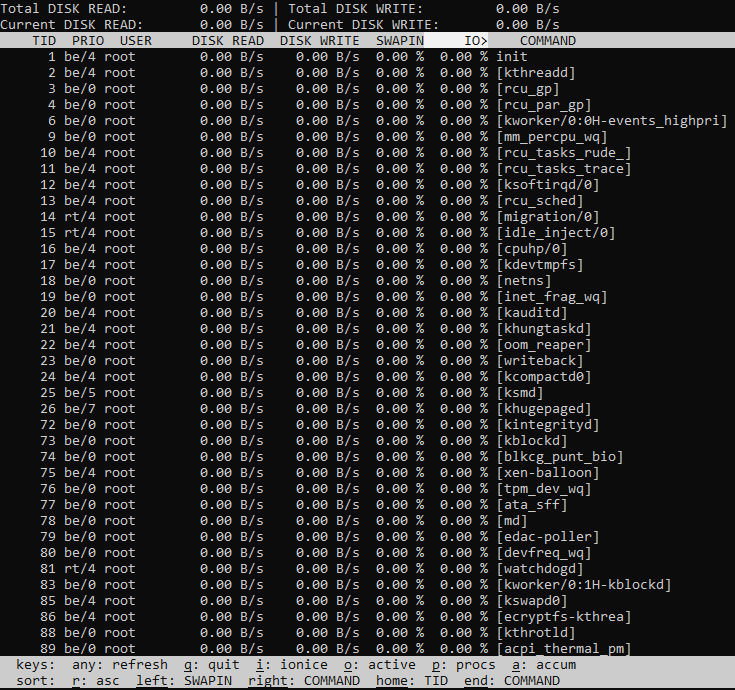 Fig. 3: Output of the
 iotop command
The first line contains the total read and write bandwidth of the disk. The next line displays the actual bandwidth of read and write operations done by the processes or threads currently doing I/O. The next section displays the running list of processes with data on their current disk I/O usage. The most important column here is the I/O column, which displays the percentage of time the process was doing I/O with respect to its total processing time. This particular list of processes is sorted in reverse order in this column.
One of the most commonly used options with this command is -o or -only. Run together with the command (iotop -o), it narrows the results down to a running list of processes that are actually doing I/O.
The top and vmstat commands tell us about the I/O wait time, and the iotop command helps us identify the processes doing I/O operations. One other important factor to consider is what disks are being used in these operations. The iostat command provides this information.
iostat commandThe iostat command displays a system’s input/output statistics. It generates device-level reports by monitoring the active time period in relation to average transfer rates. And like the top and vmstat commands, iostat also displays the CPU statistics.
Syntax:
iostat [option] [interval] [count]
The interval and count parameters here are similar to those of the vmstat command, and they’re used to show real-time updates infinitely or for specific counts only.
Example:
Running the iostat command will give you an output similar to the one shown below:
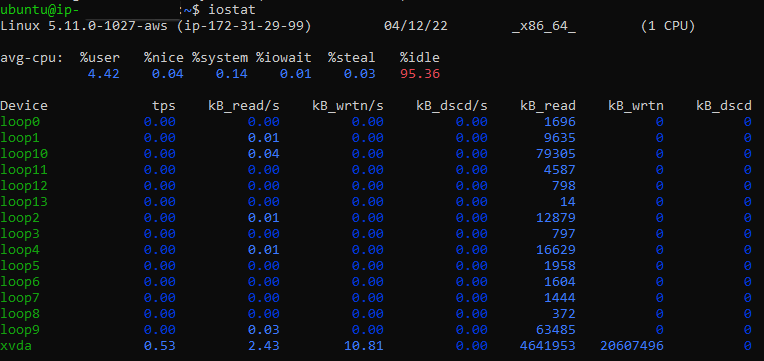 Fig. 4: Output of the
 iostat command
The first line above displays the average CPU statistics, including the I/O wait time. It represents the same value as that of wa in the top and vmstat commands. The next sections provide the following data for all devices and partitions:
After we’ve identified the processes behind the high I/O wait time and the disks involved, there are multiple fixes we can apply. These are some of the most common methods to minimize high I/O wait time:
When troubleshooting high I/O wait in Linux, it’s important to understand the root cause as the first step. The top and vmstat commands can then help diagnose high I/O wait time, while iotop and iostat can help troubleshoot by identifying the processes and disks causing the high I/O wait time. We’ve learned that there are multiple ways to handle high I/O wait time, depending on its cause. Focus on minimizing I/O wait–the lesser the I/O wait time, the better your system will perform.
The Site24x7 server monitoring agent captures disk I/O metrics and CPU usage breakdown (including I/O Wait), allowing you to correlate high wait times with specific disk activities. You can also use dynamic thresholds (AI-based anomaly detection) to automatically identify unusual I/O wait patterns.
Yes, you can configure custom performance thresholds in Site24x7 to receive instant alerts (via SMS, email, etc.) when I/O wait exceeds acceptable limits. For more advanced alerting, consider using dynamic thresholds (AI-based anomaly detection) to automatically trigger alerts when I/O wait deviates from normal patterns.
Yes, the agent discovers and monitors all mounted partitions, providing granular I/O and usage metrics for each disk volume.
