System metrics
StatusIQ's System Metrics deliver real-time performance insights by seamlessly incorporating data from third-party sources or custom-defined metrics. This ensures enhanced transparency and effective communication of critical system performance.
Custom metrics provide customers with precise insights tailored to their unique system requirements. By incorporating these metrics into their status pages, customers can offer targeted information, enhancing transparency and user understanding of system health and performance.
You can choose the system metric from the list below for steps to configure, add system metrics, and more.
- Pingdom
- New Relic
- AppOptics
- Datadog
- How to set up custom system metrics
- How to reset the custom system metric data
- How to edit or delete third-party data source configurations
- How to edit or delete a system metric
Pingdom
How to configure Pingdom in StatusIQ
-
-
- How to get the API key from Pingdom
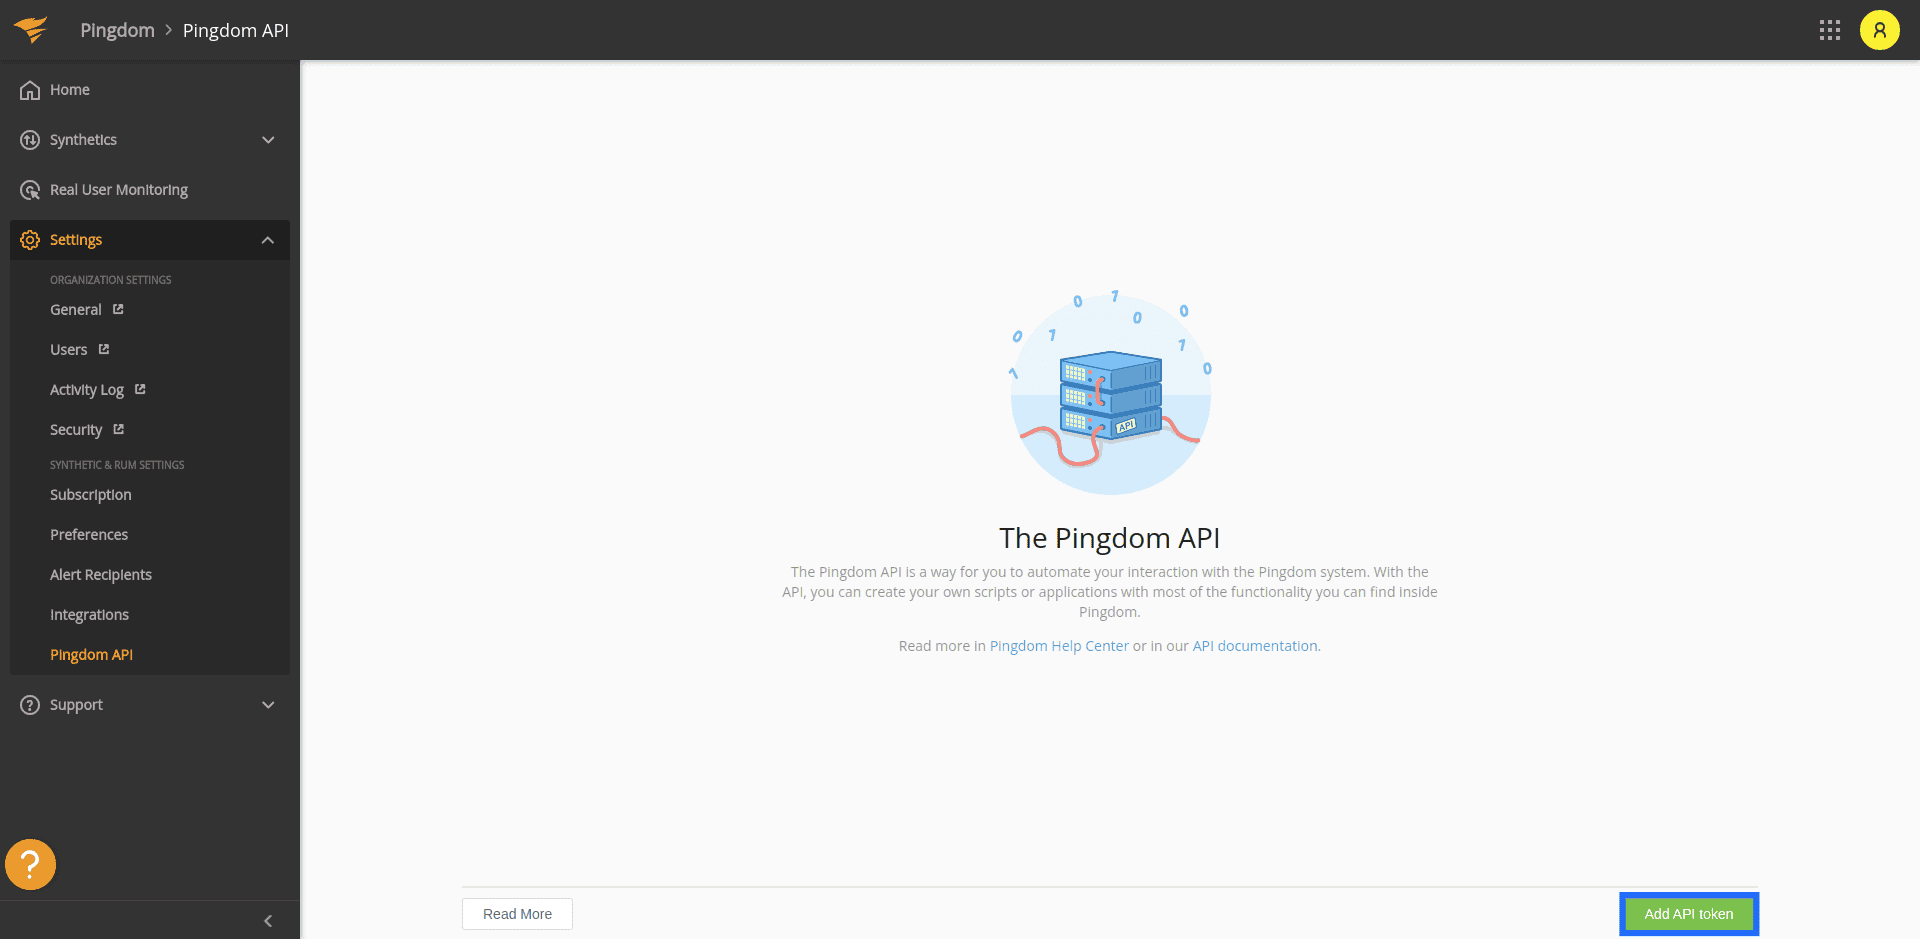
- Log in to Pingdom.
- Go to Settings and click Pingdom API. Click Add API token.
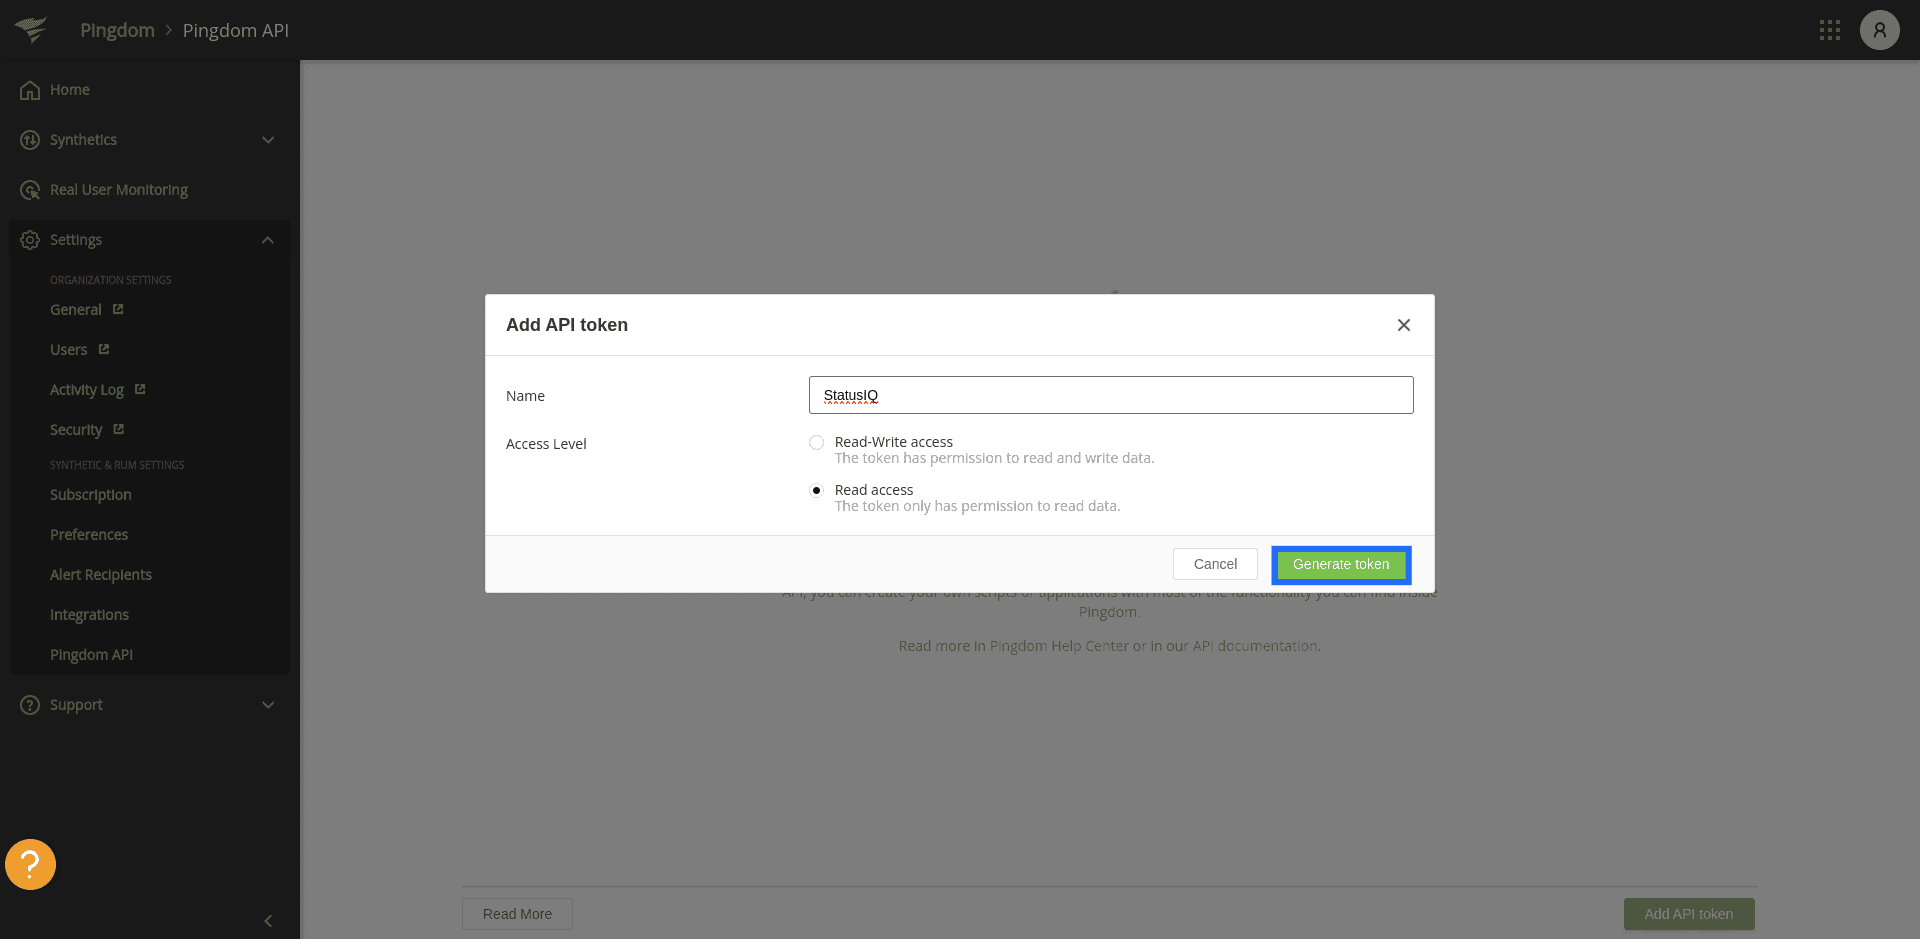
- In the add API token form, fill out the name and select Read access. Click Generate token.
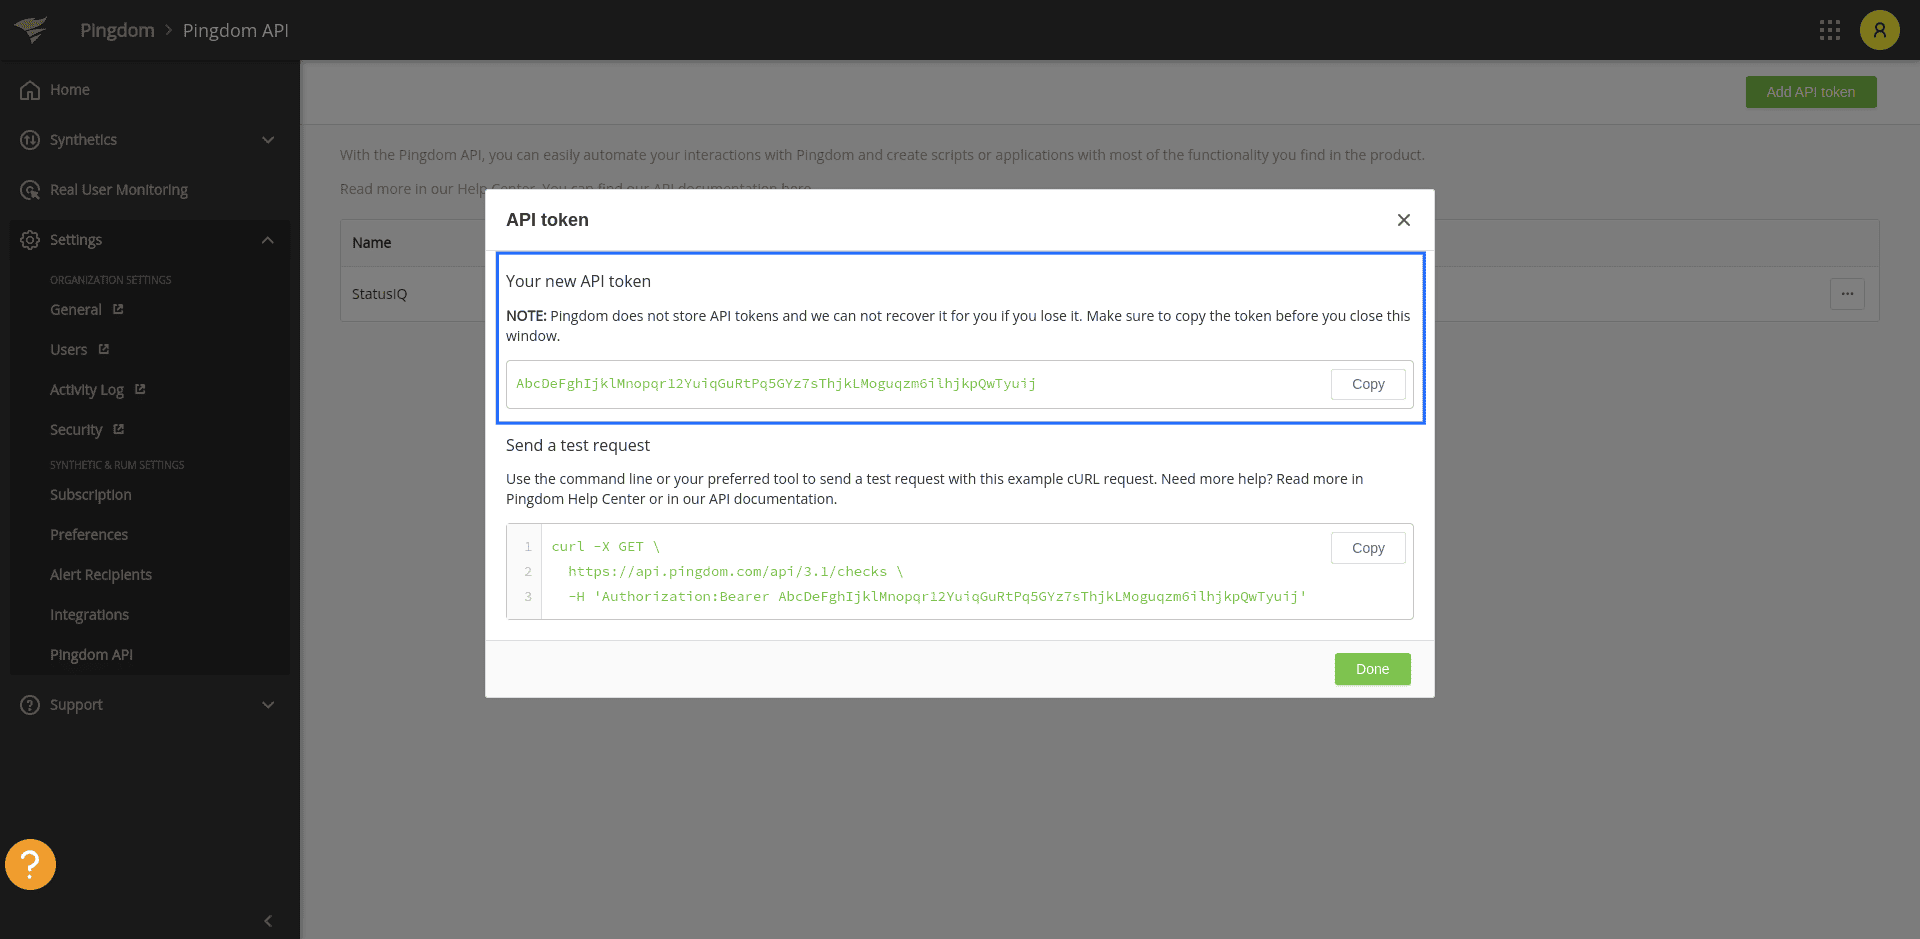
- The API token will be generated. Copy the API token.
- How to set up your Pingdom system metrics in StatusIQ
- Log in to StatusIQ.
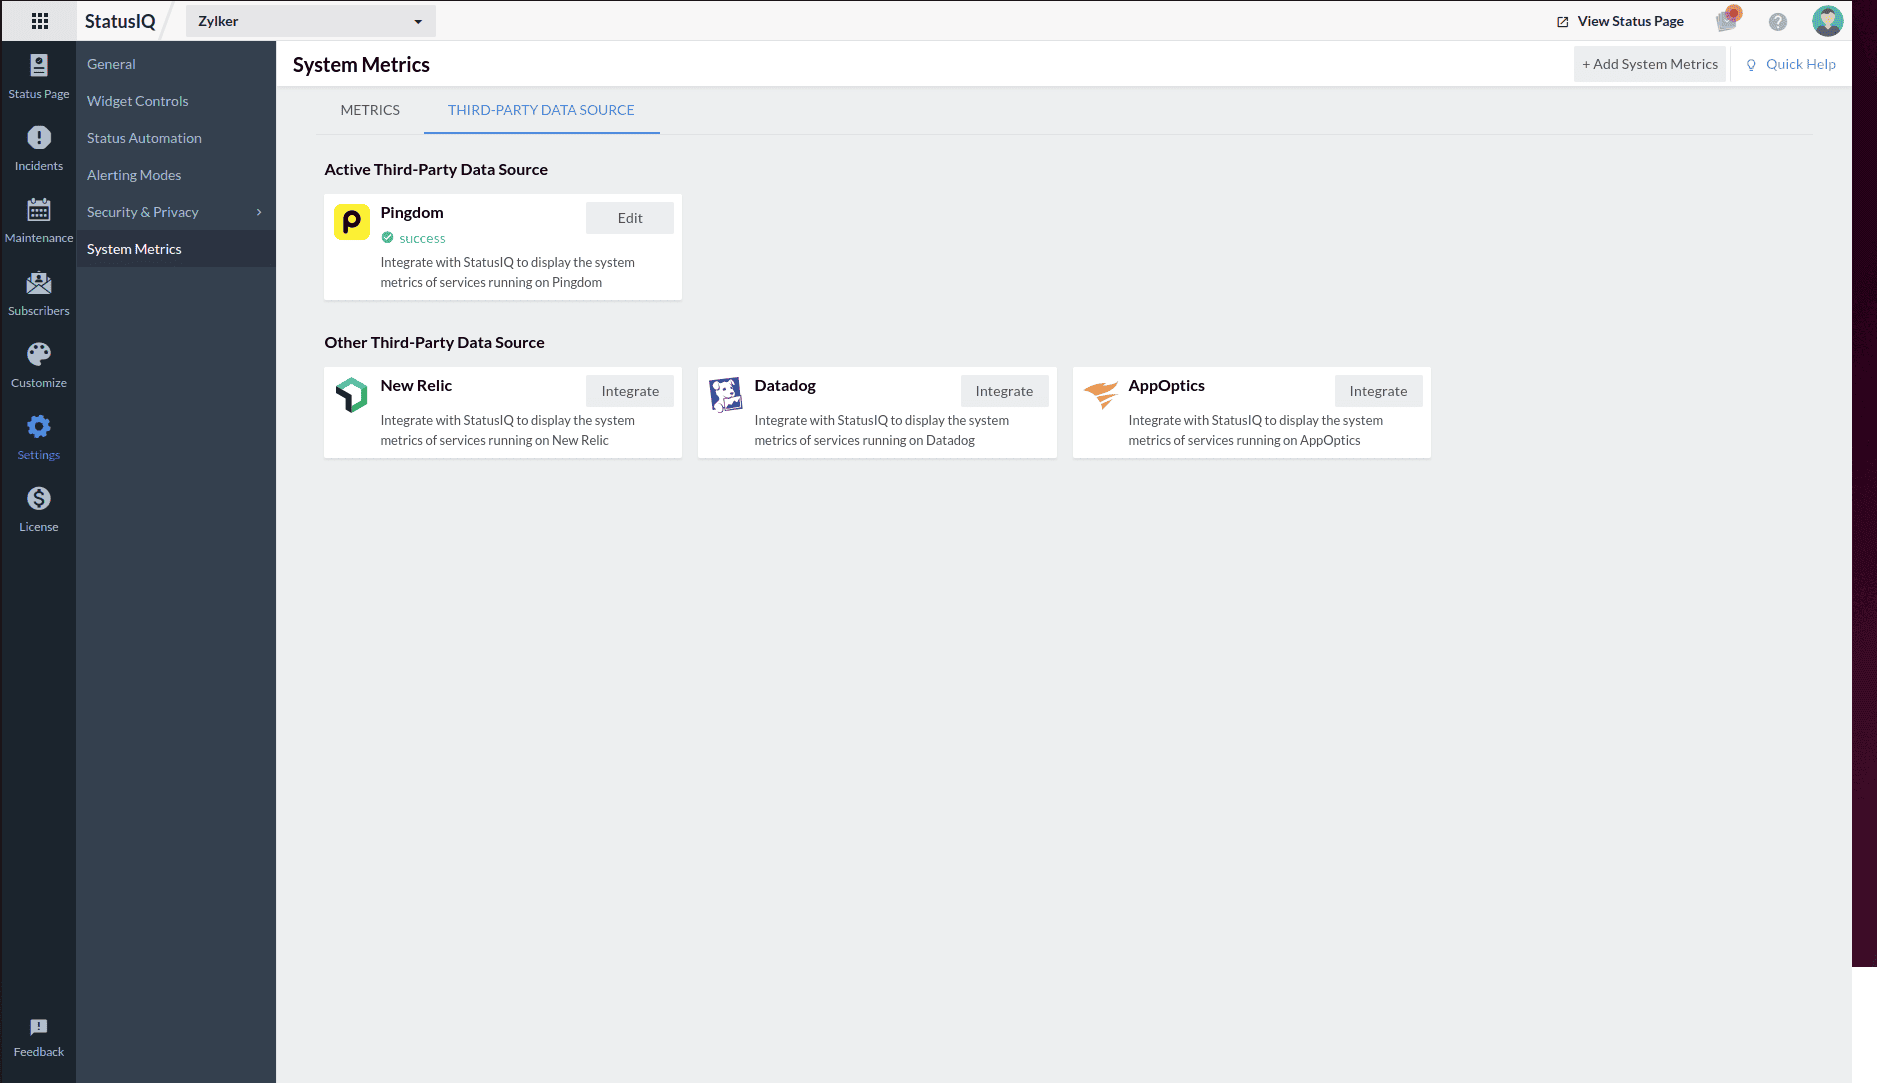
- Go to Settings > System Metrics. Toggle to Third-Party Data Source.

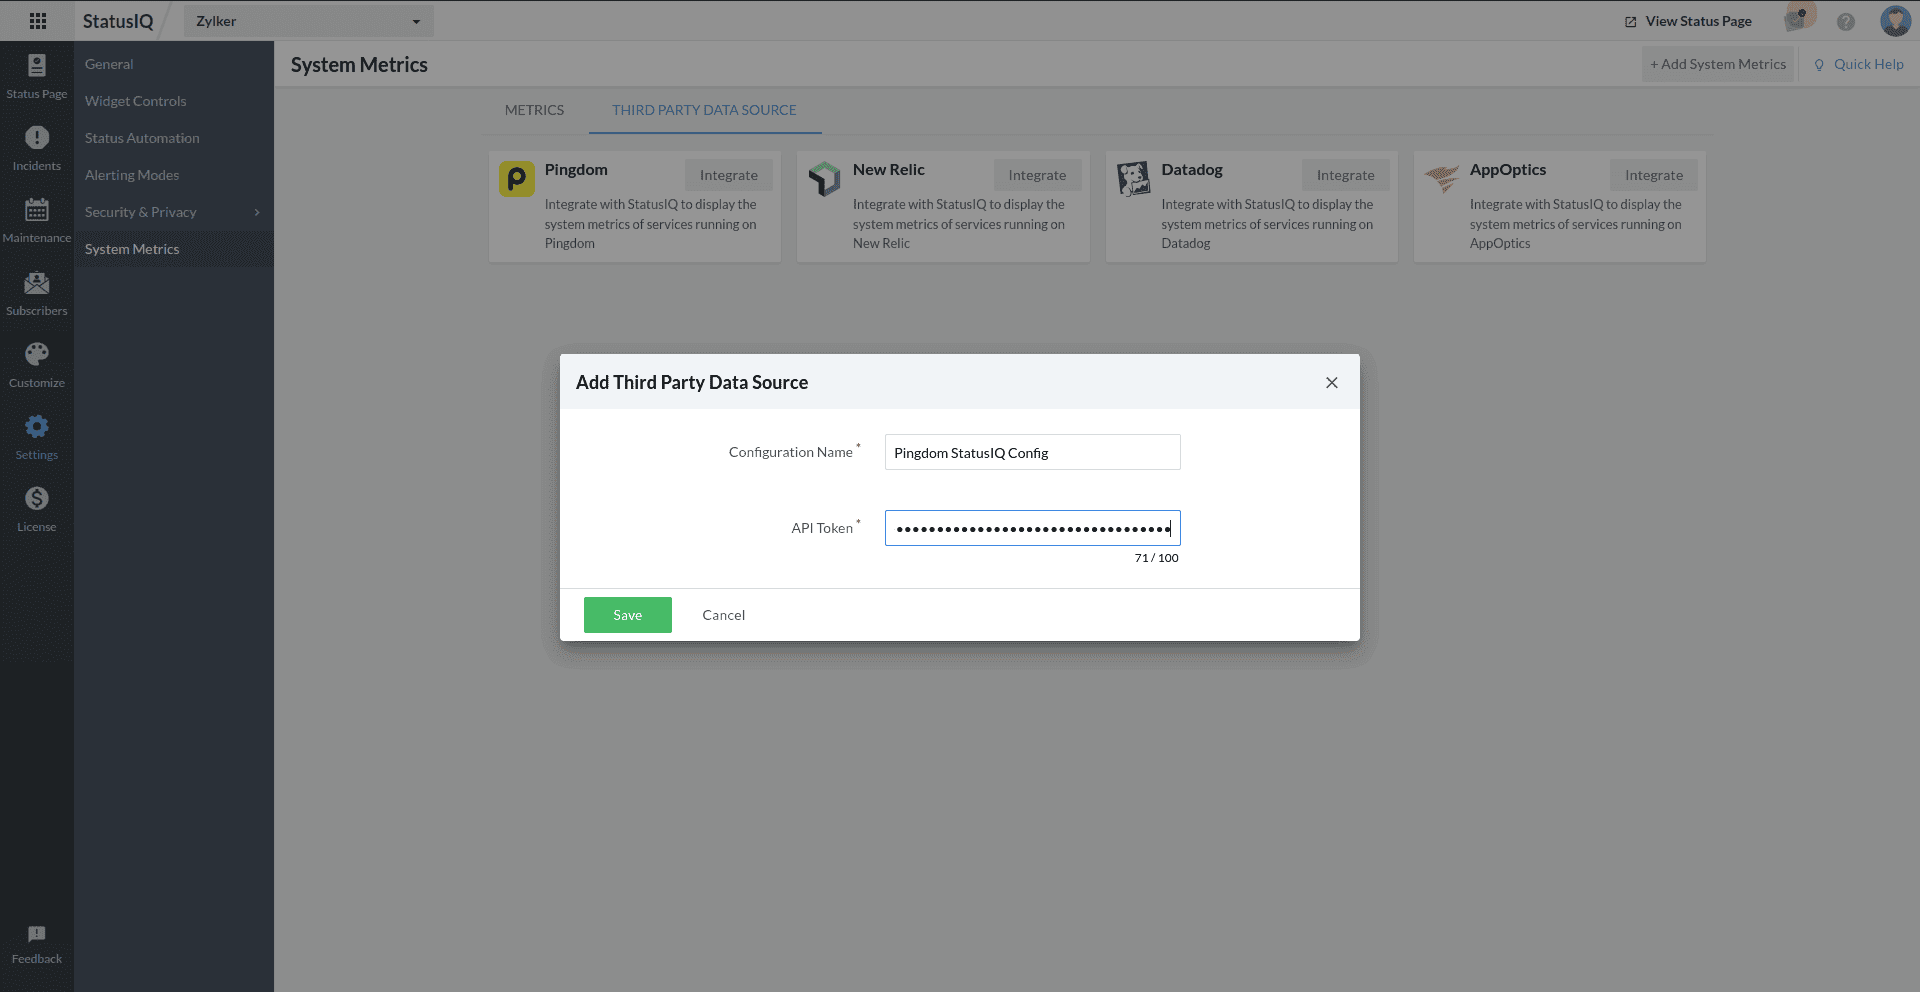
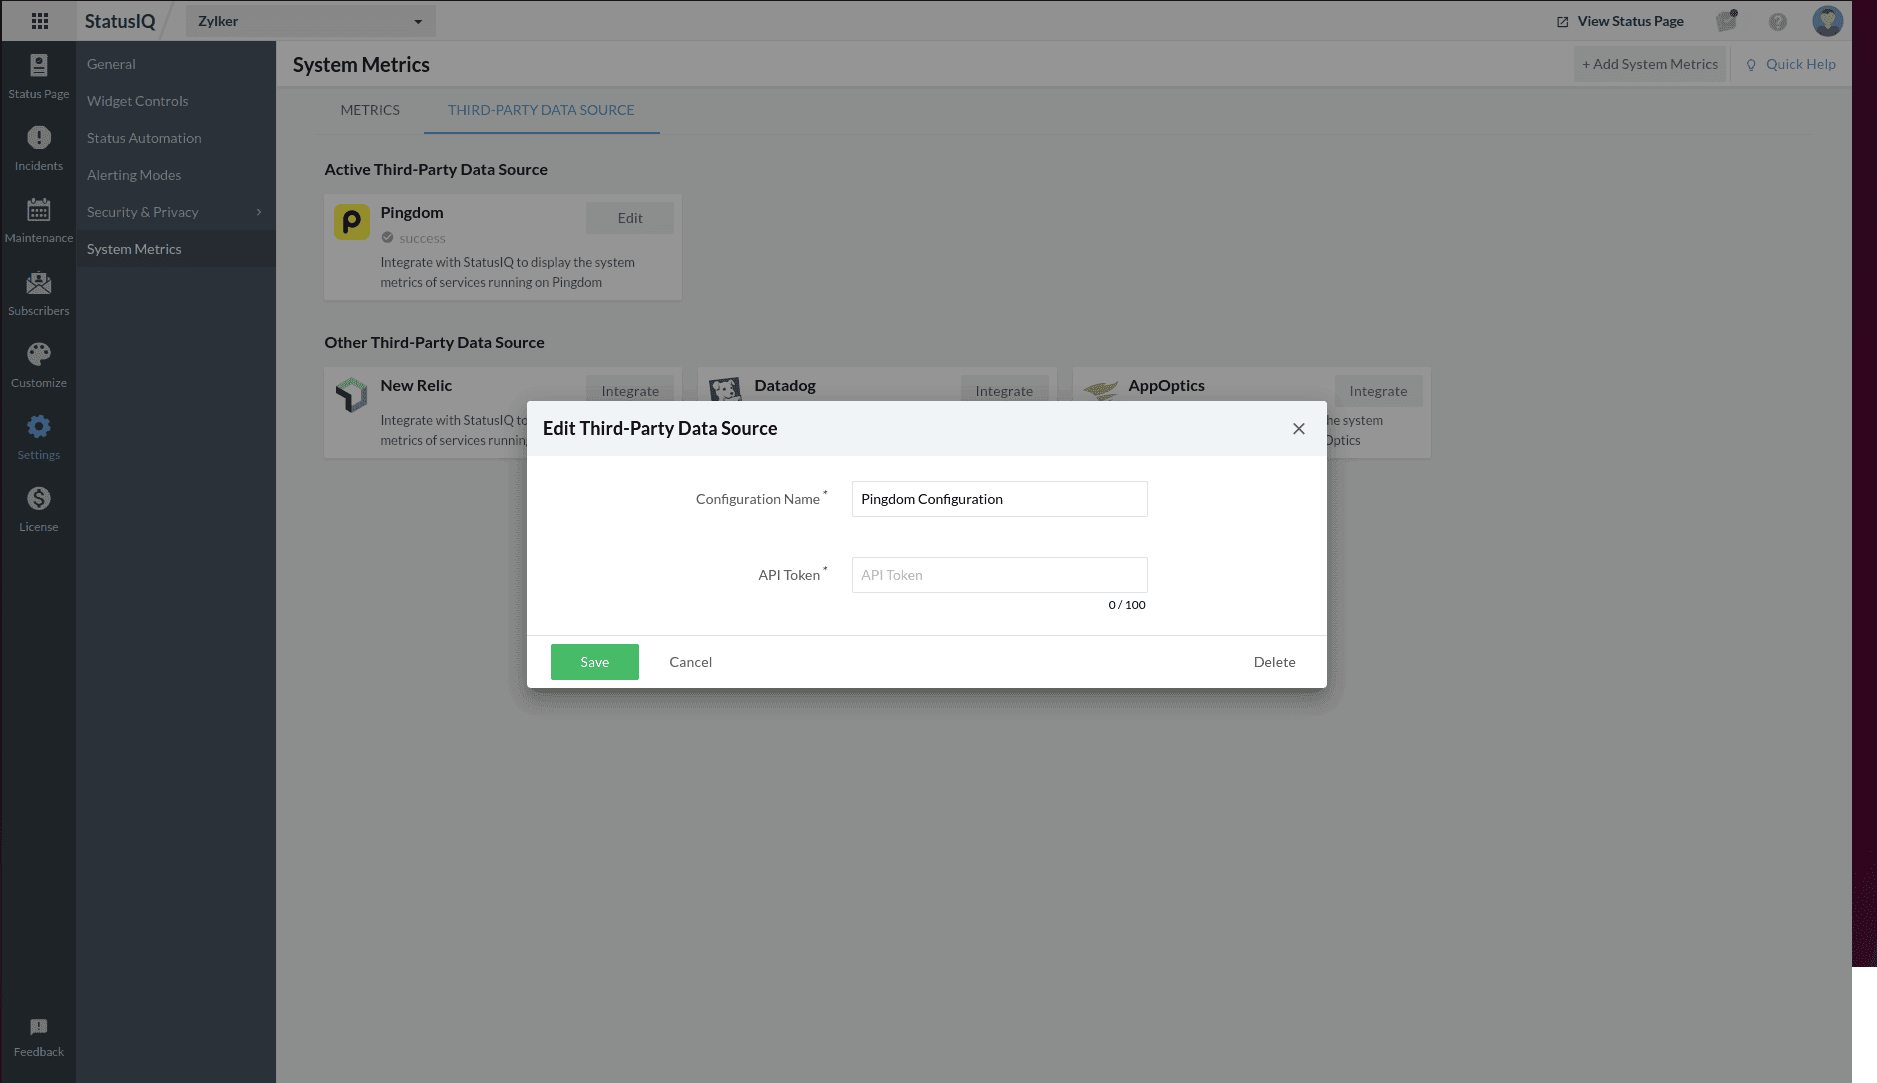
- Select Pingdom. In the add Third Party Data Source form, fill in the Configuration Name and paste the copied API key into the API Token field. Click Save.
- You will receive a confirmation pop-up. Click Proceed.
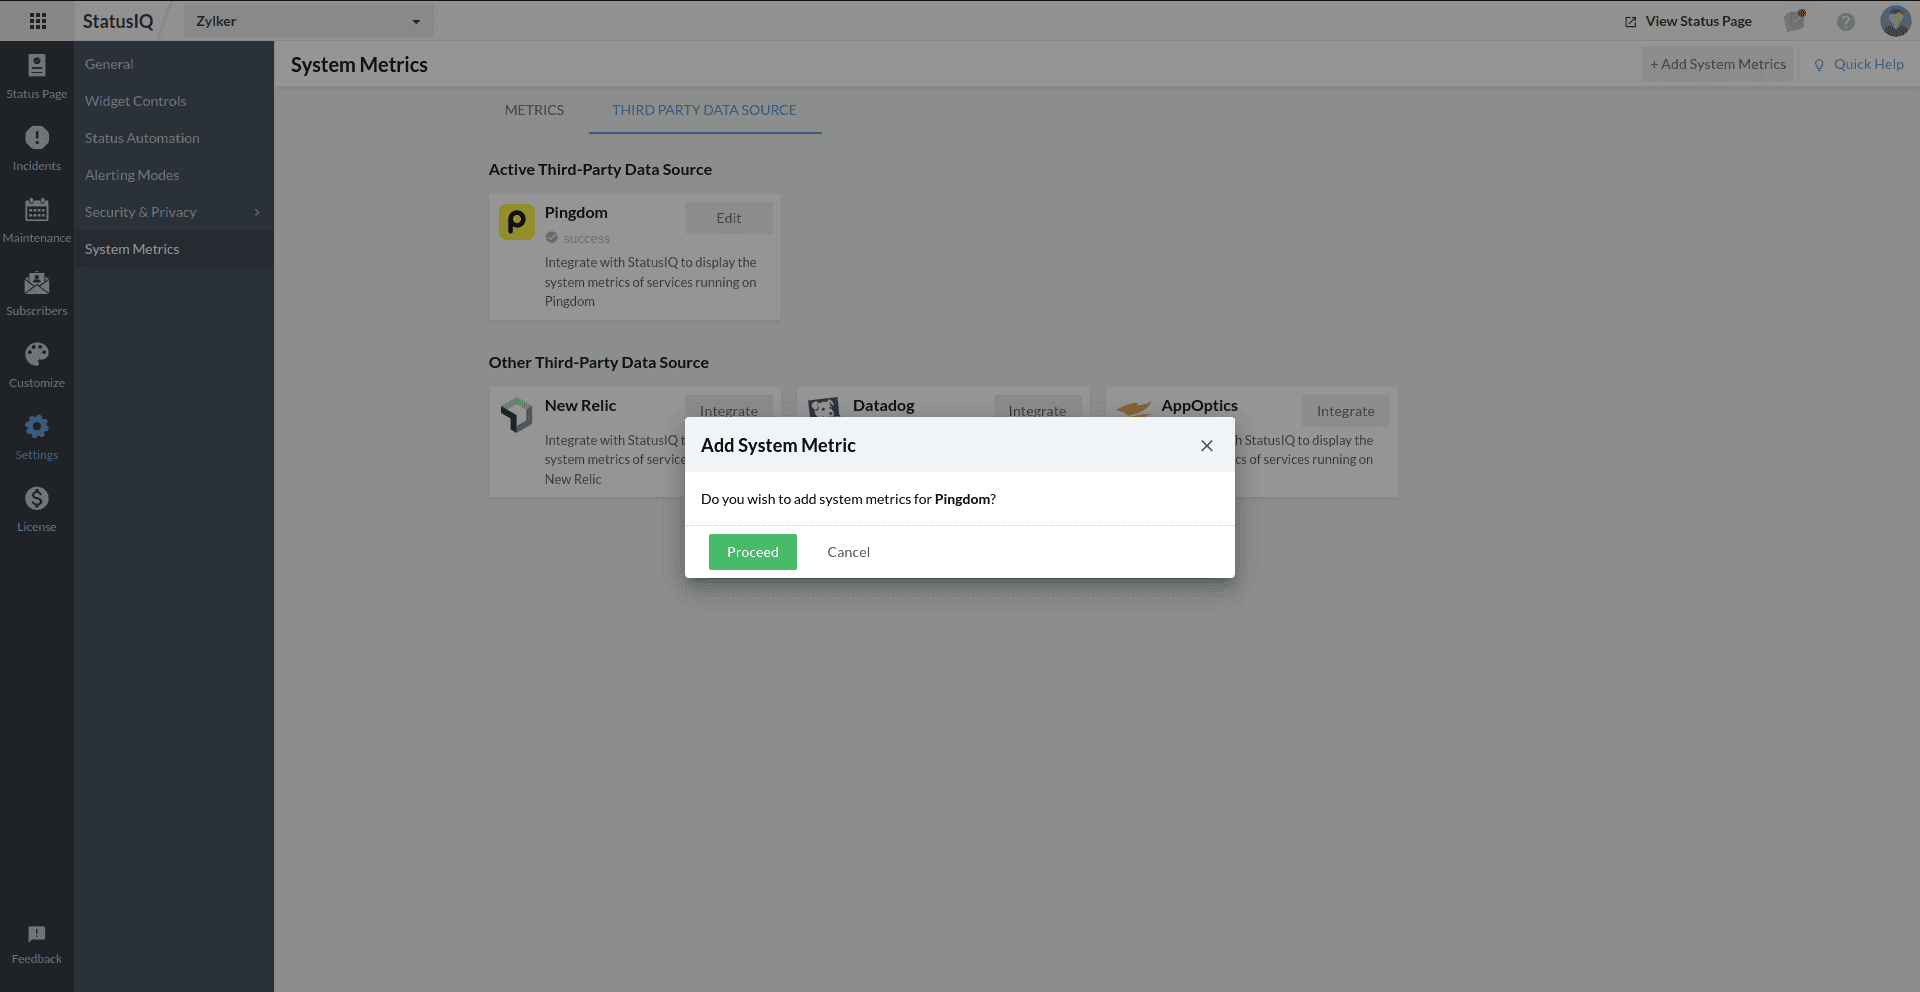
If you want to configure Pingdom but prefer not to add system metrics at this time, click Cancel. If you wish to add system metrics, click Proceed and continue from the second step of the next section.
- How to get the API key from Pingdom
- How to add Pingdom system metrics in StatusIQ after configuration
-
- In StatusIQ, go to Settings > System Metrics and click + Add System Metrics in the top band as shown below.

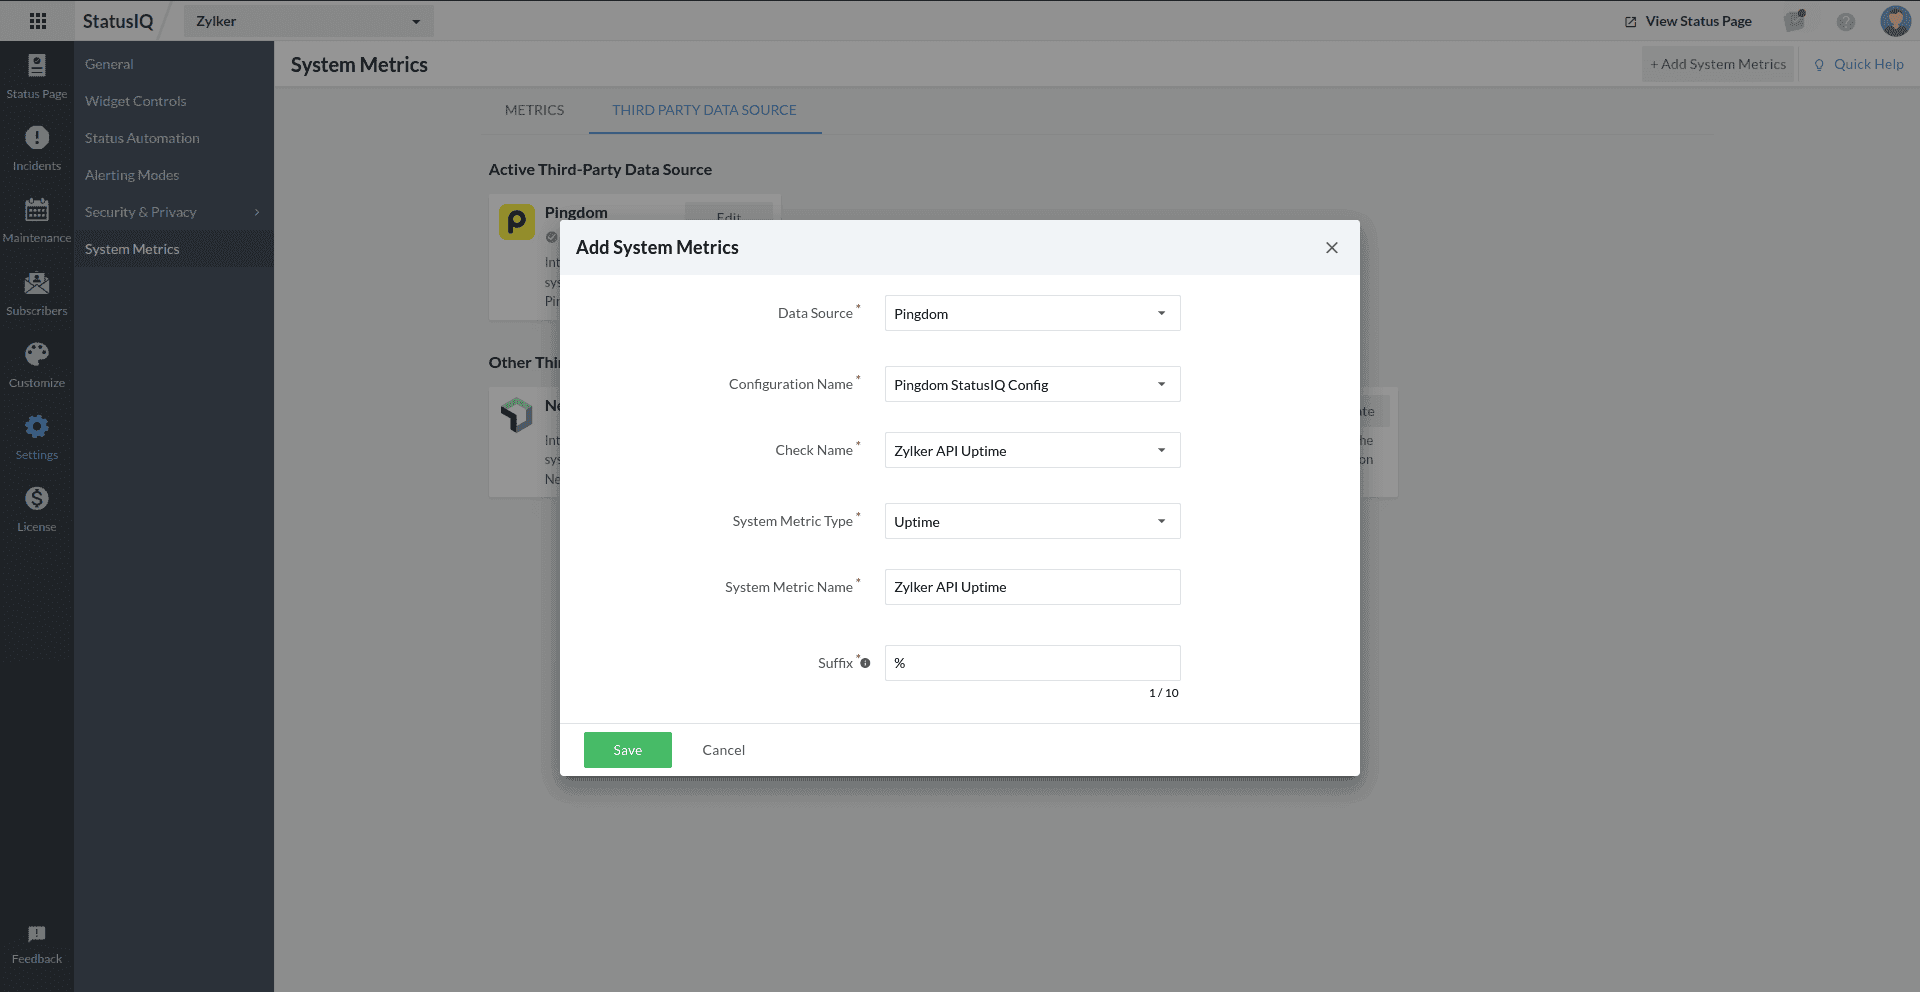
- You will now see the Add System Metrics form. Fill out the details and click Save.
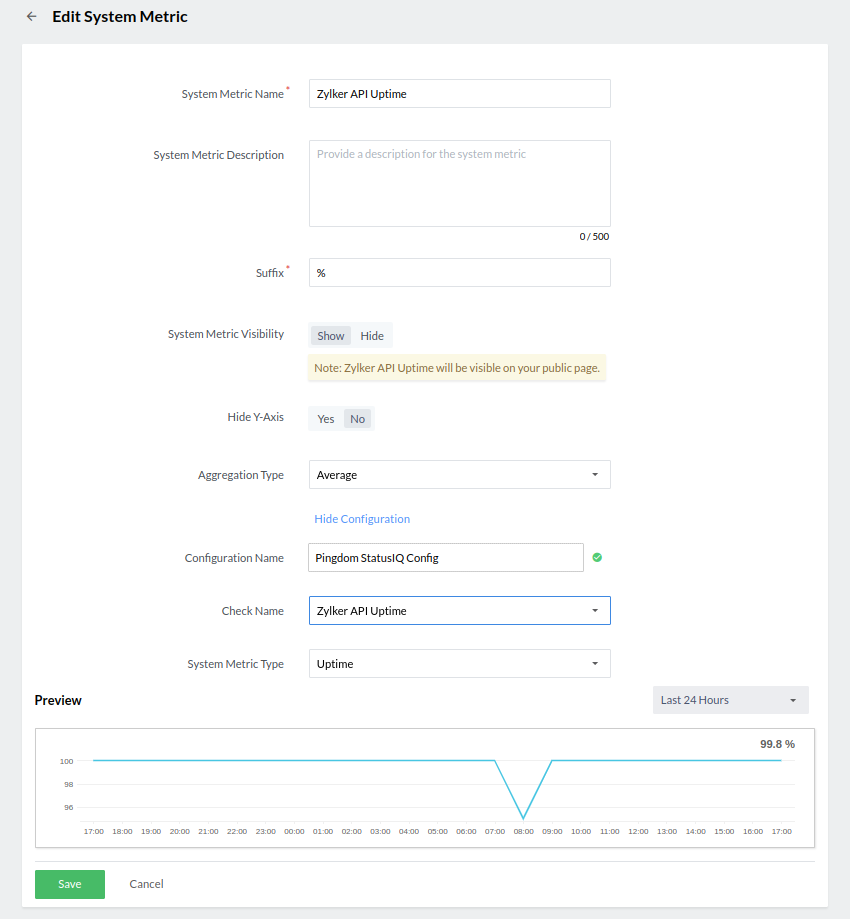
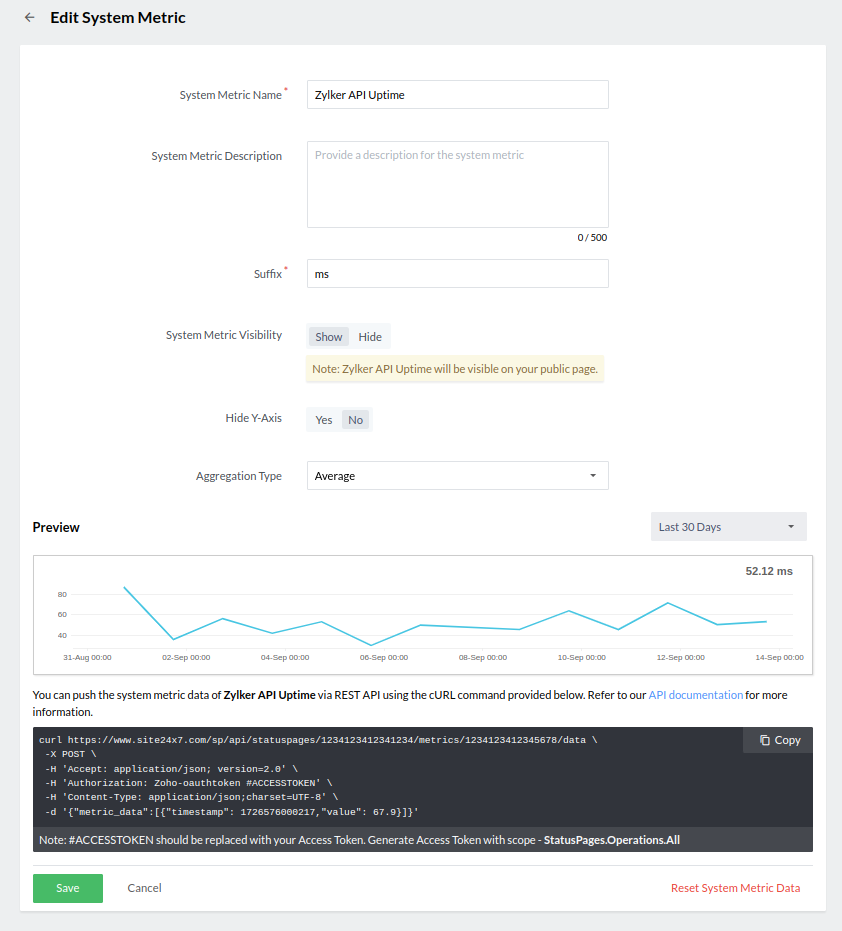
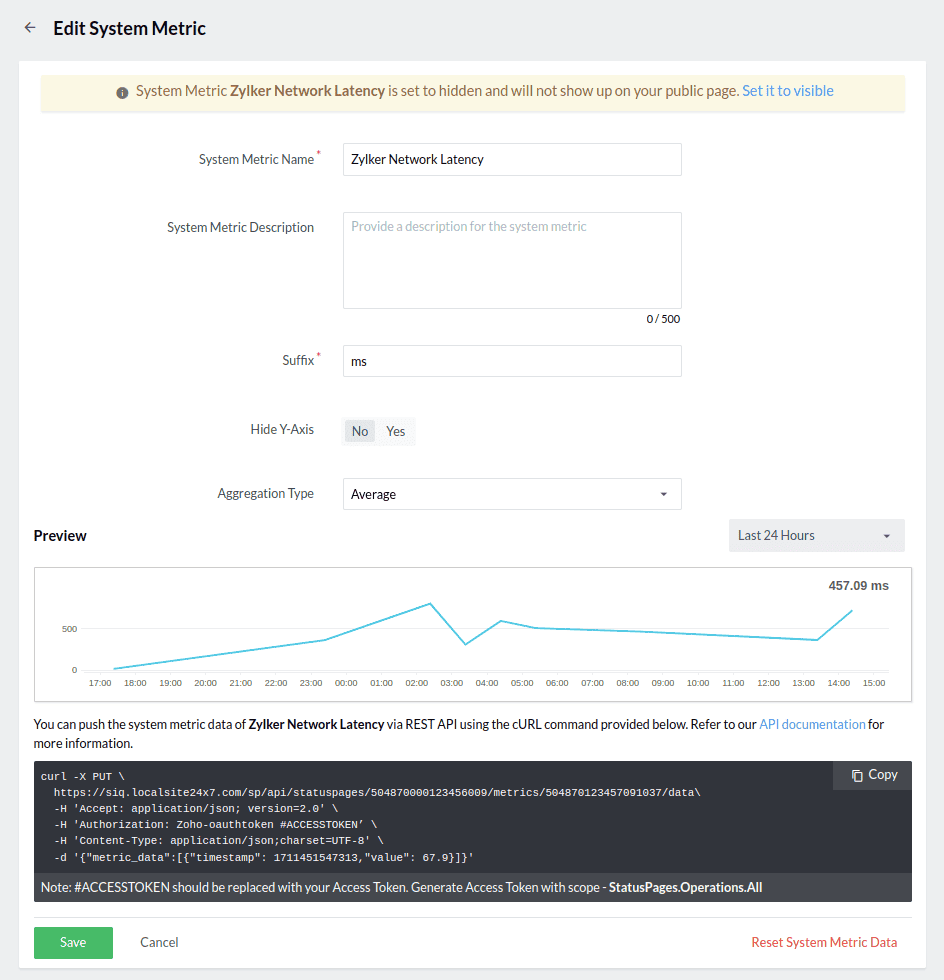
- Now, on the Edit System Metric page, fill out the required details.
- In StatusIQ, go to Settings > System Metrics and click + Add System Metrics in the top band as shown below.
-
-
- Click Set it to visible for the system metric to be displayed on the public page.
- Aggregation type - Custom time: Last 24 hours (1 hour), 7 days (1 day), or 30 days (1 day).
New Relic
-
-
How to configure New Relic in StatusIQ
- How to get the API key from New Relic
- Log in to New Relic.
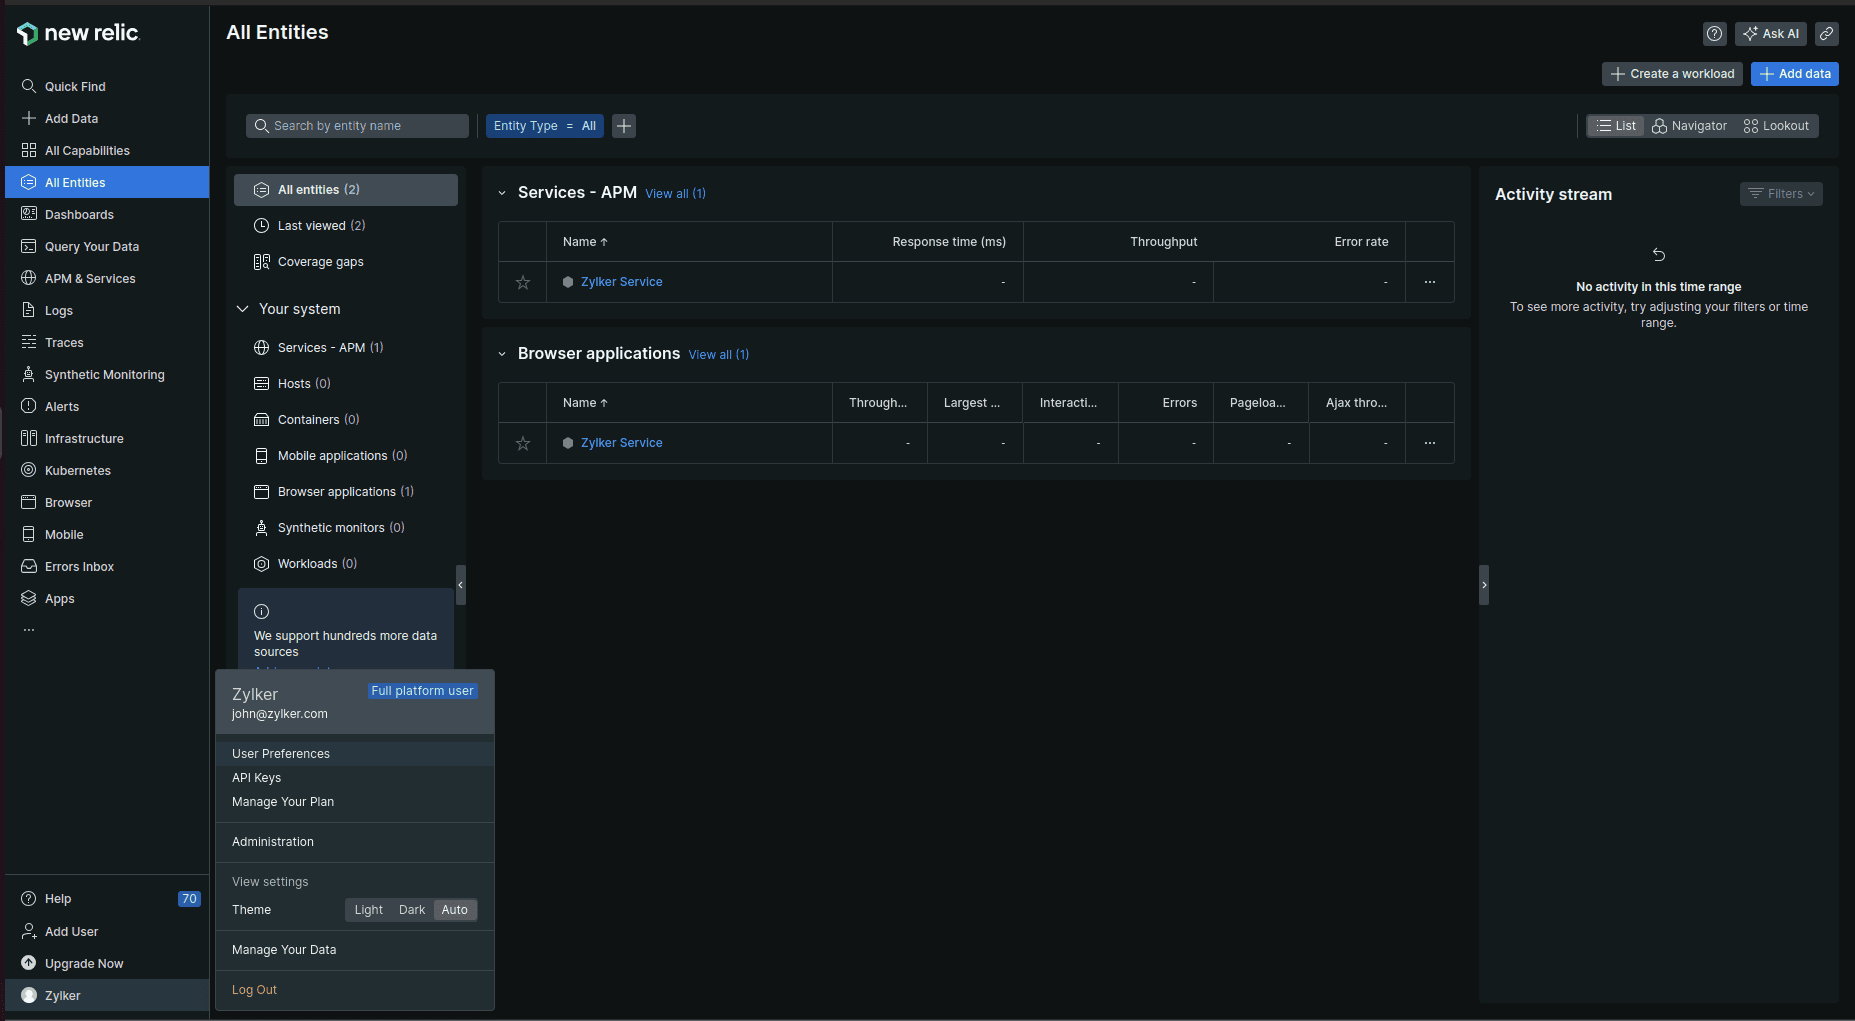
- Click your profile name in the bottom-left corner of the page and select API Keys.
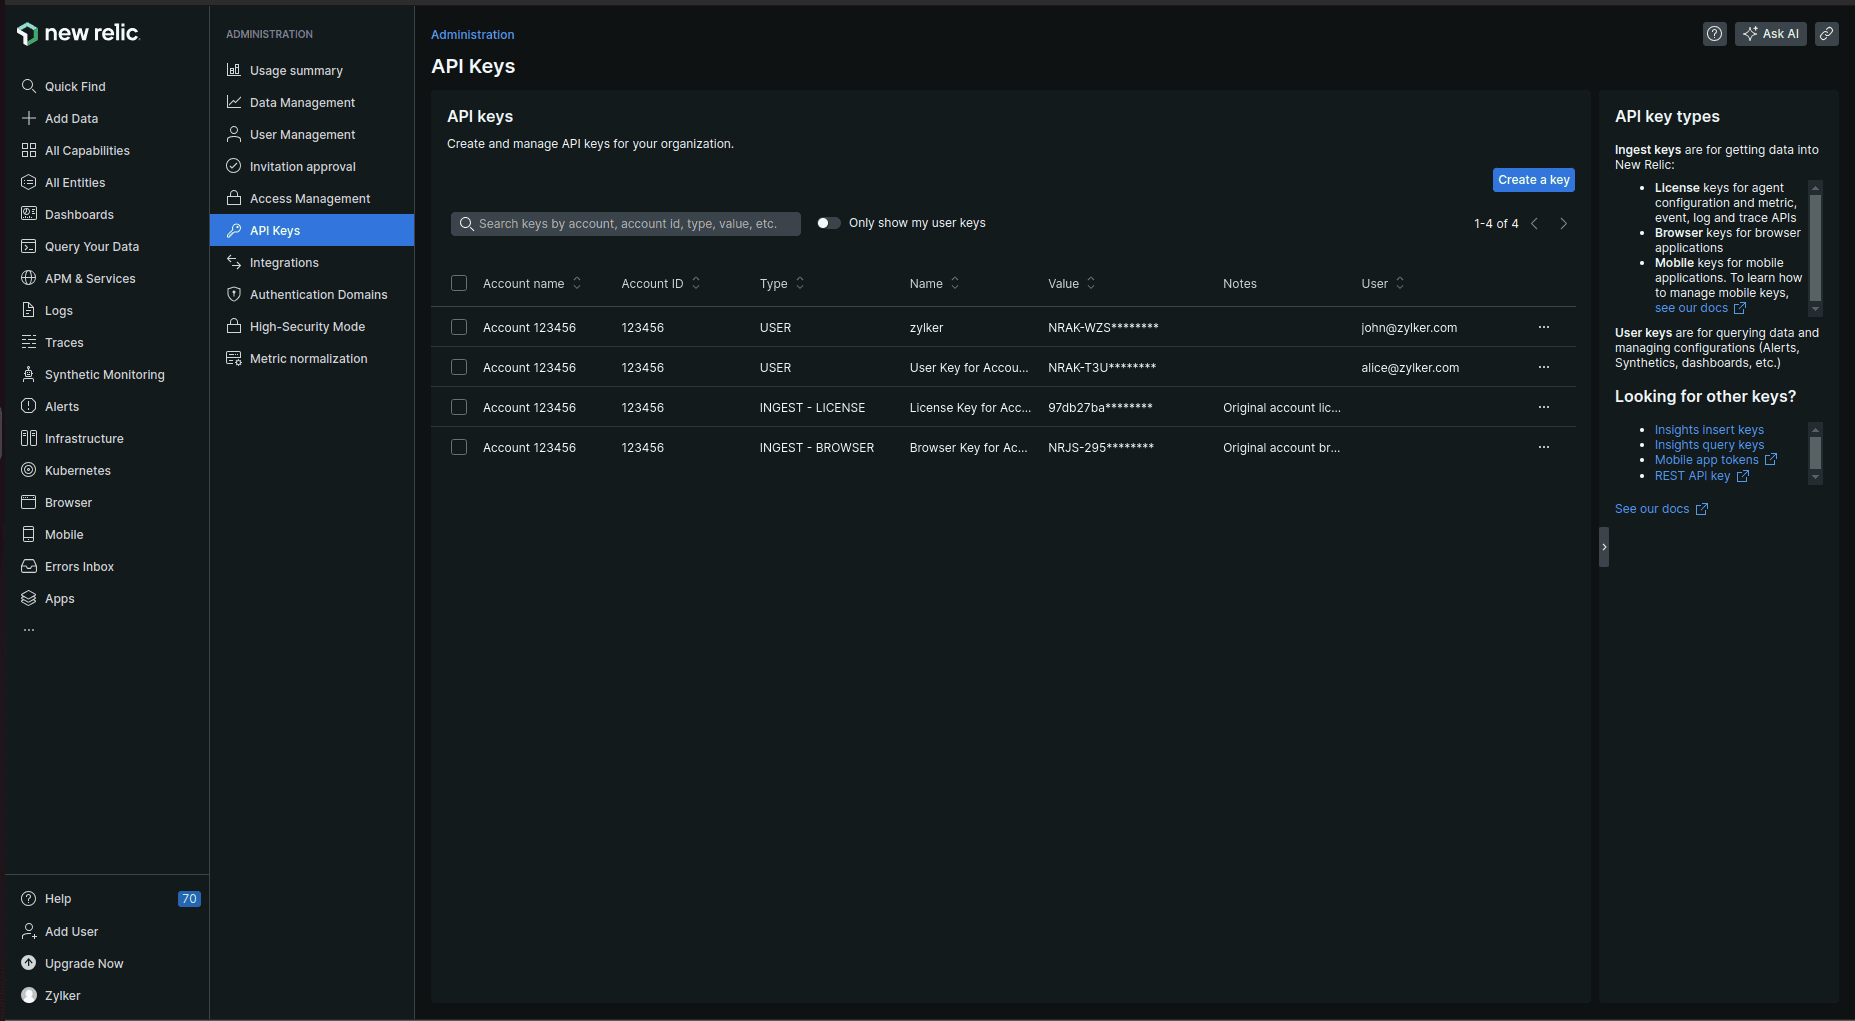
- Click Create a key on the API Keys page.
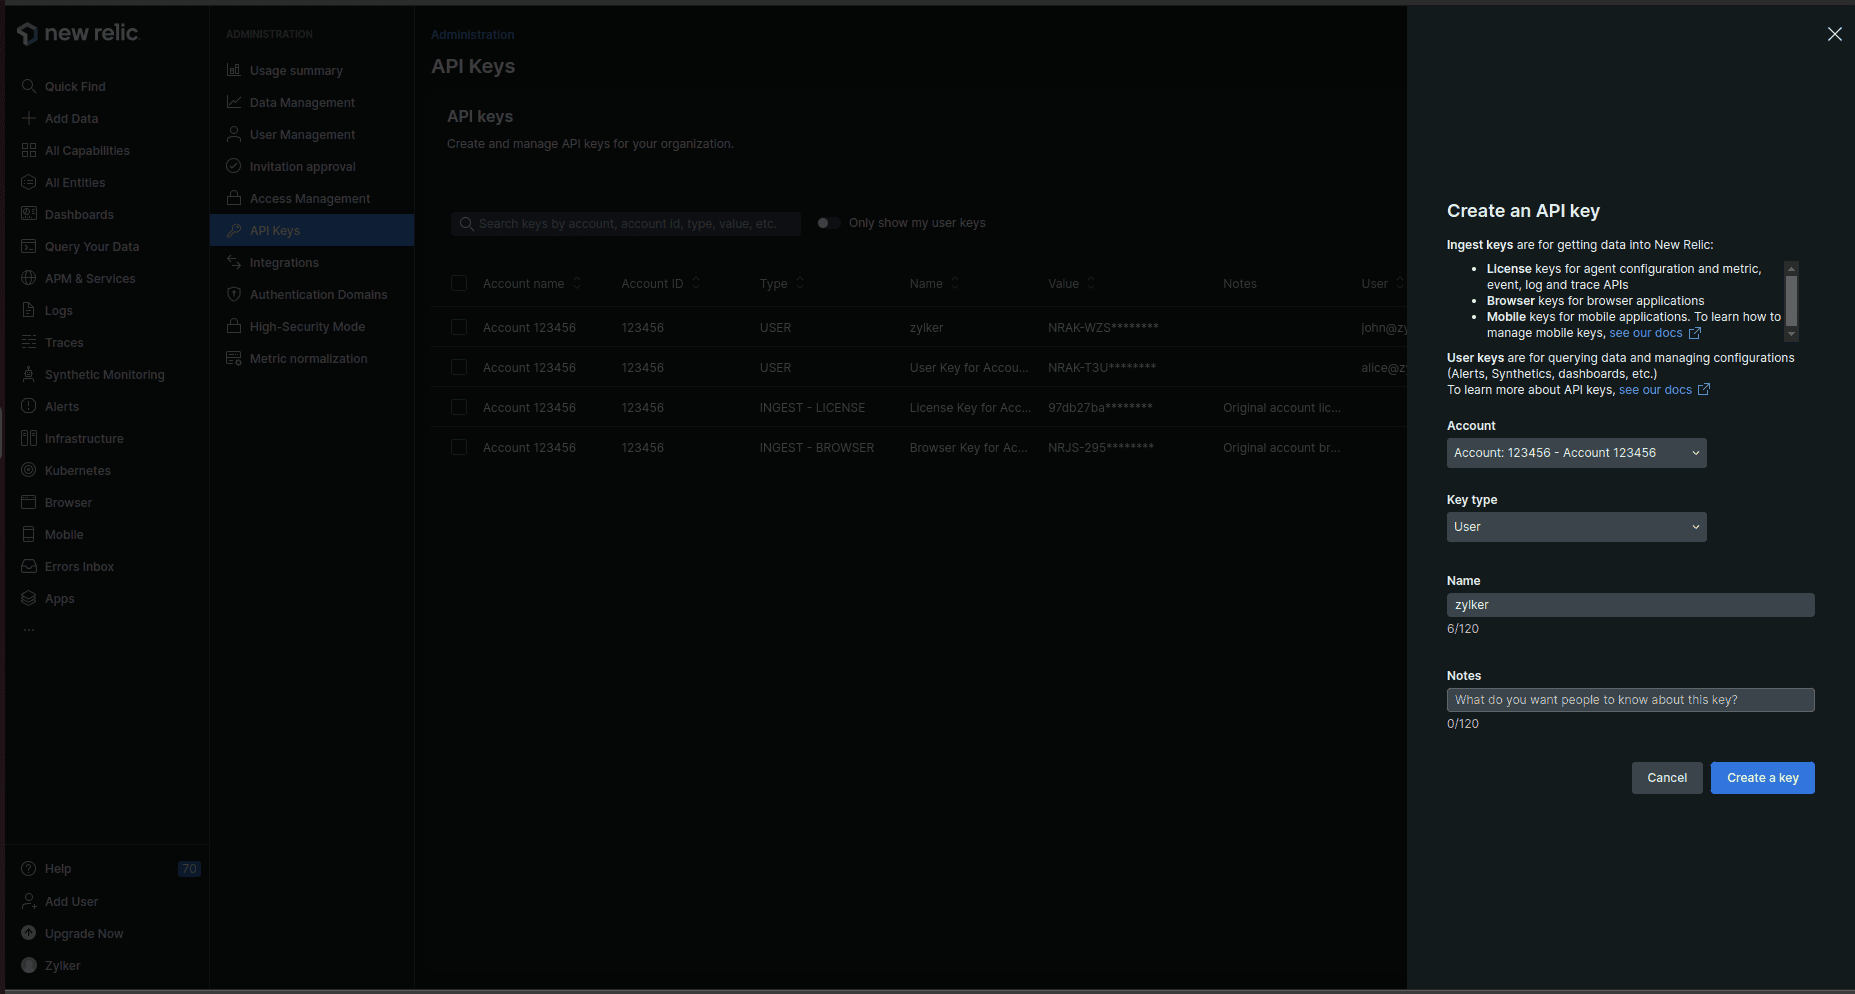
- In the side panel, select your Account, choose User as the Key type, and fill in the Name. The Notes field is optional. Click Create a key.
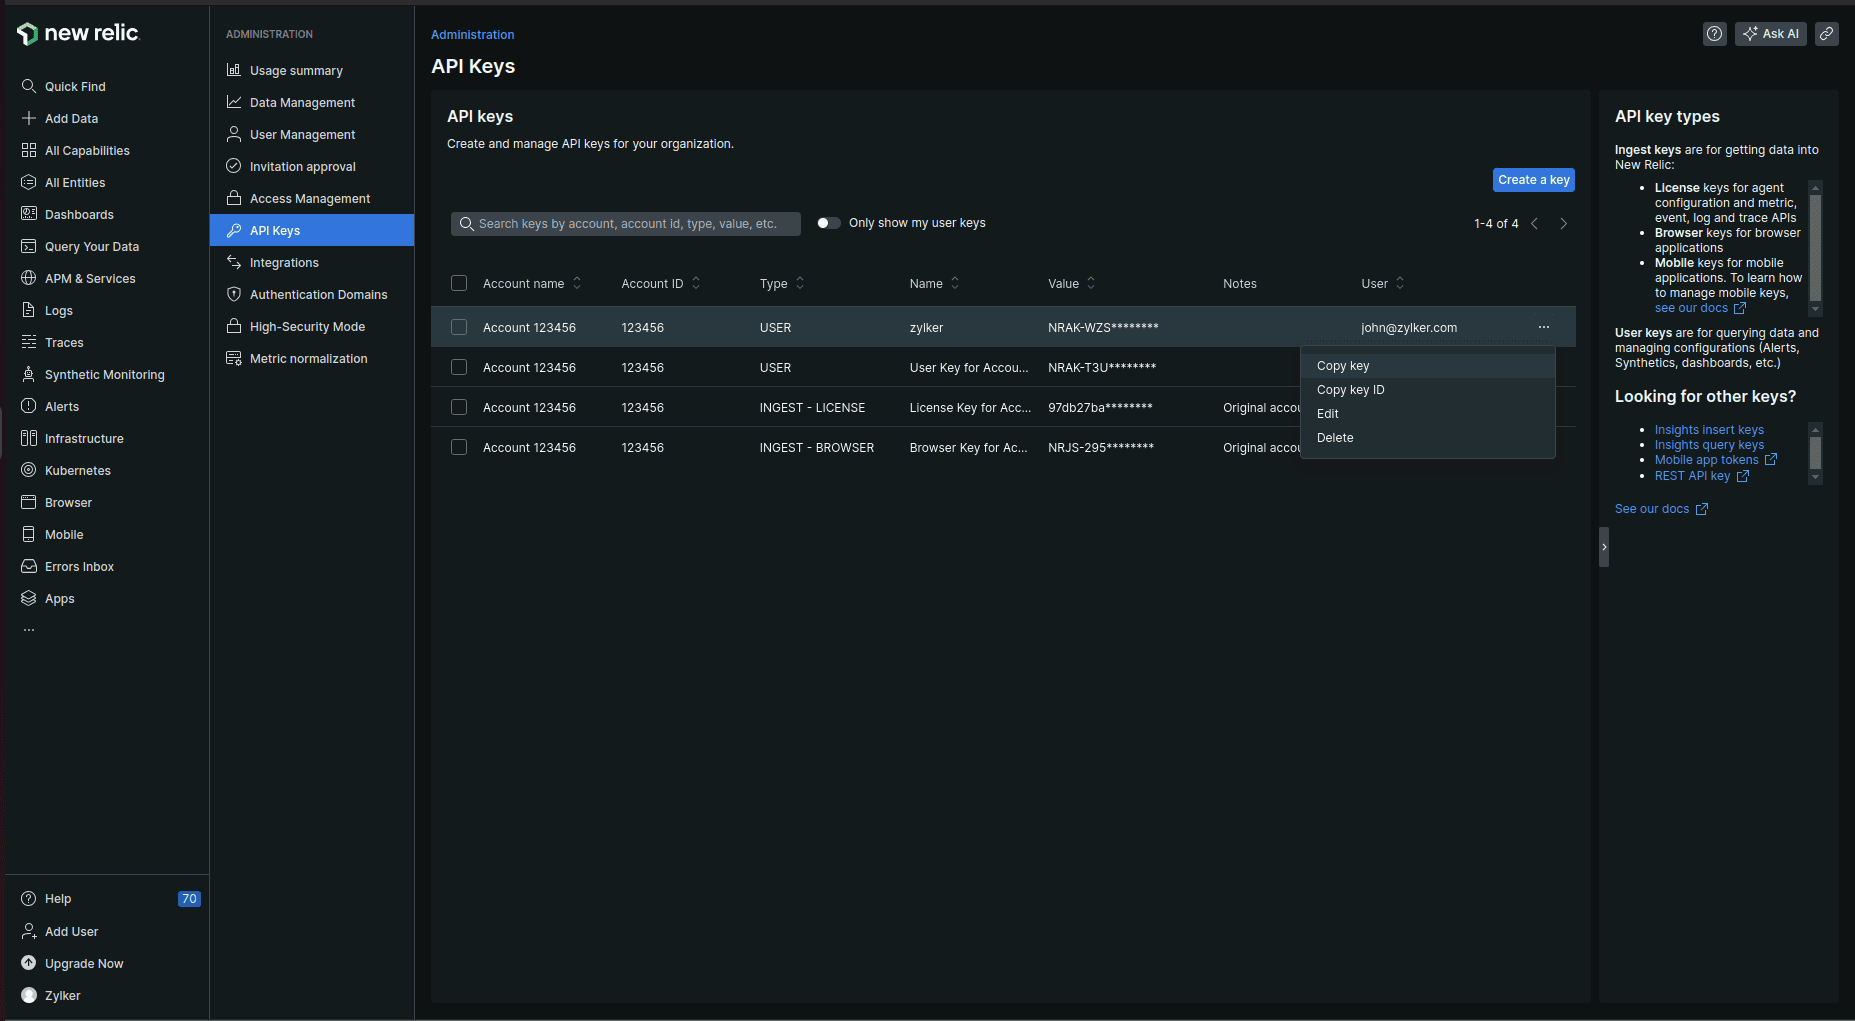
- Once done, on the API Keys page, click the hamburger icon at the end of your account panel and click Copy key.
- Setting up New Relic system metrics in StatusIQ
- Log in to StatusIQ.
- Go to Settings > System Metrics. Toggle to Third-Party Data Source.

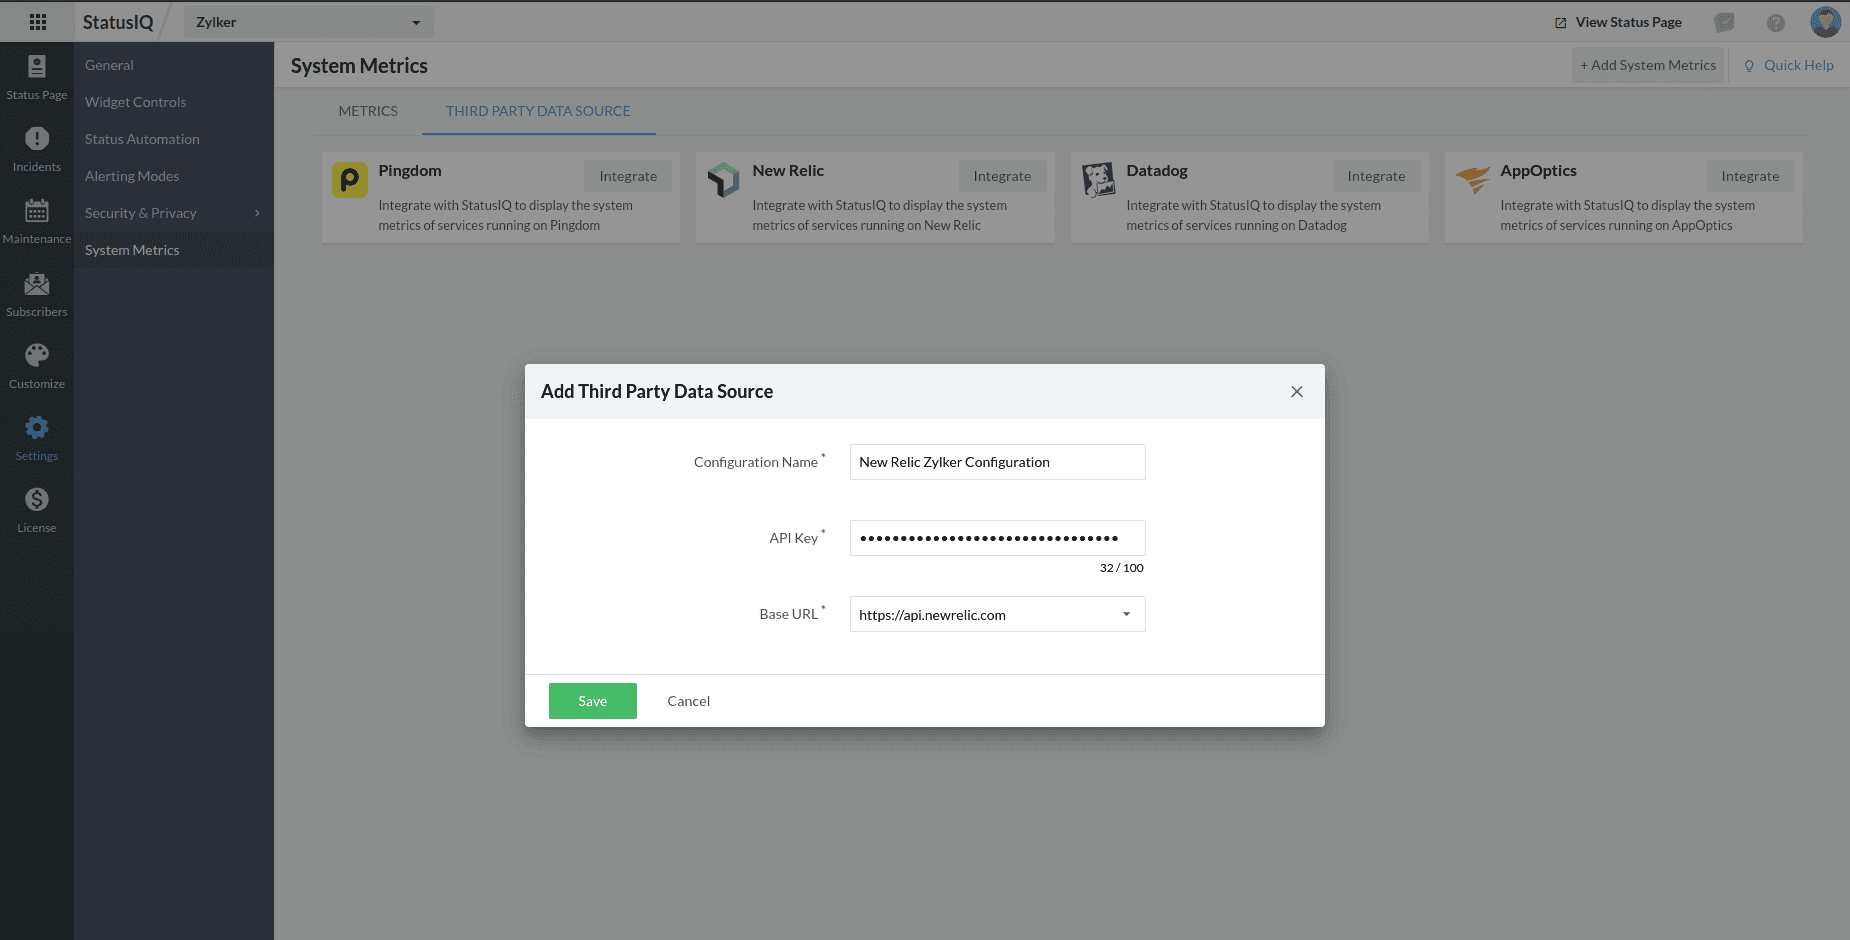
- Select New Relic. In the Add Third Party Data Source form, fill in the Configuration Name and paste the copied API key in the API key field. Select your Base URL and click Save.
- You will receive a confirmation pop-up. Click Proceed.
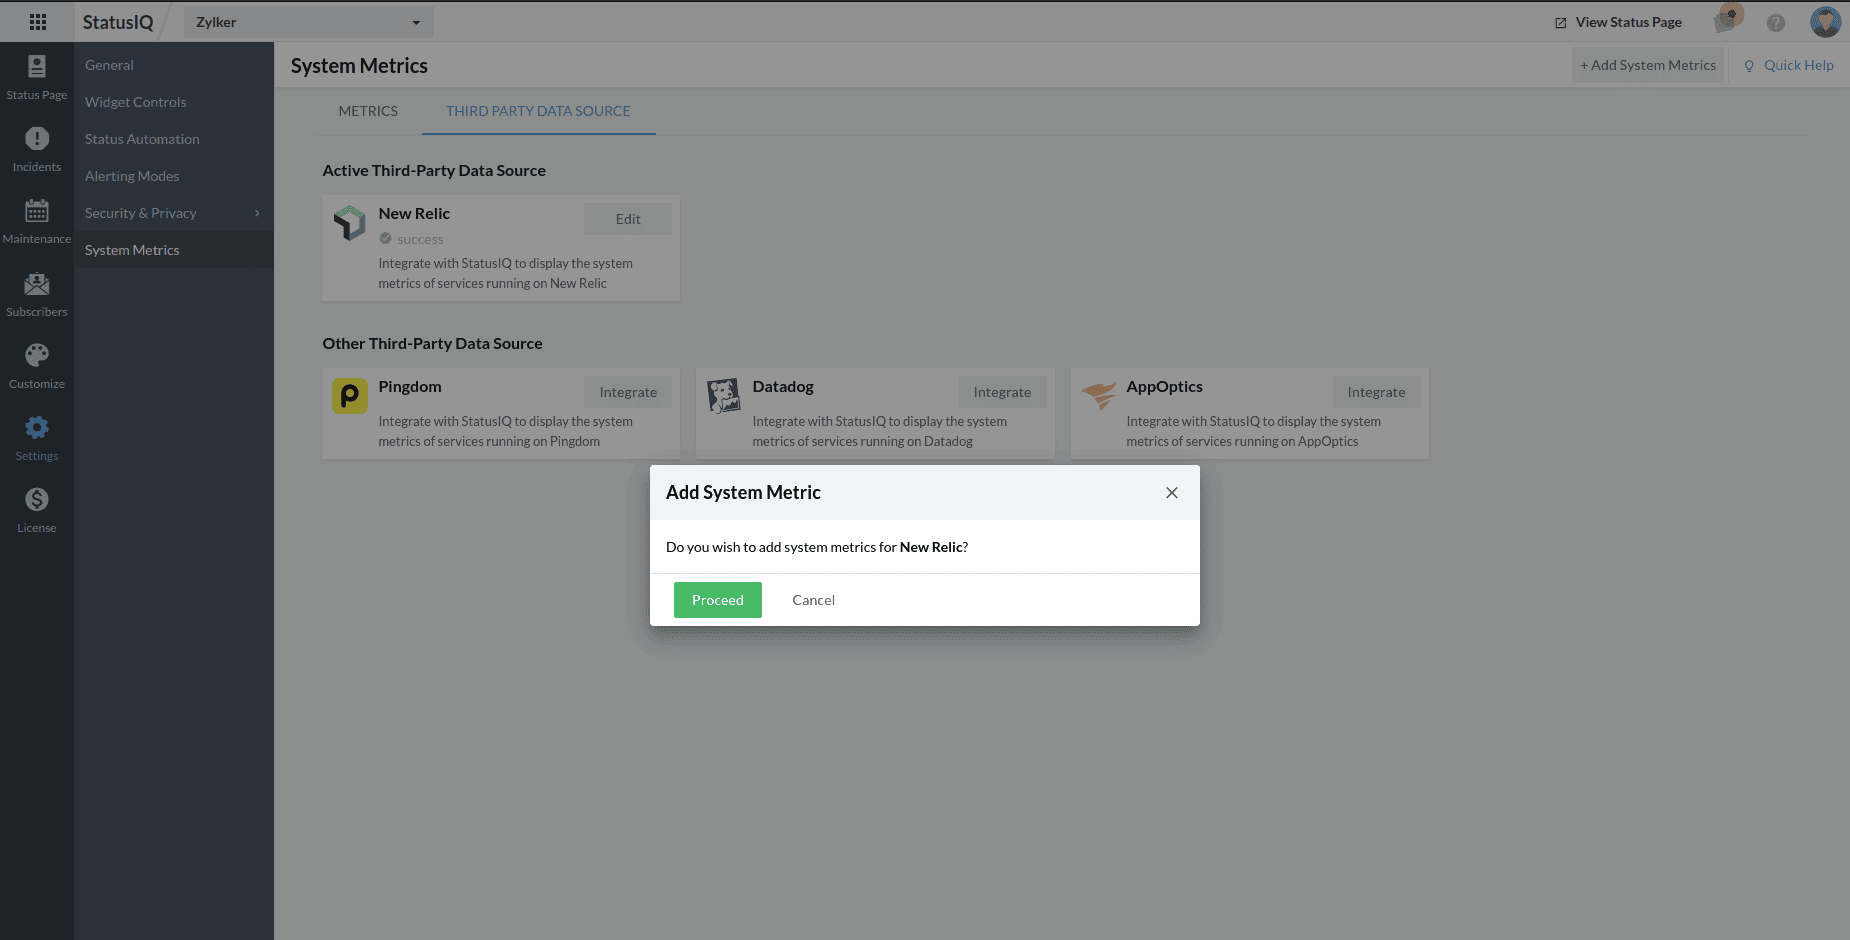
If you want to configure New Relic but prefer not to add system metrics at this time, click Cancel. If you wish to add system metrics, click Proceed and continue from the second step of the next section.
- How to get the API key from New Relic
-
How to add New Relic system metrics in StatusIQ after configuration
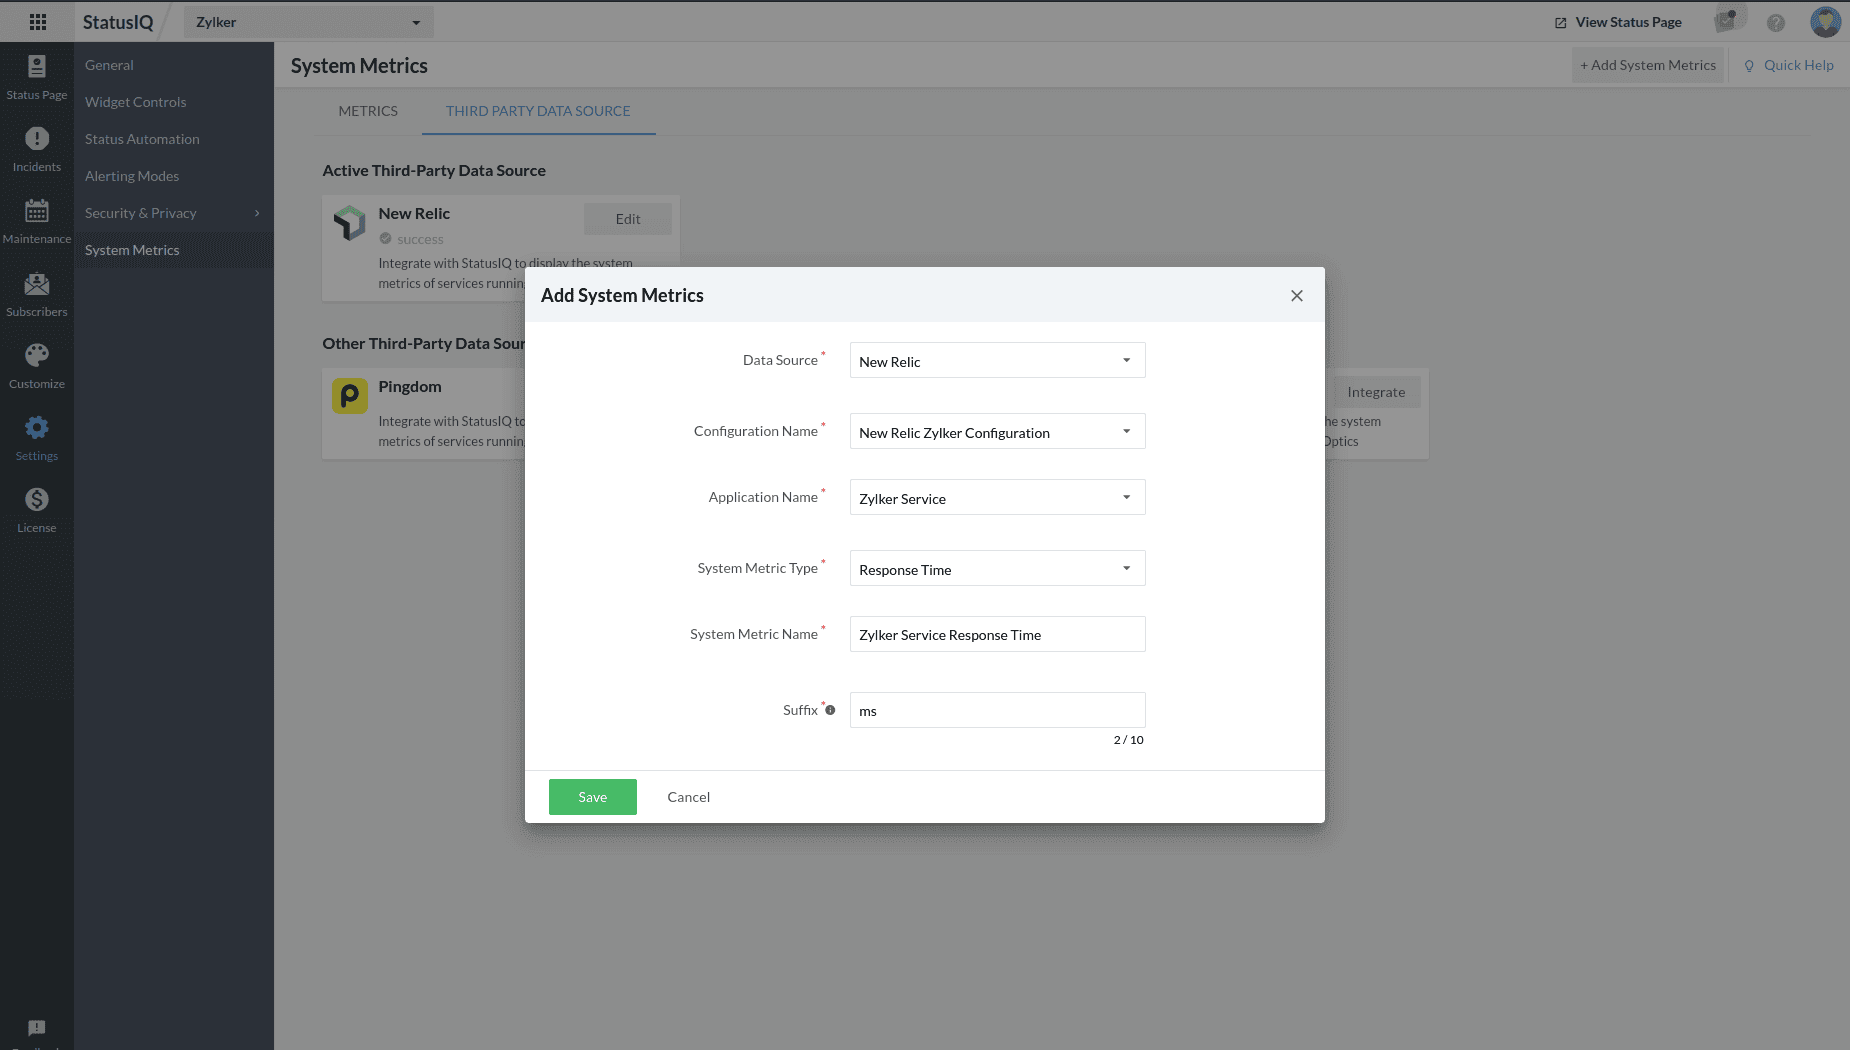
- In StatusIQ, go to Settings > System Metrics and click + Add System Metrics in the top band.
- You will now see the Add System Metrics form. Fill out the details and click Save.
- Now, on the Edit System Metric page, fill out the required details.
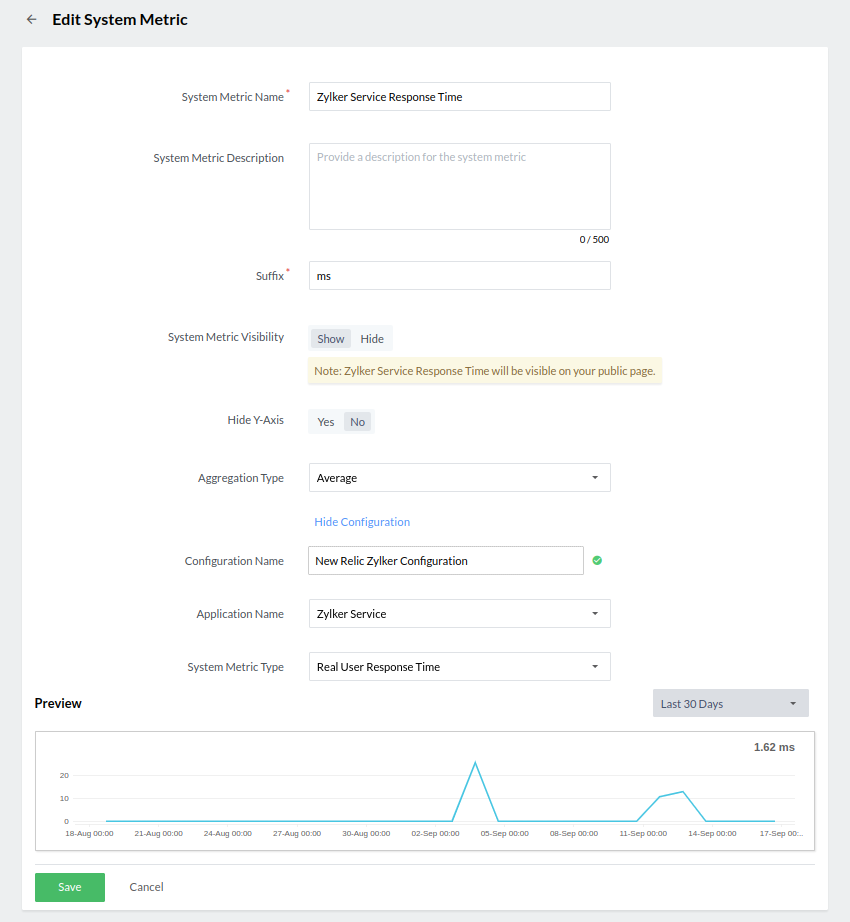
-
Click Set it to visible for the system metric to be displayed on the public page.
AppOptics
-
-
How to configure AppOptics in StatusIQ
- How to get the API key AppOptics
- Log in to AppOptics.
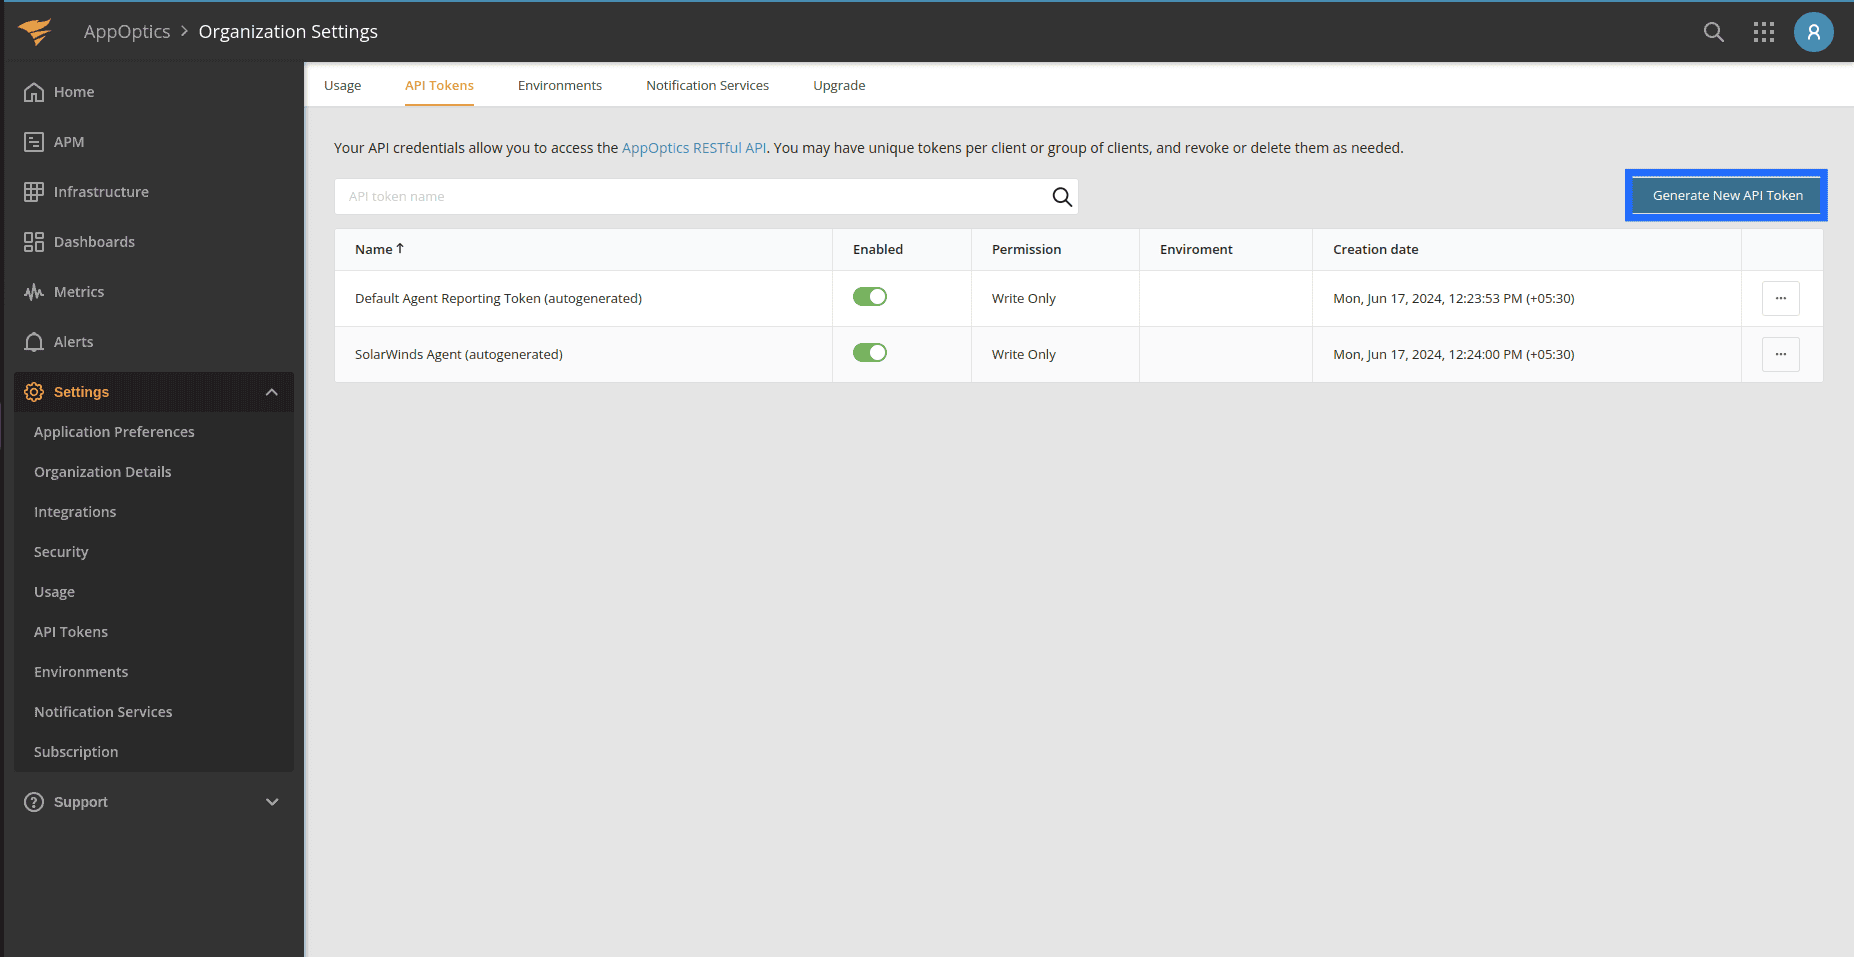
- Navigate to Settings > API Tokens. On the API Tokens page, click Generate New API Token.
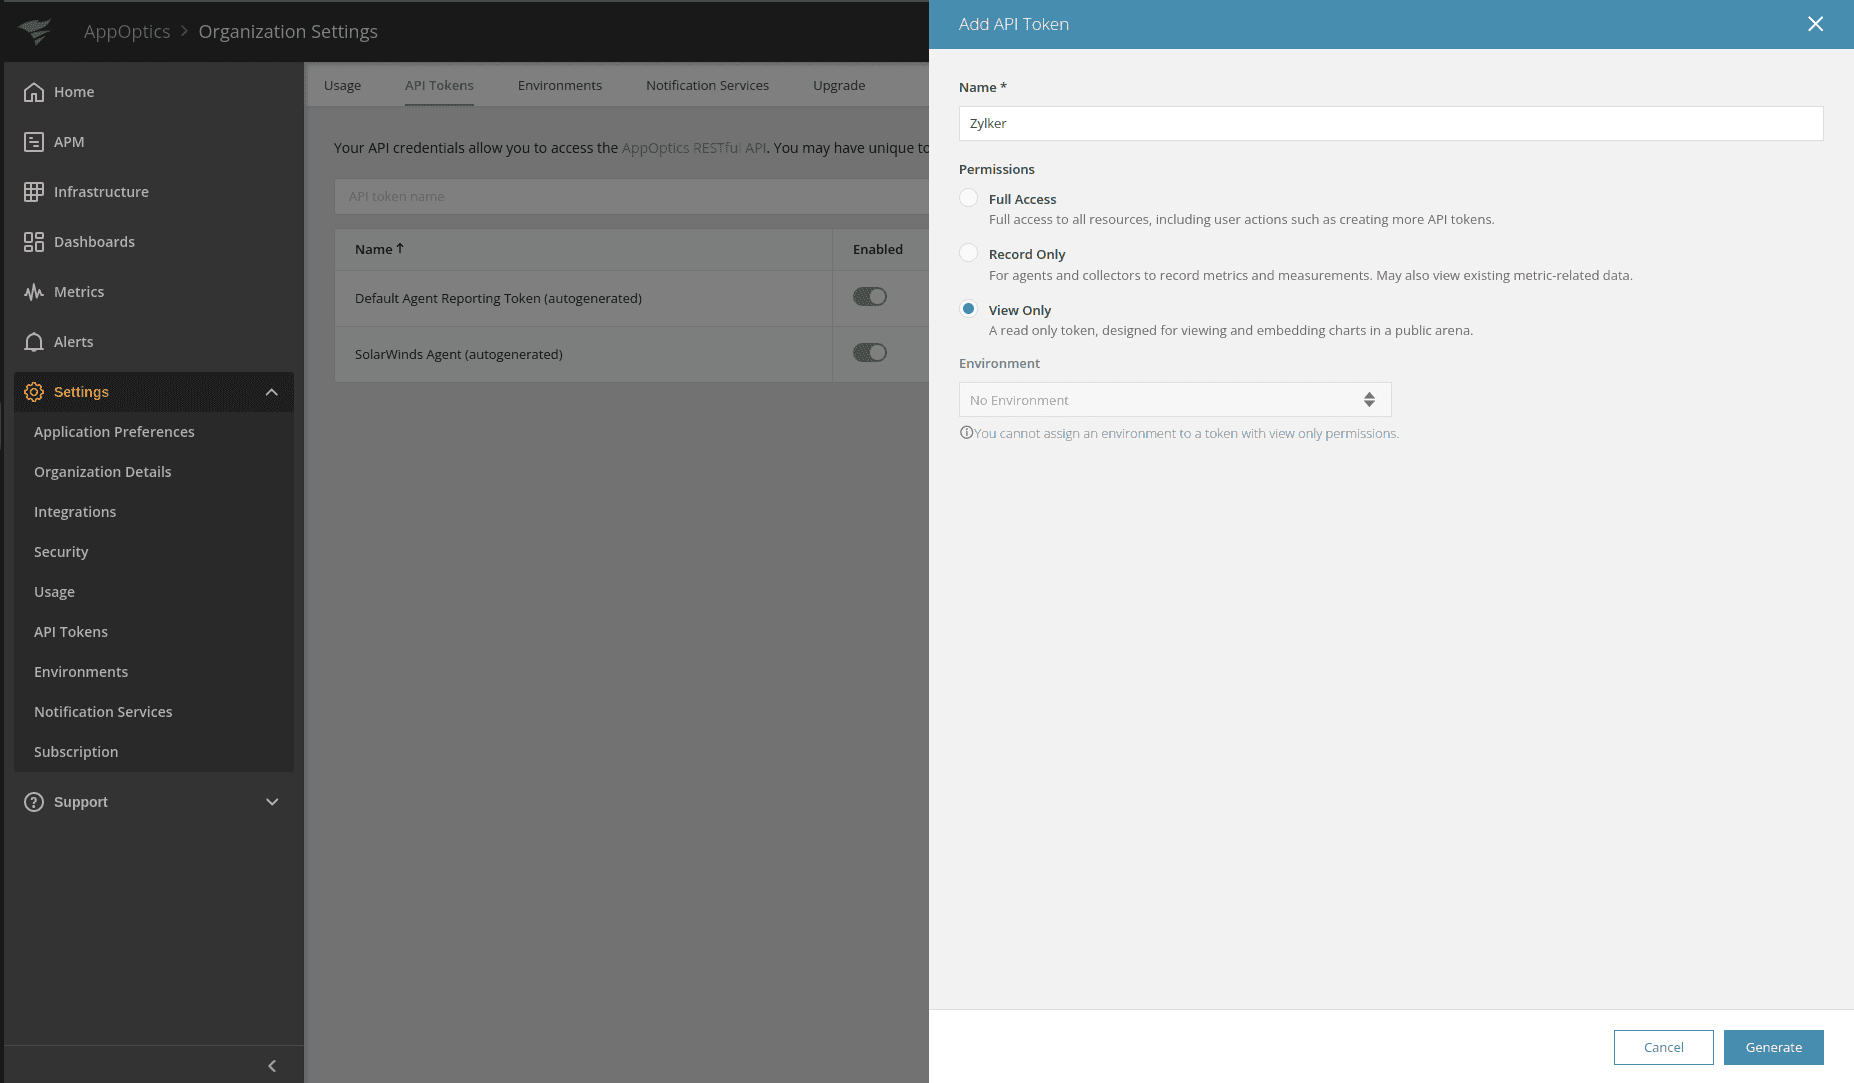
- You will now see the Add API token page. Provide a name, select View Only permissions, and click Generate.
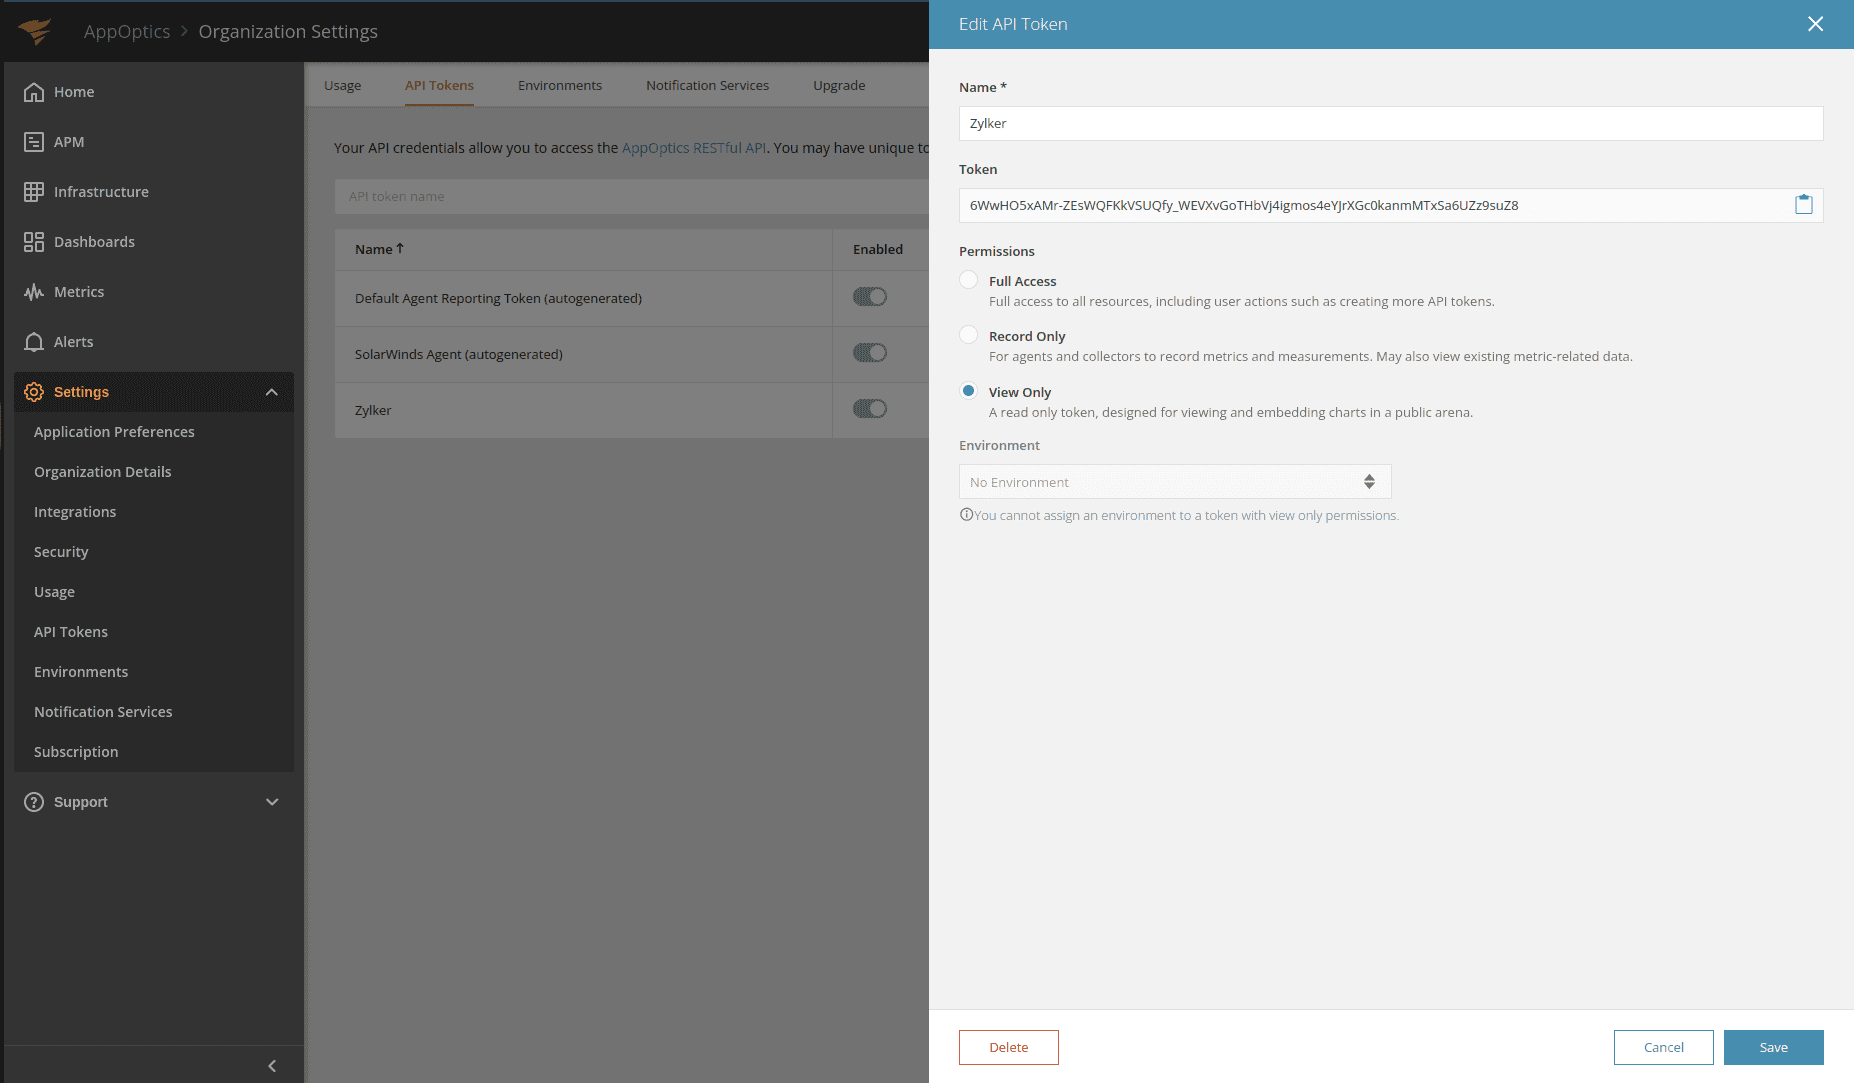
- Now, copy the generated token and click Save.
- Setting up AppOptics system metrics in StatusIQ
- Log in to StatusIQ.
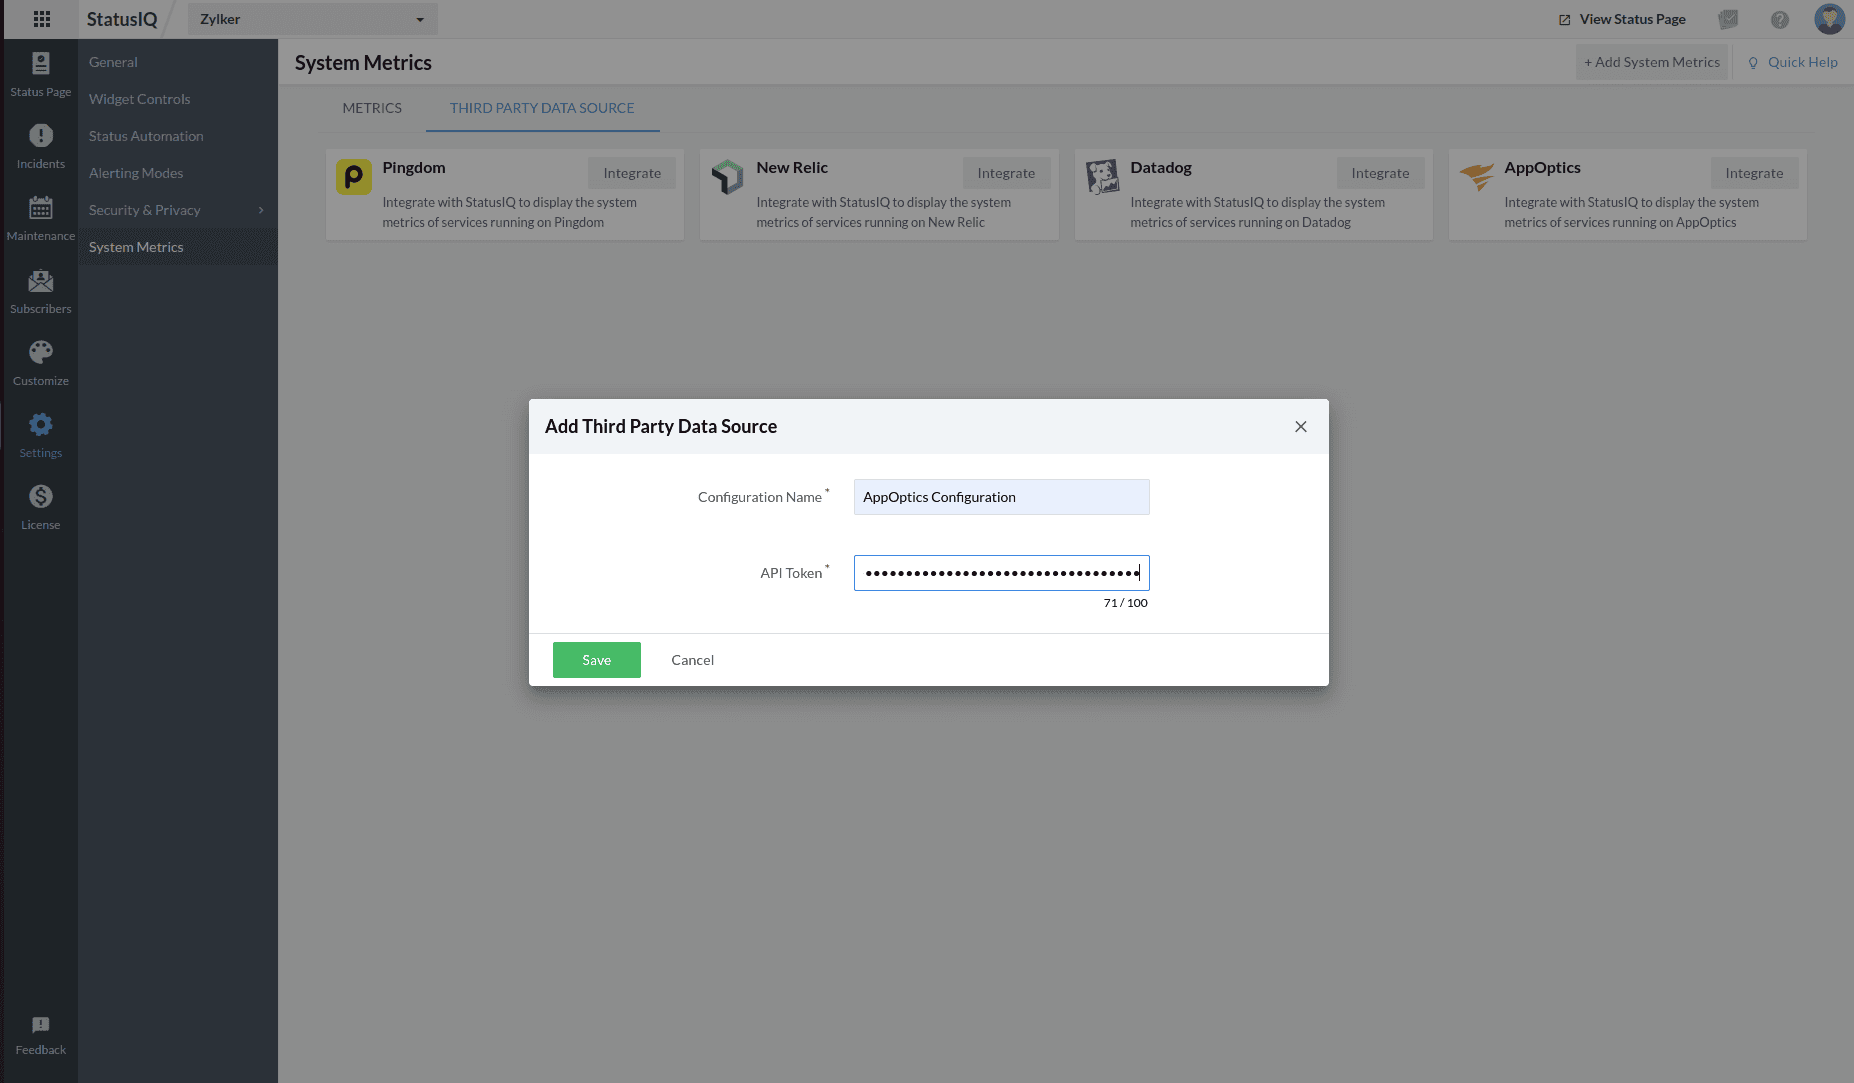
- Go to Settings > System Metrics. Toggle to Third-Party Data Source.

- Select AppOptics. In the add Third Party Data Source form, fill in the Configuration Name and paste the copied API token in the API Token field.
- In the confirmation pop-up, click Proceed.
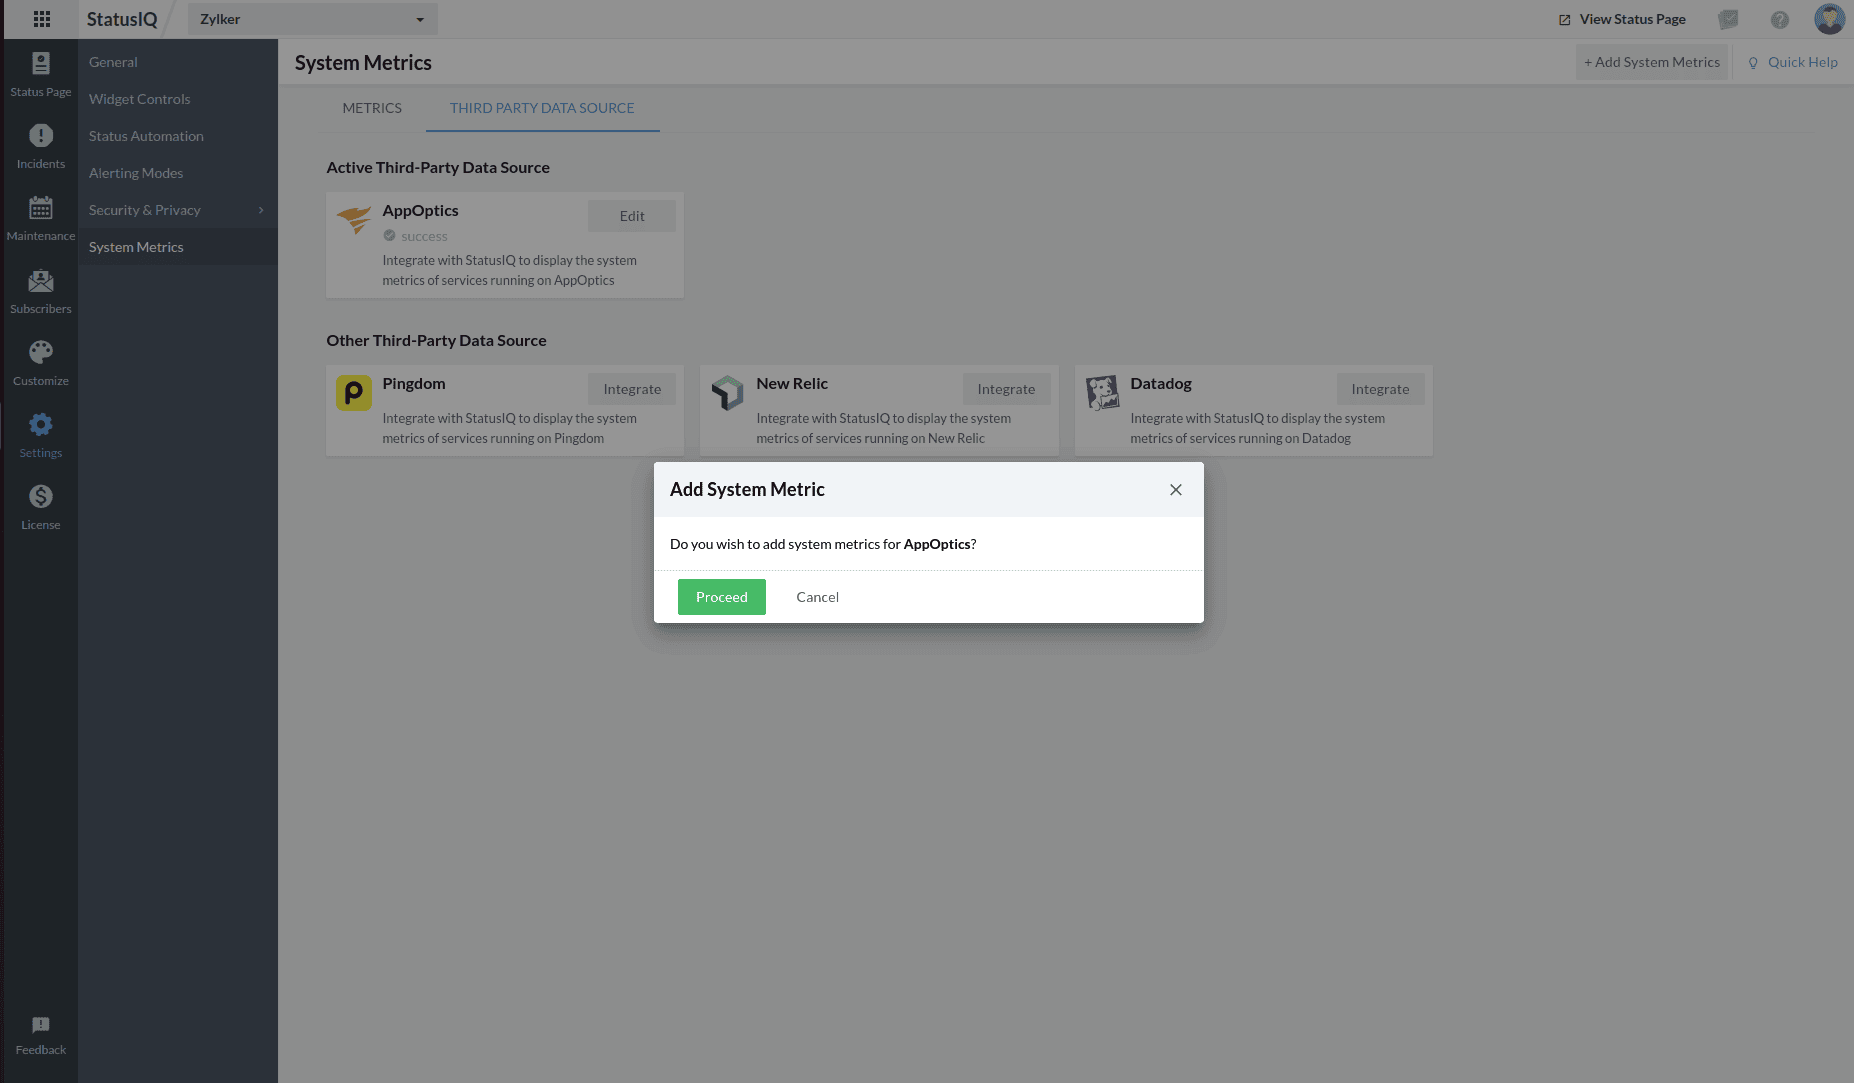
If you want to configure AppOptics but prefer not to add system metrics at this time, click Cancel. If you wish to add system metrics, click Proceed and continue from the second step of the next section.
- How to get the API key AppOptics
-
How to add AppOptics system metrics in StatusIQ after configuration
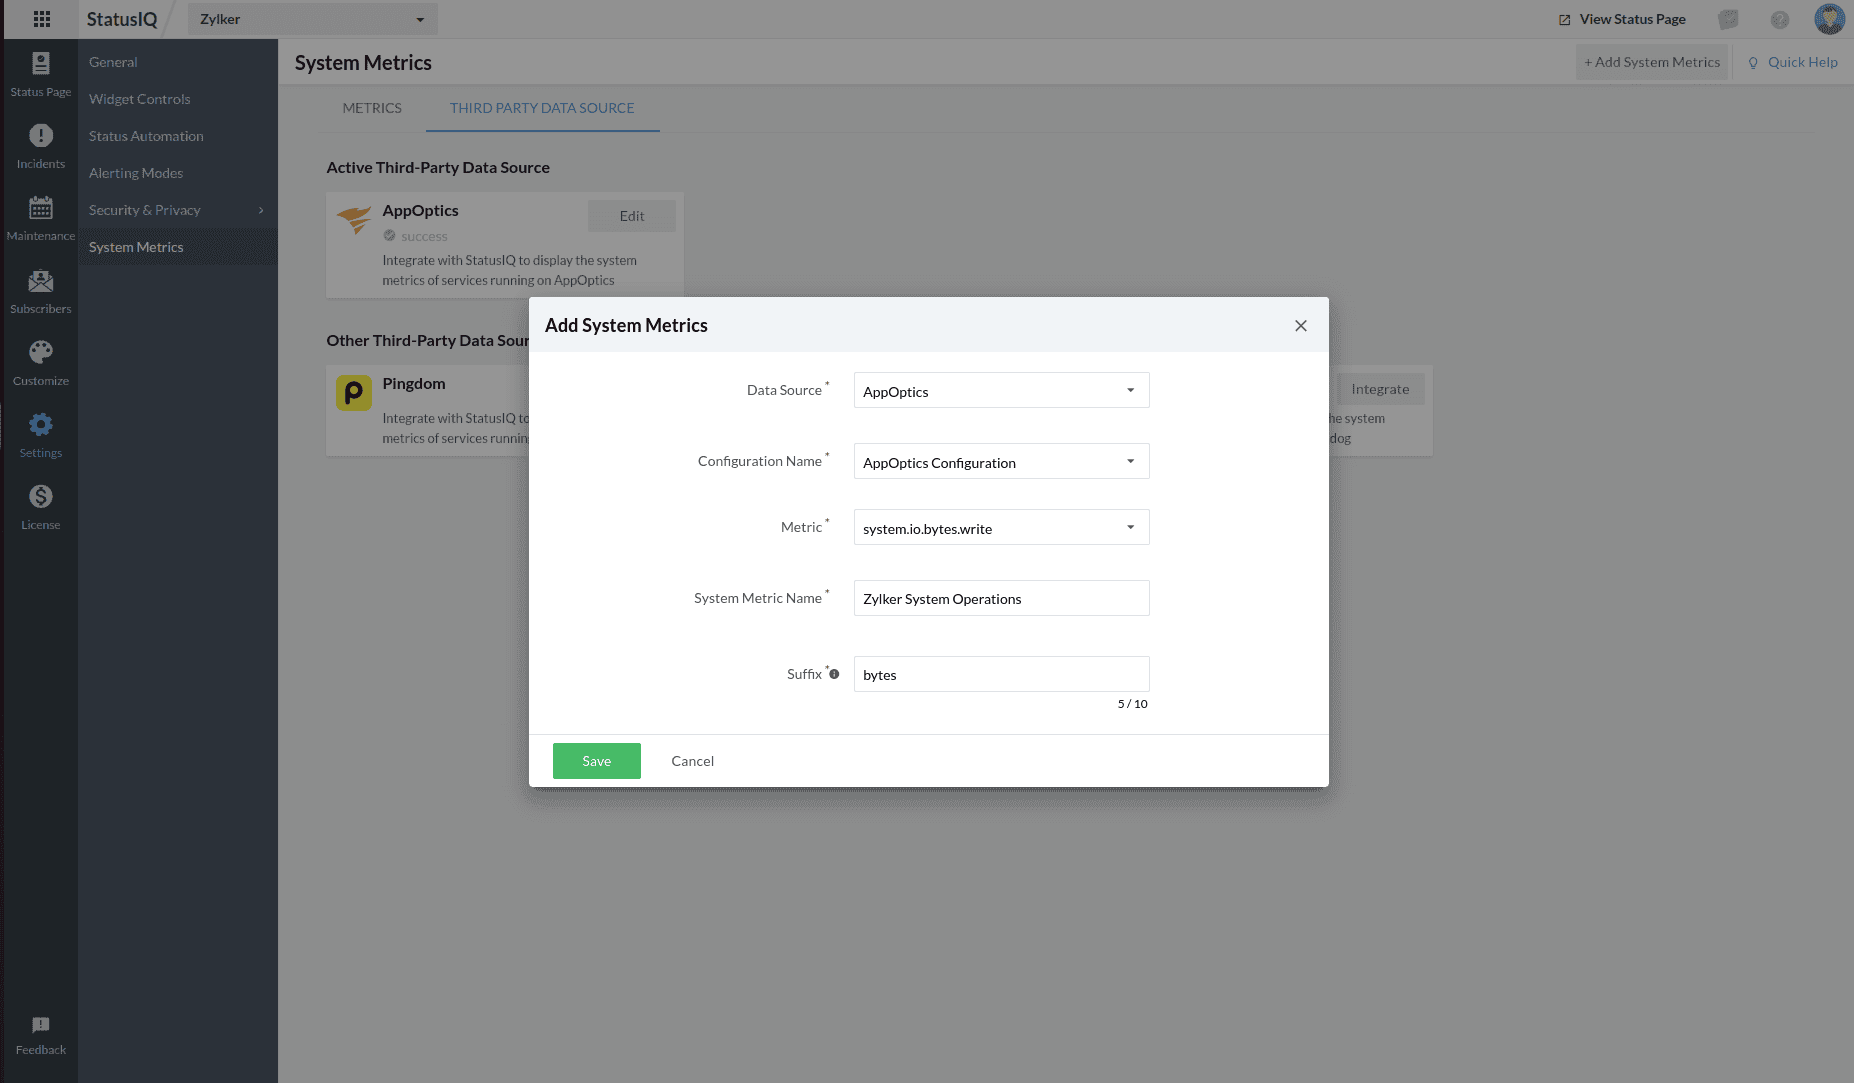
- In StatusIQ, go to Settings > System Metrics and click + Add System Metrics in the top band as shown below.

- In the Add System Metrics form, fill out the details and click Save.
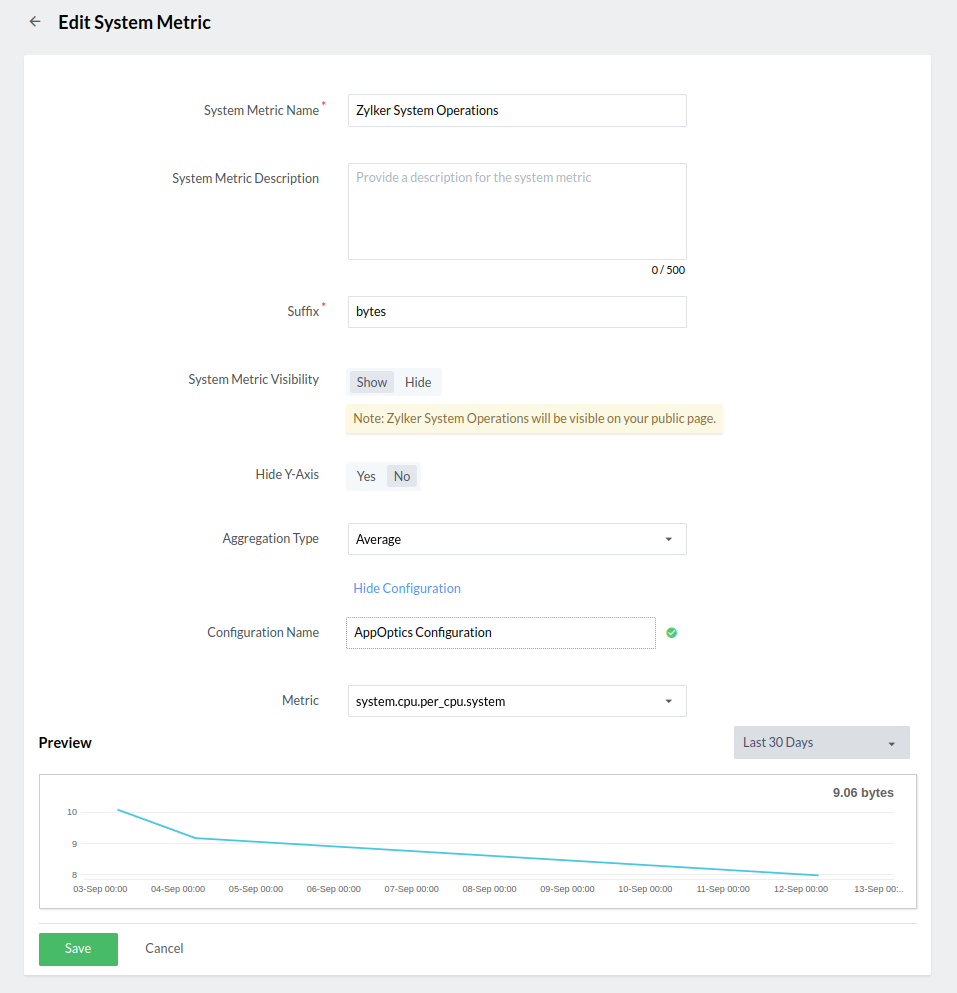
- Now, on the Edit System Metric page, fill out the required details.
- In StatusIQ, go to Settings > System Metrics and click + Add System Metrics in the top band as shown below.
-
Click Set it to visible for the system metric to be displayed on the public page.
Datadog
-
-
How to configure Datadog in StatusIQ
- How to get the API key from Datadog
- Log in to Datadog.
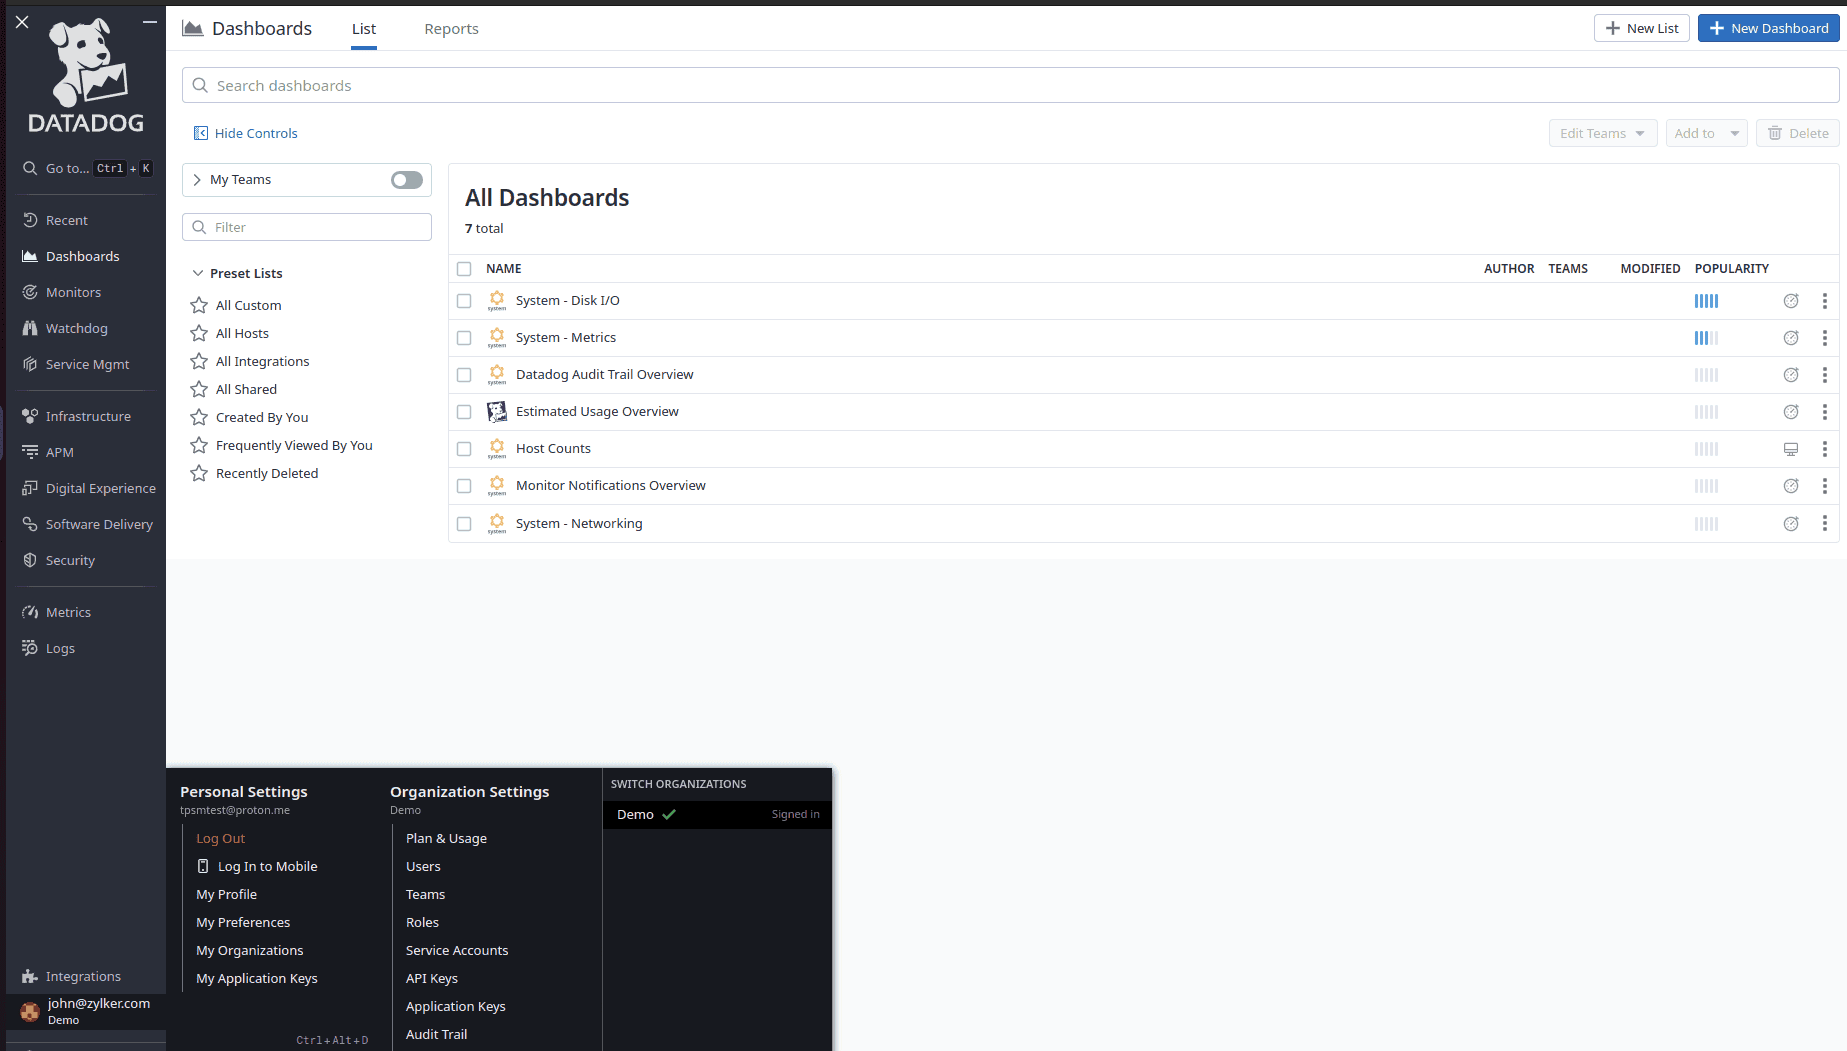
- Click your profile in the bottom-left corner, navigate to Organizational Settings, and select API Keys.

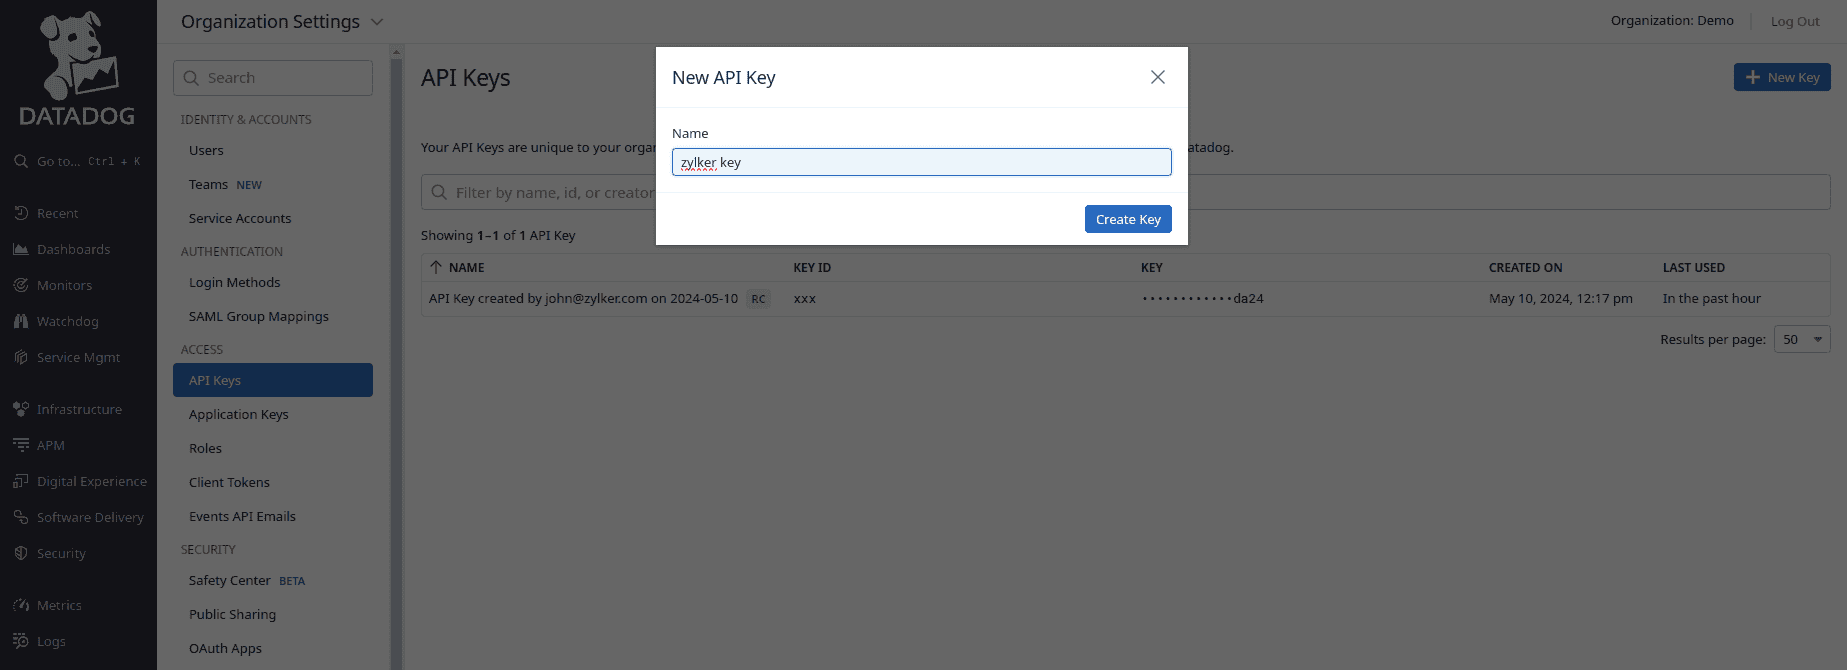
- On the API Keys page, click + New Key in the top-right corner.
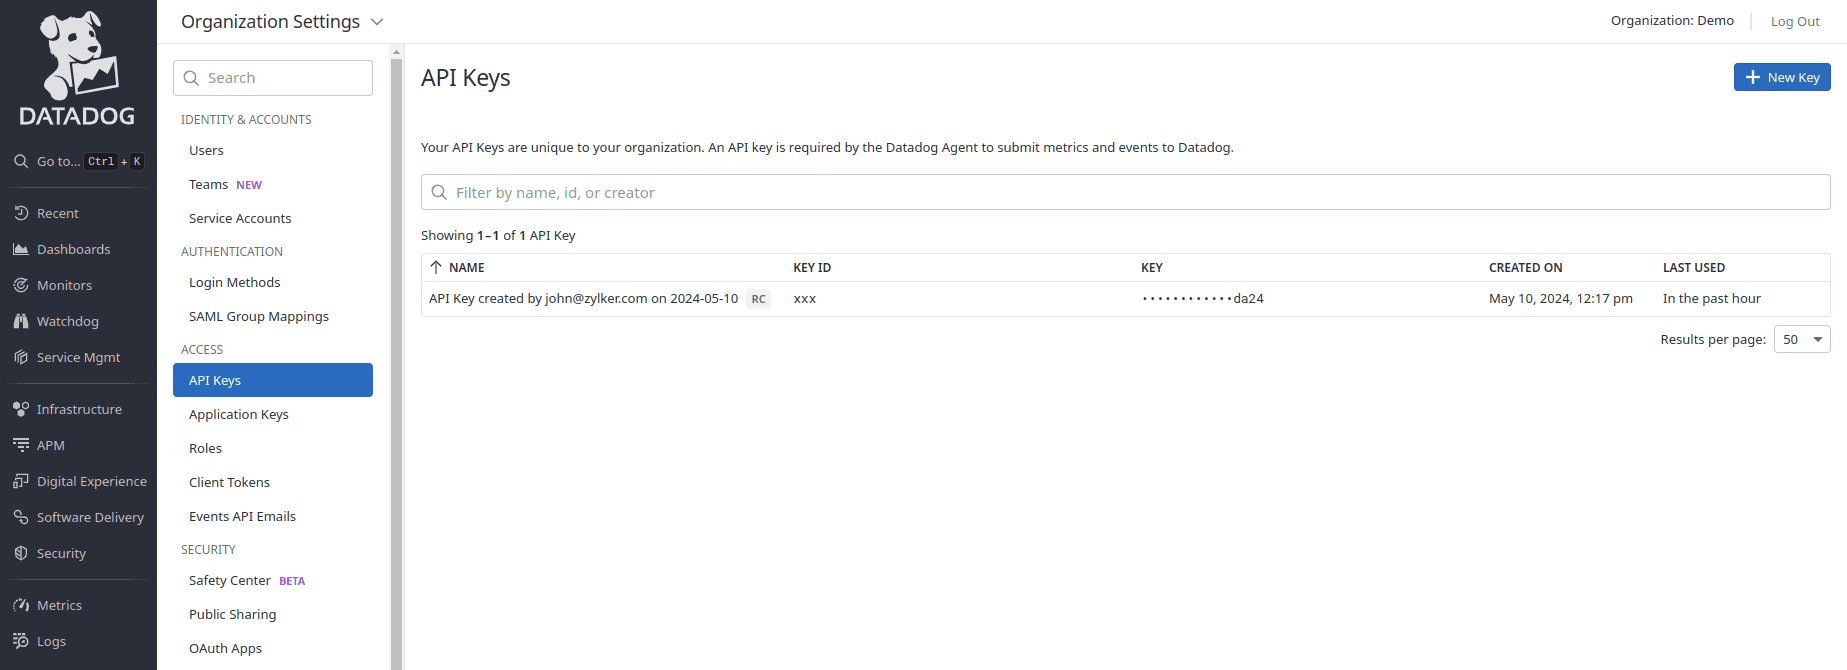
- Provide a name and click Create Key.
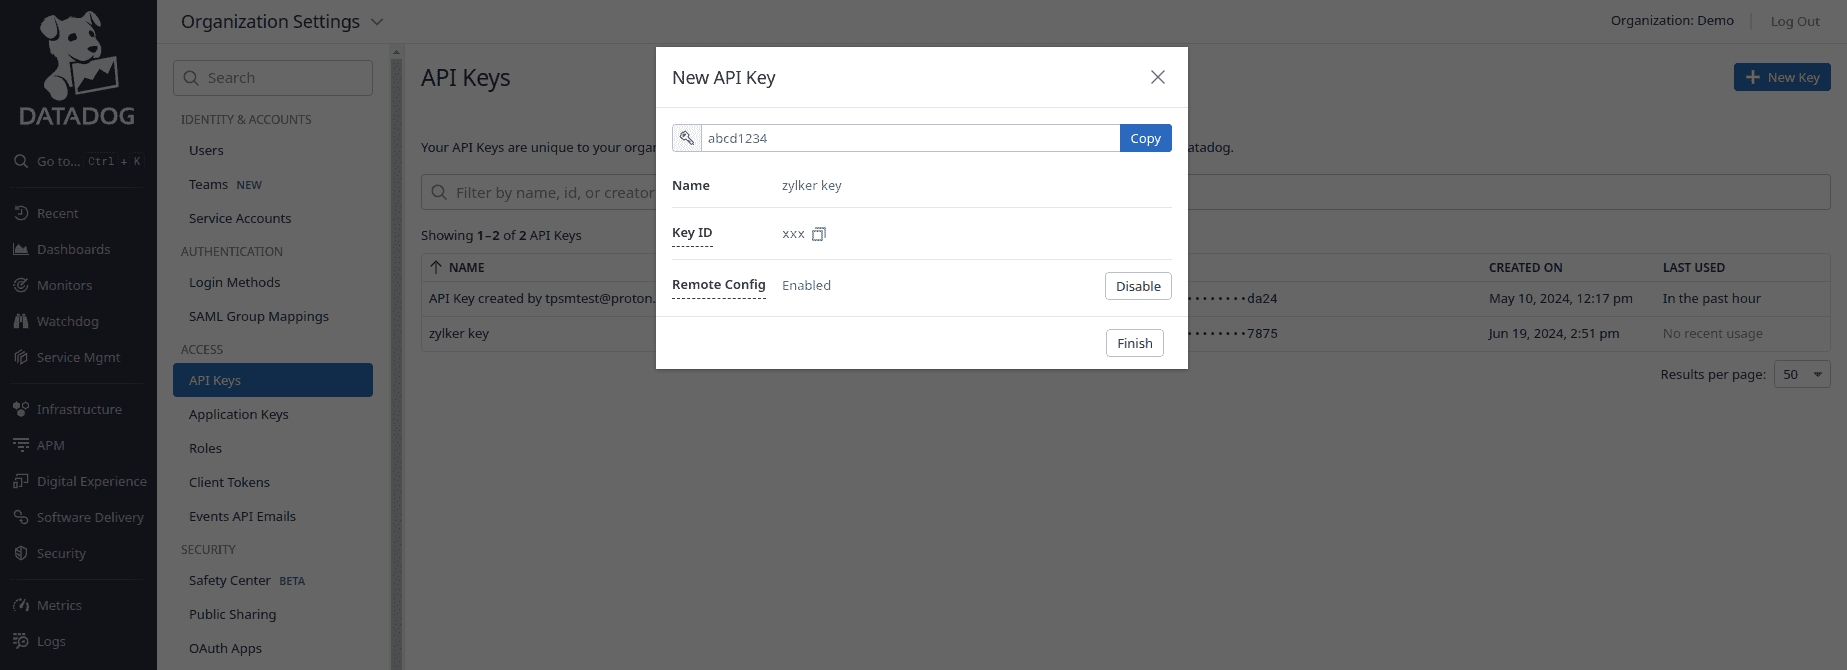
- Copy the generated API key and click Finish.
- How to get an application key from Datadog
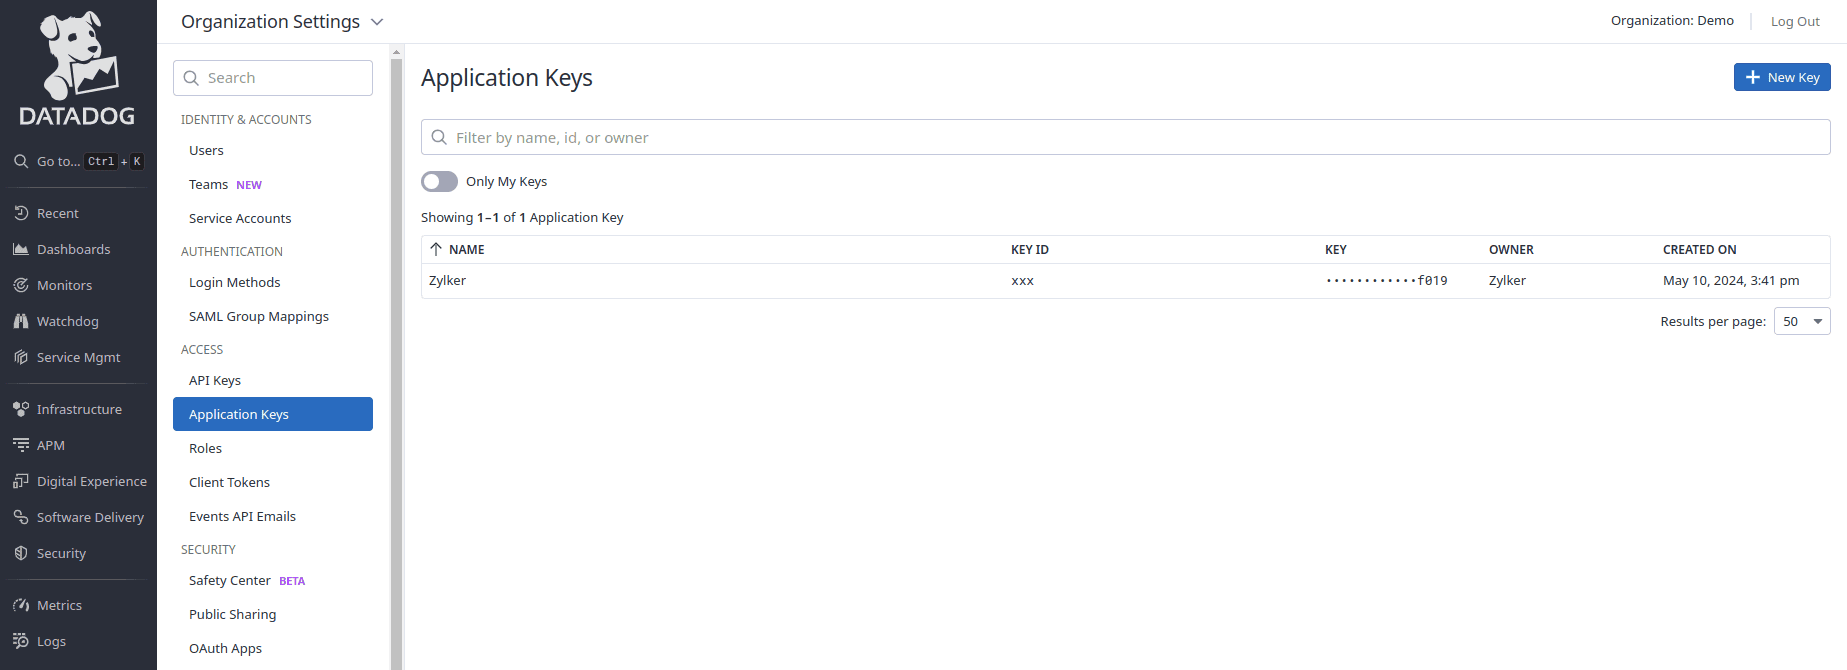
- Click your profile in the bottom-left corner, navigate to Organizational Settings, and select Application Keys.
- On the Application Keys page, click + New Key in the top-right corner of the page.
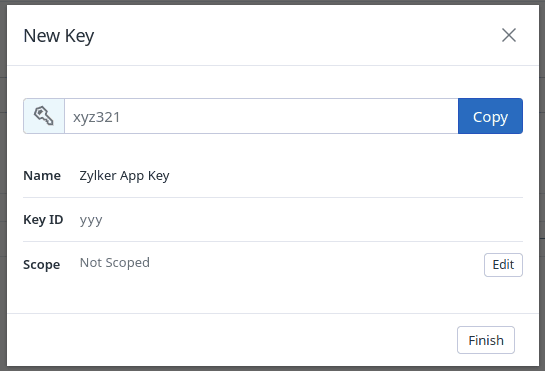
- Provide a name and click Create Key.
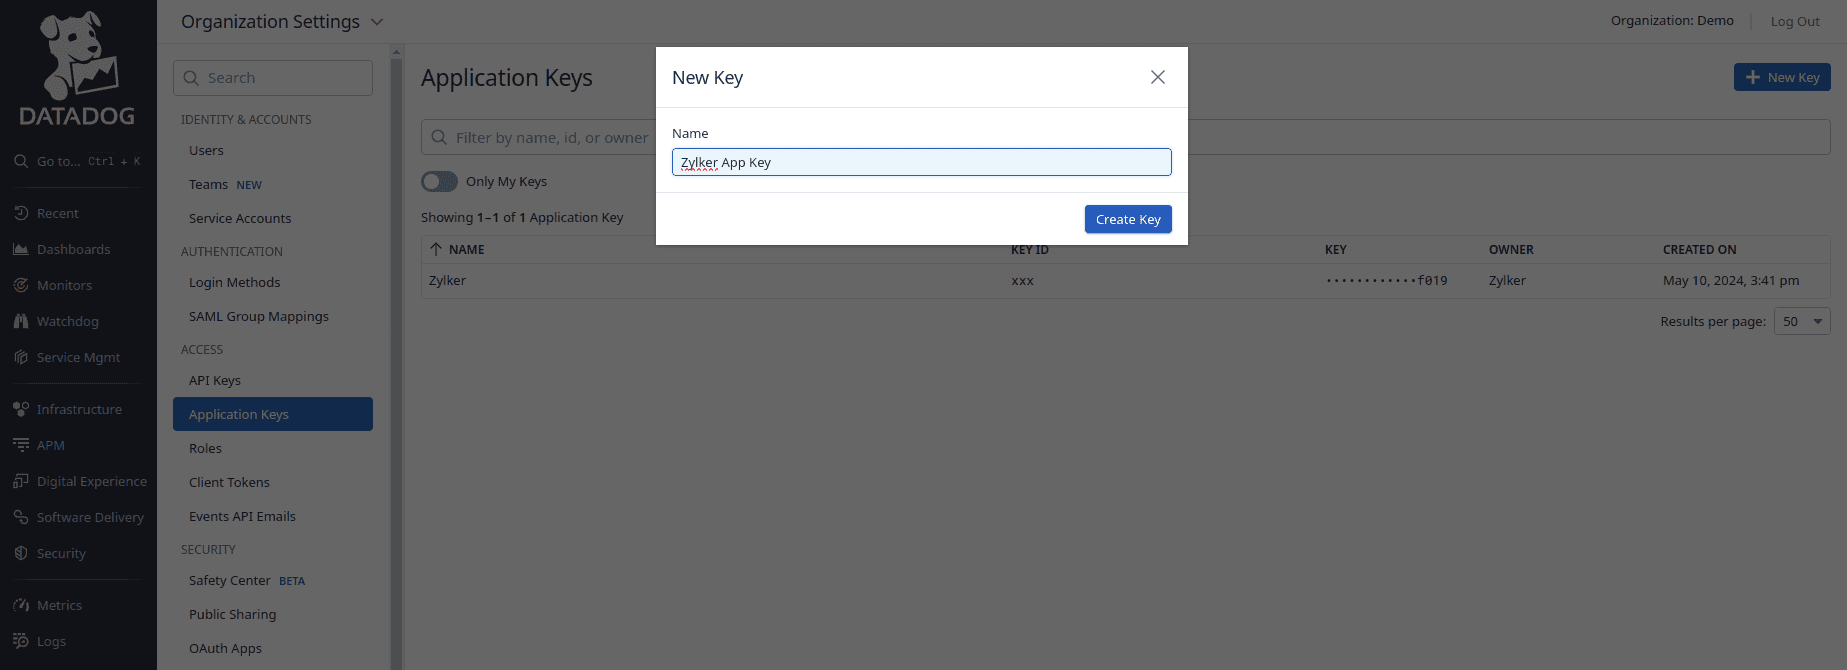
- Copy the generated application key and click Finish.
- Click your profile in the bottom-left corner, navigate to Organizational Settings, and select Application Keys.
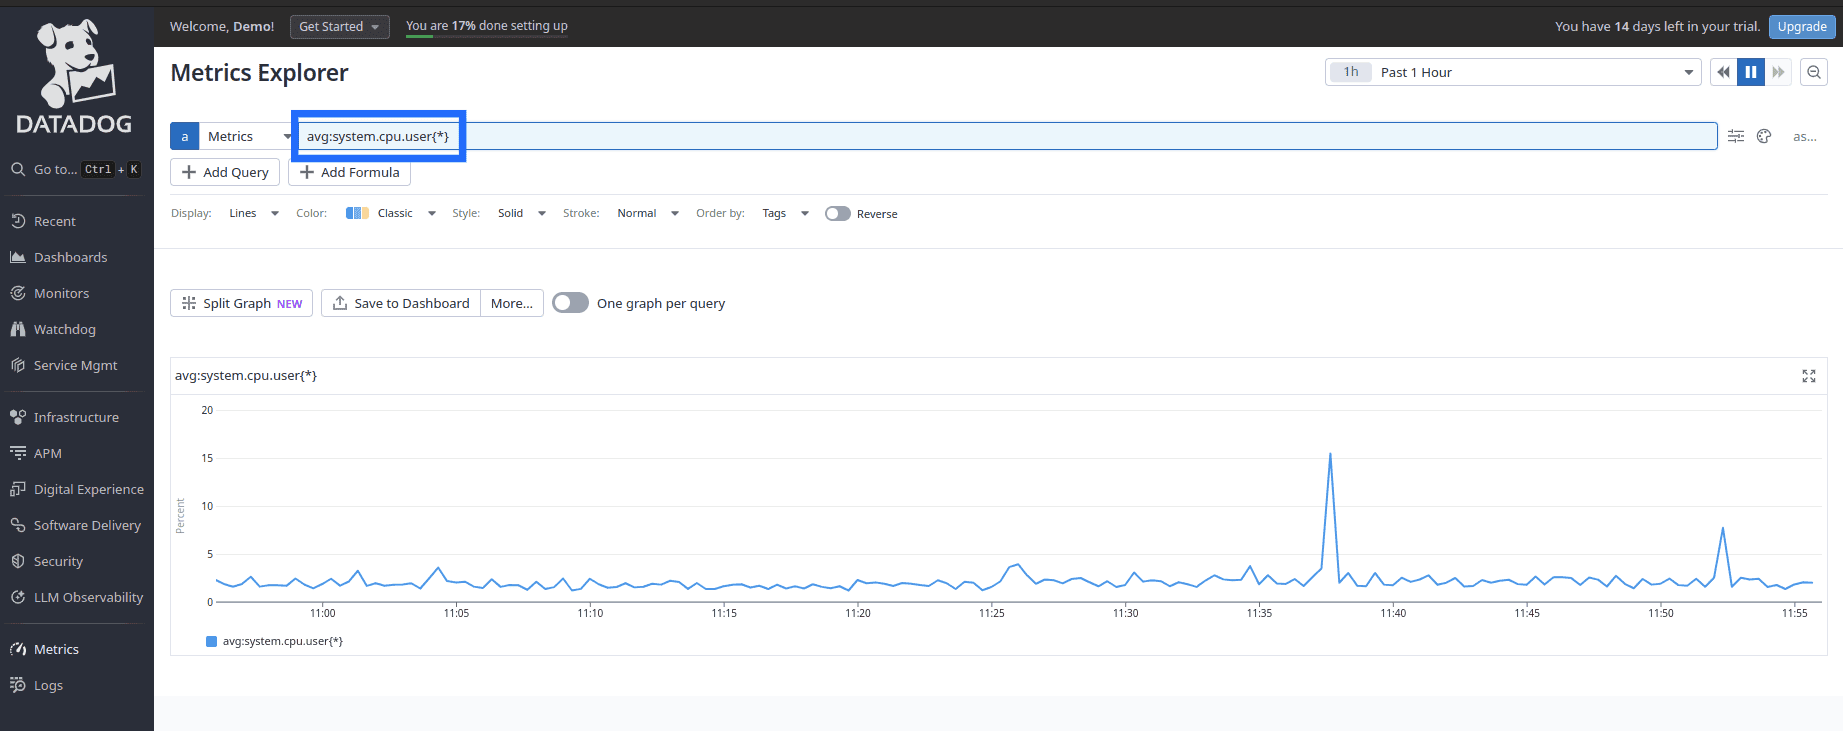
- How to get a query from Datadog
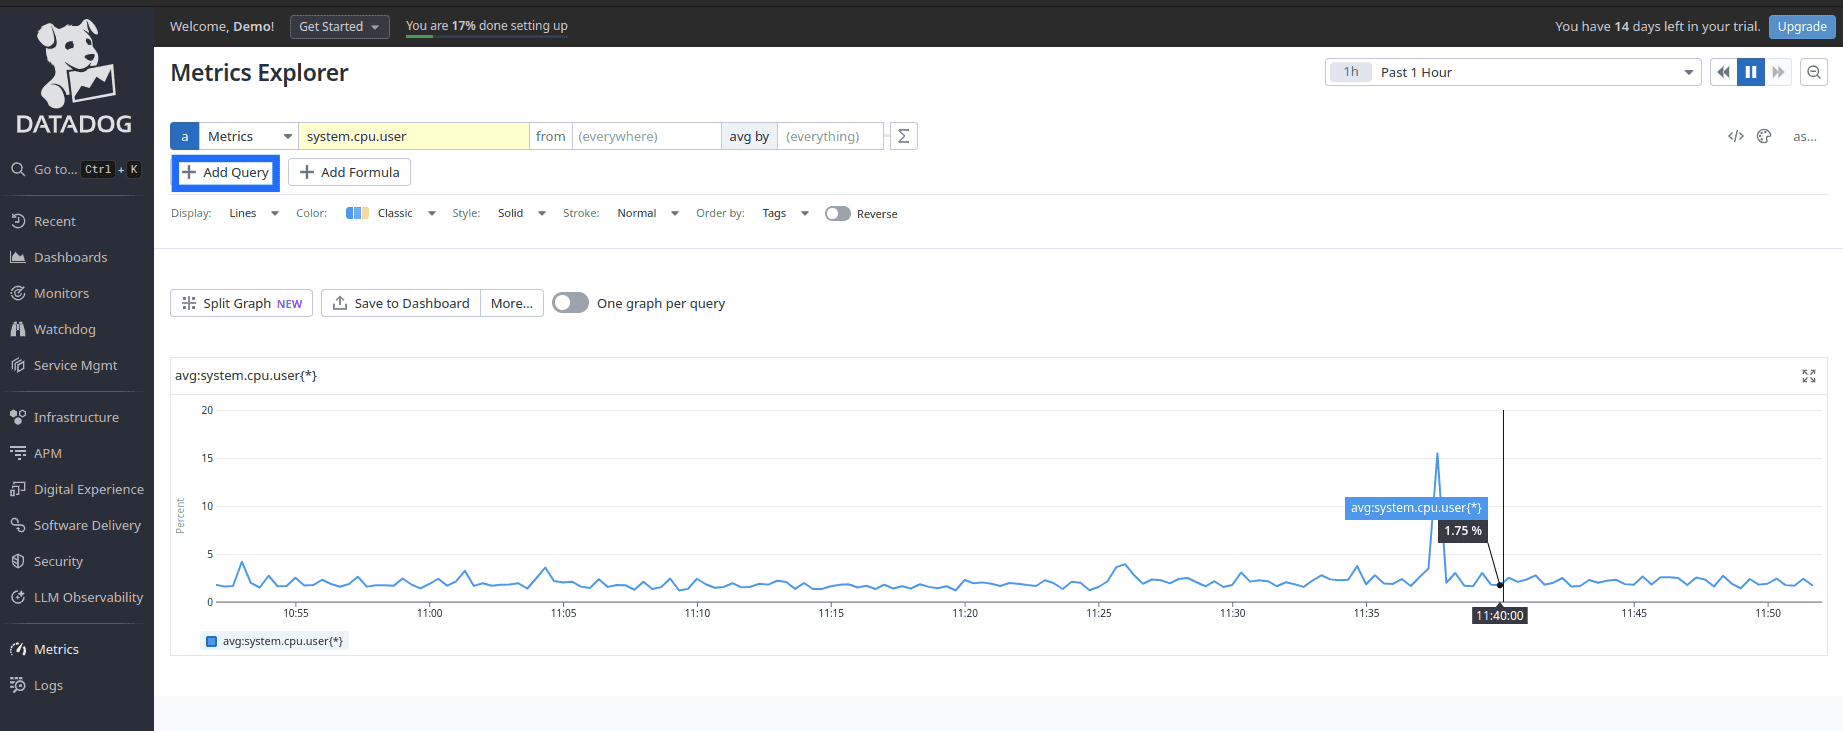
- Log in to Datadog.
- Navigate to Metrics. Click + Add Query and form your desired query.
- In the same band, click Edit raw query.
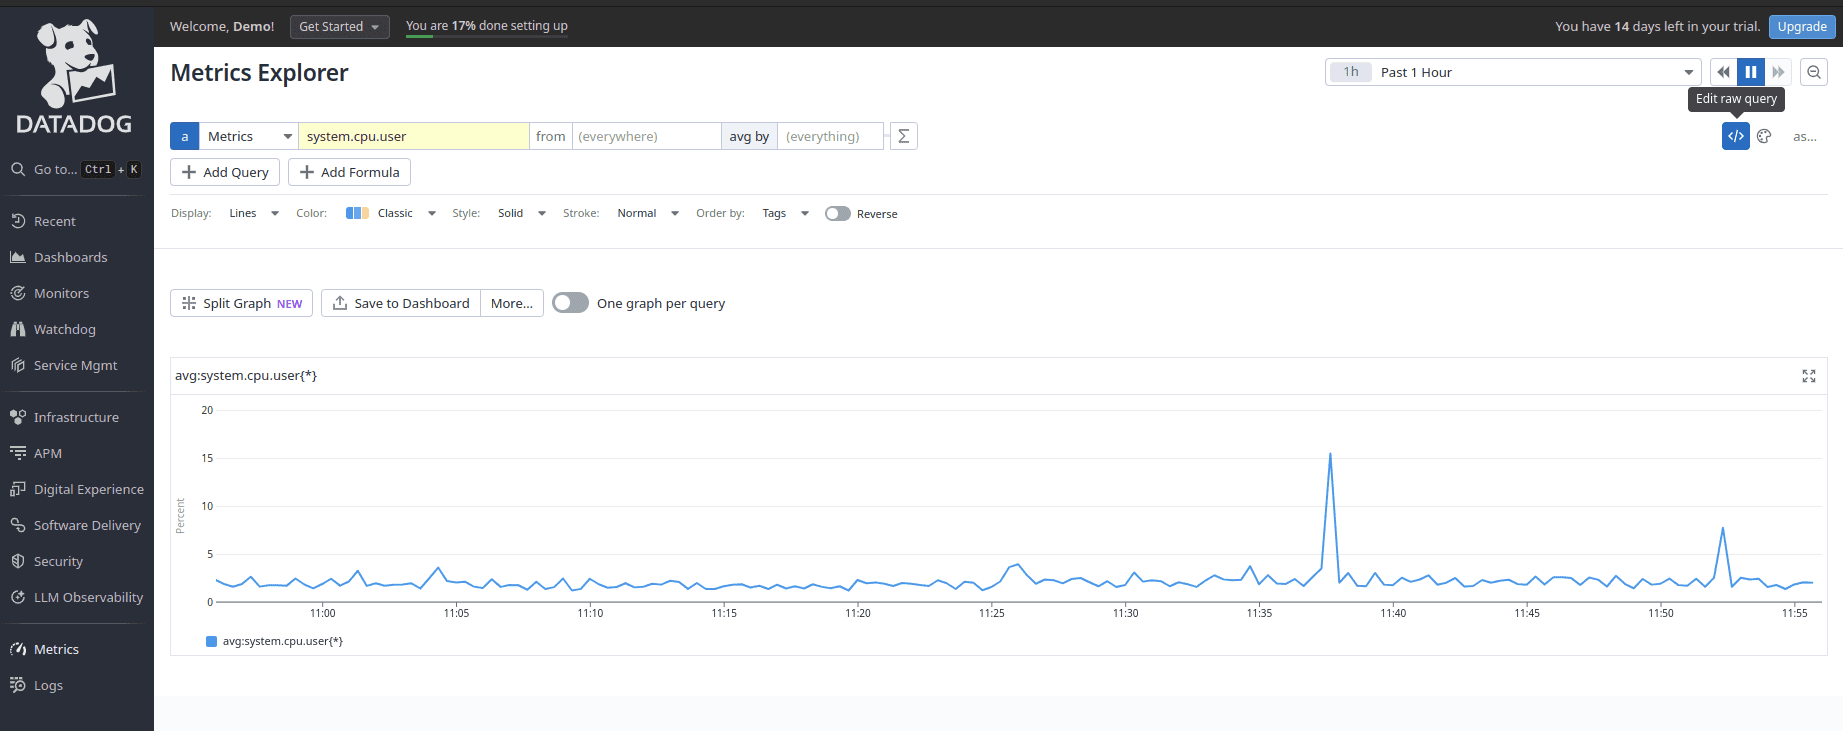
- Copy the query from here and save it.
- Setting up Datadog system metrics in StatusIQ
- Log in to StatusIQ.
- Go to Settings > System Metrics. Toggle to Third-Party Data Source.
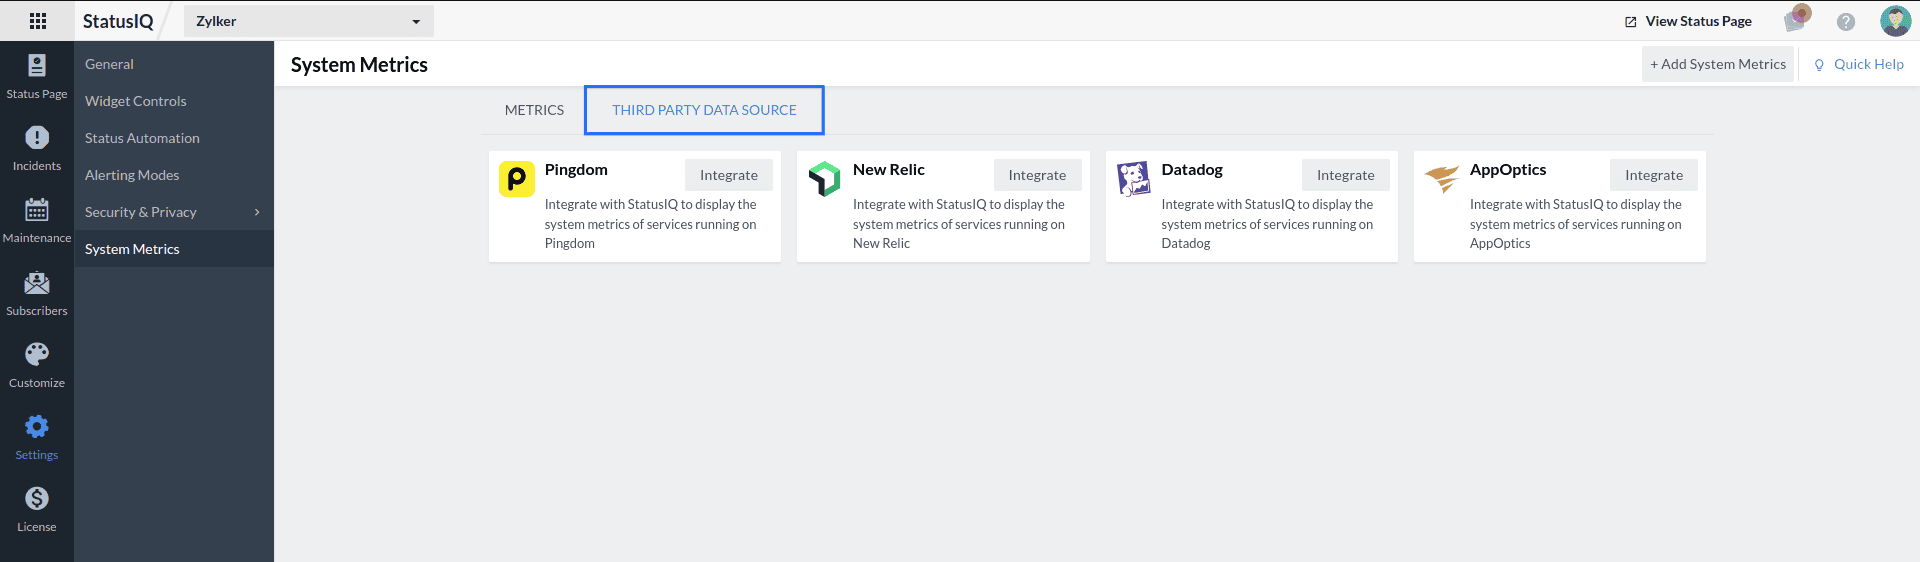
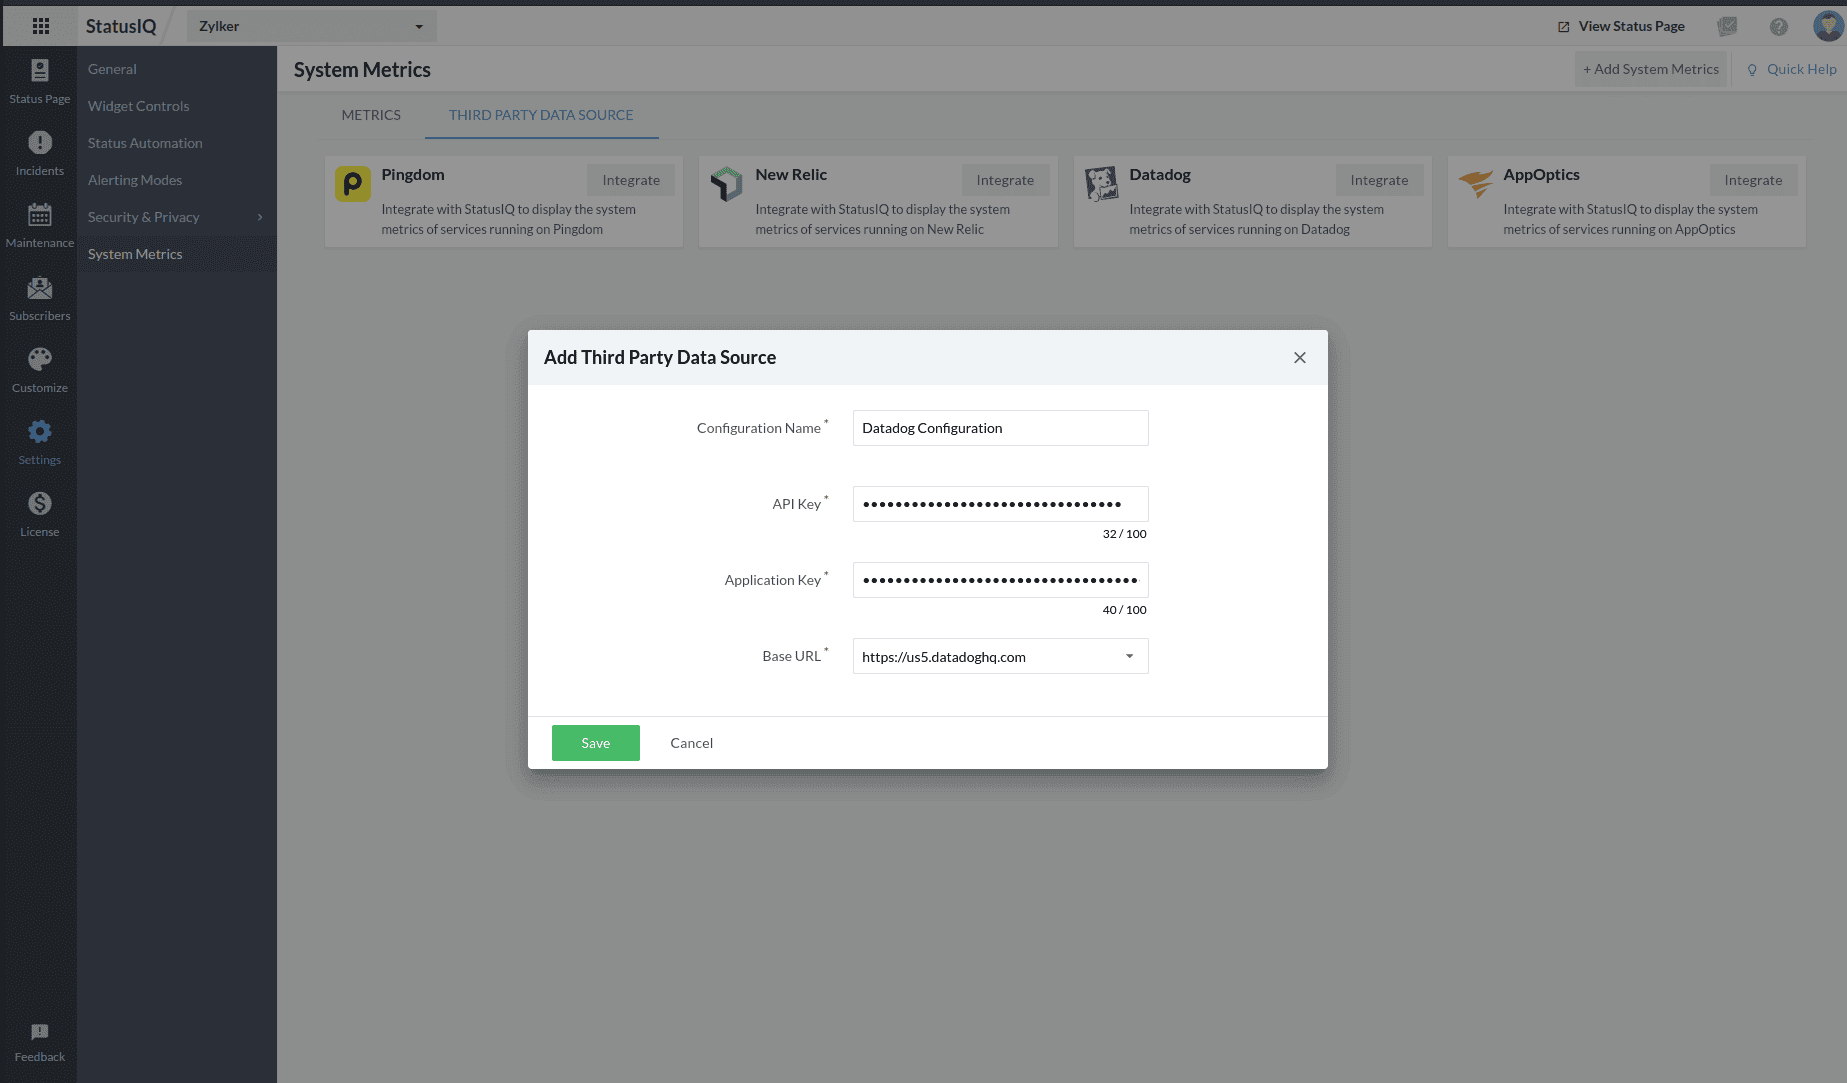
- Select Datadog. In the add Third Party Data Source form, fill in the Configuration Name and paste the copied API Key and Application Key. Provide the relevant Base URL and click Save.
- In the confirmation pop-up, click Proceed.
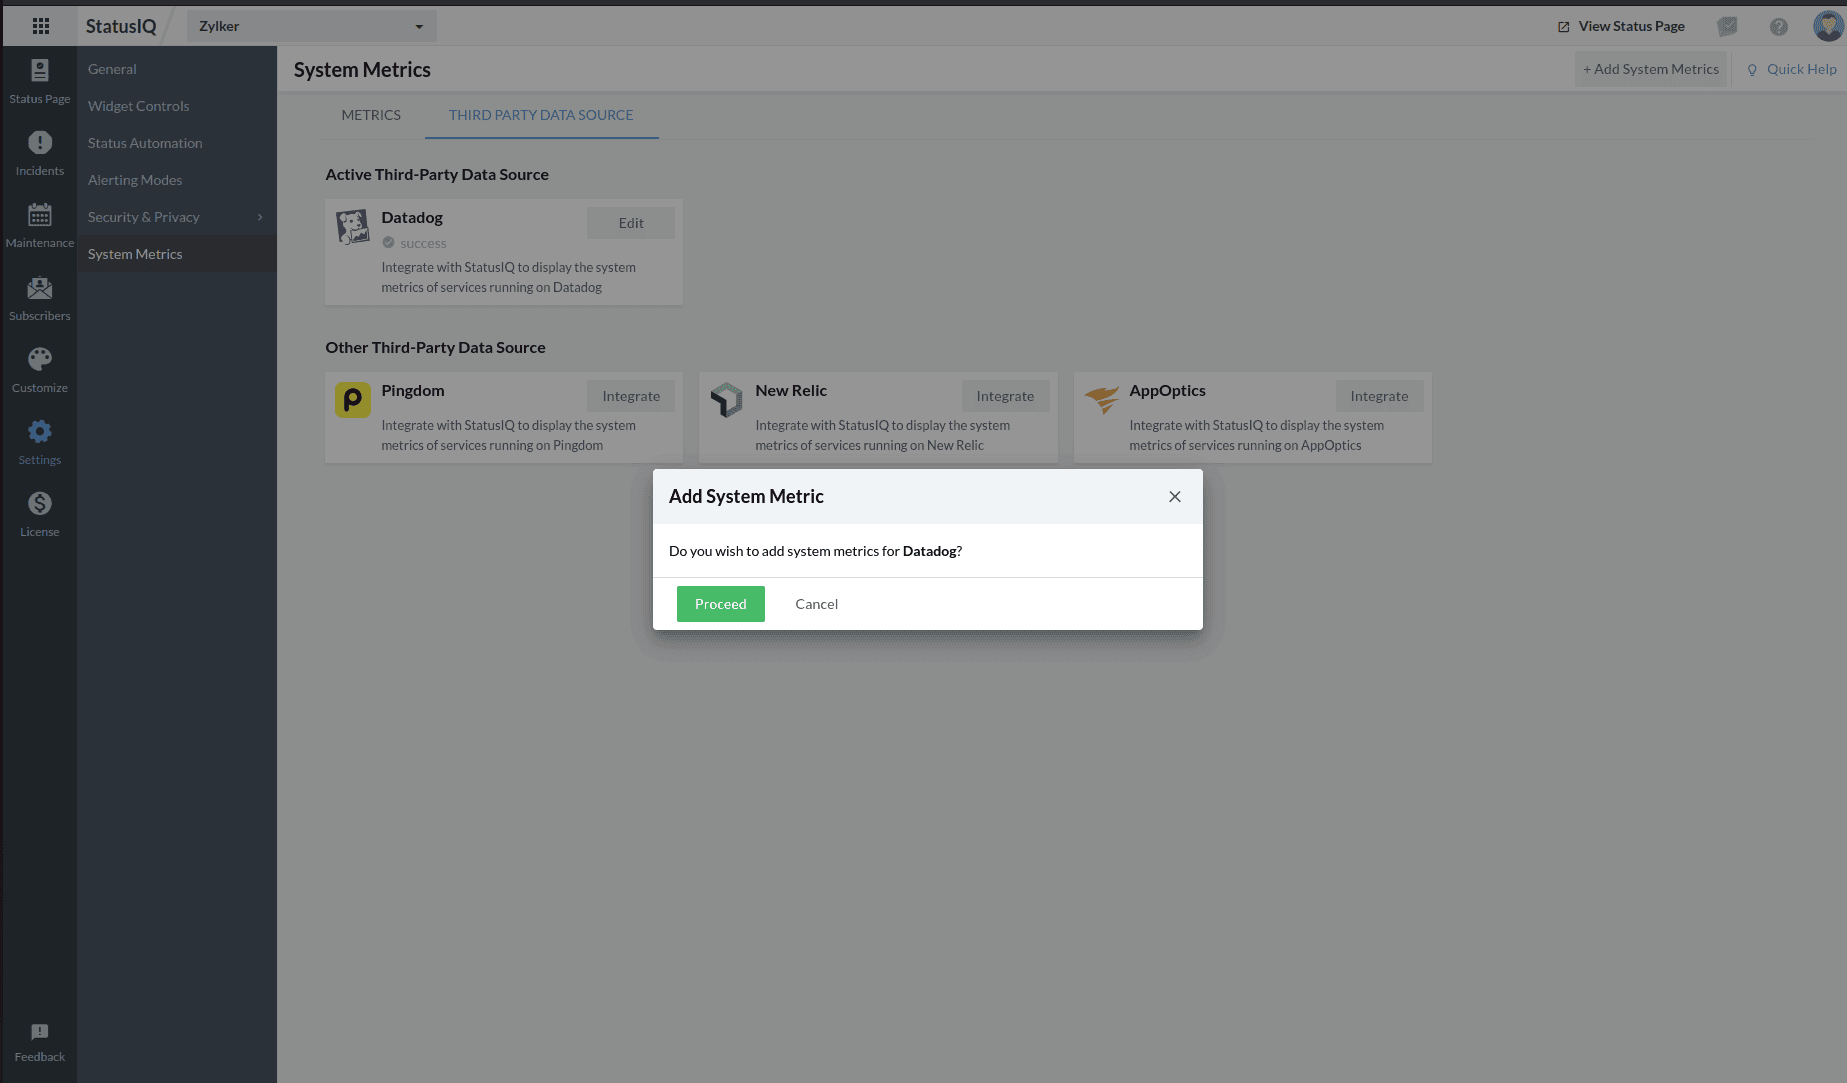
If you want to configure Datadog but prefer not to add system metrics at this time, click Cancel. If you wish to add system metrics, click Proceed and continue from the second step of the next section.
- How to get the API key from Datadog
-
How to add system metrics of Datadog in StatusIQ after configuration
- In StatusIQ, go to Settings > System Metrics and click + Add System Metrics in the top band as shown below.
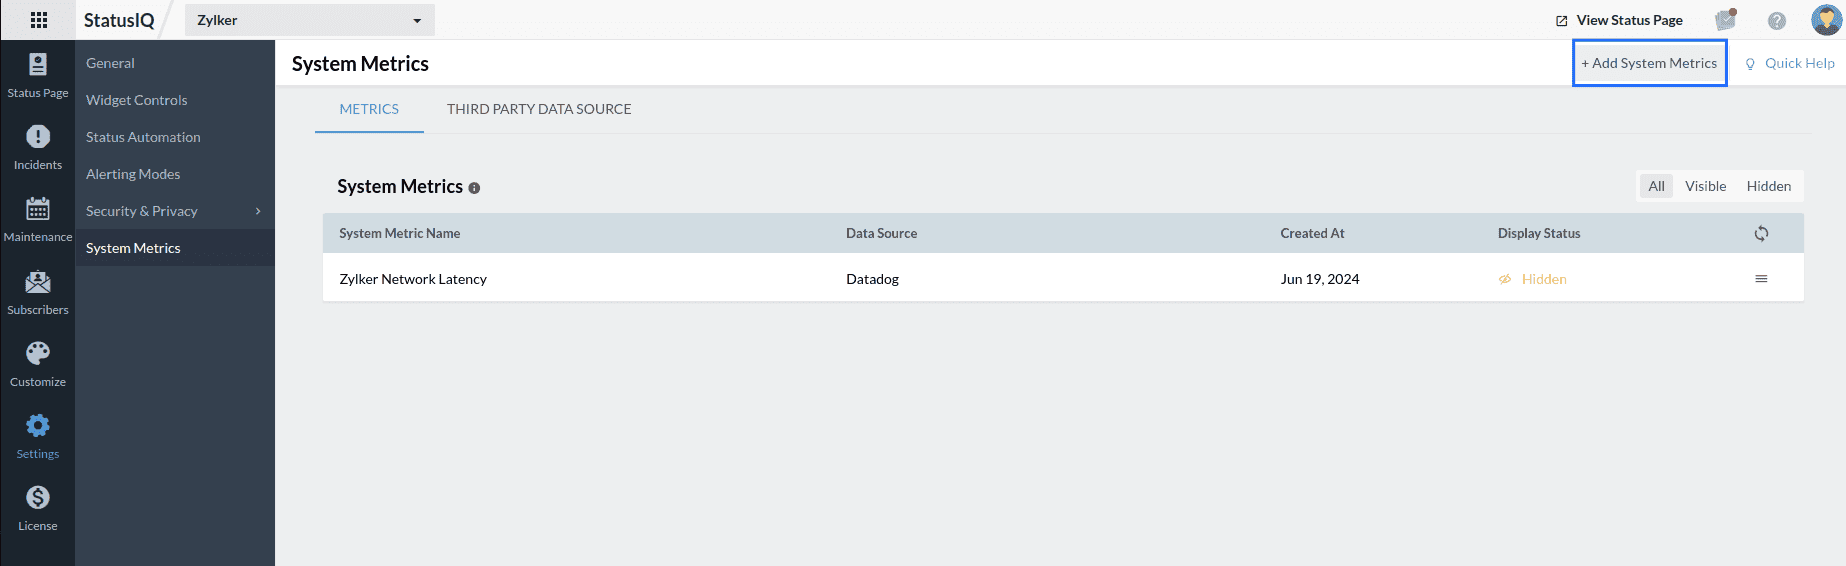
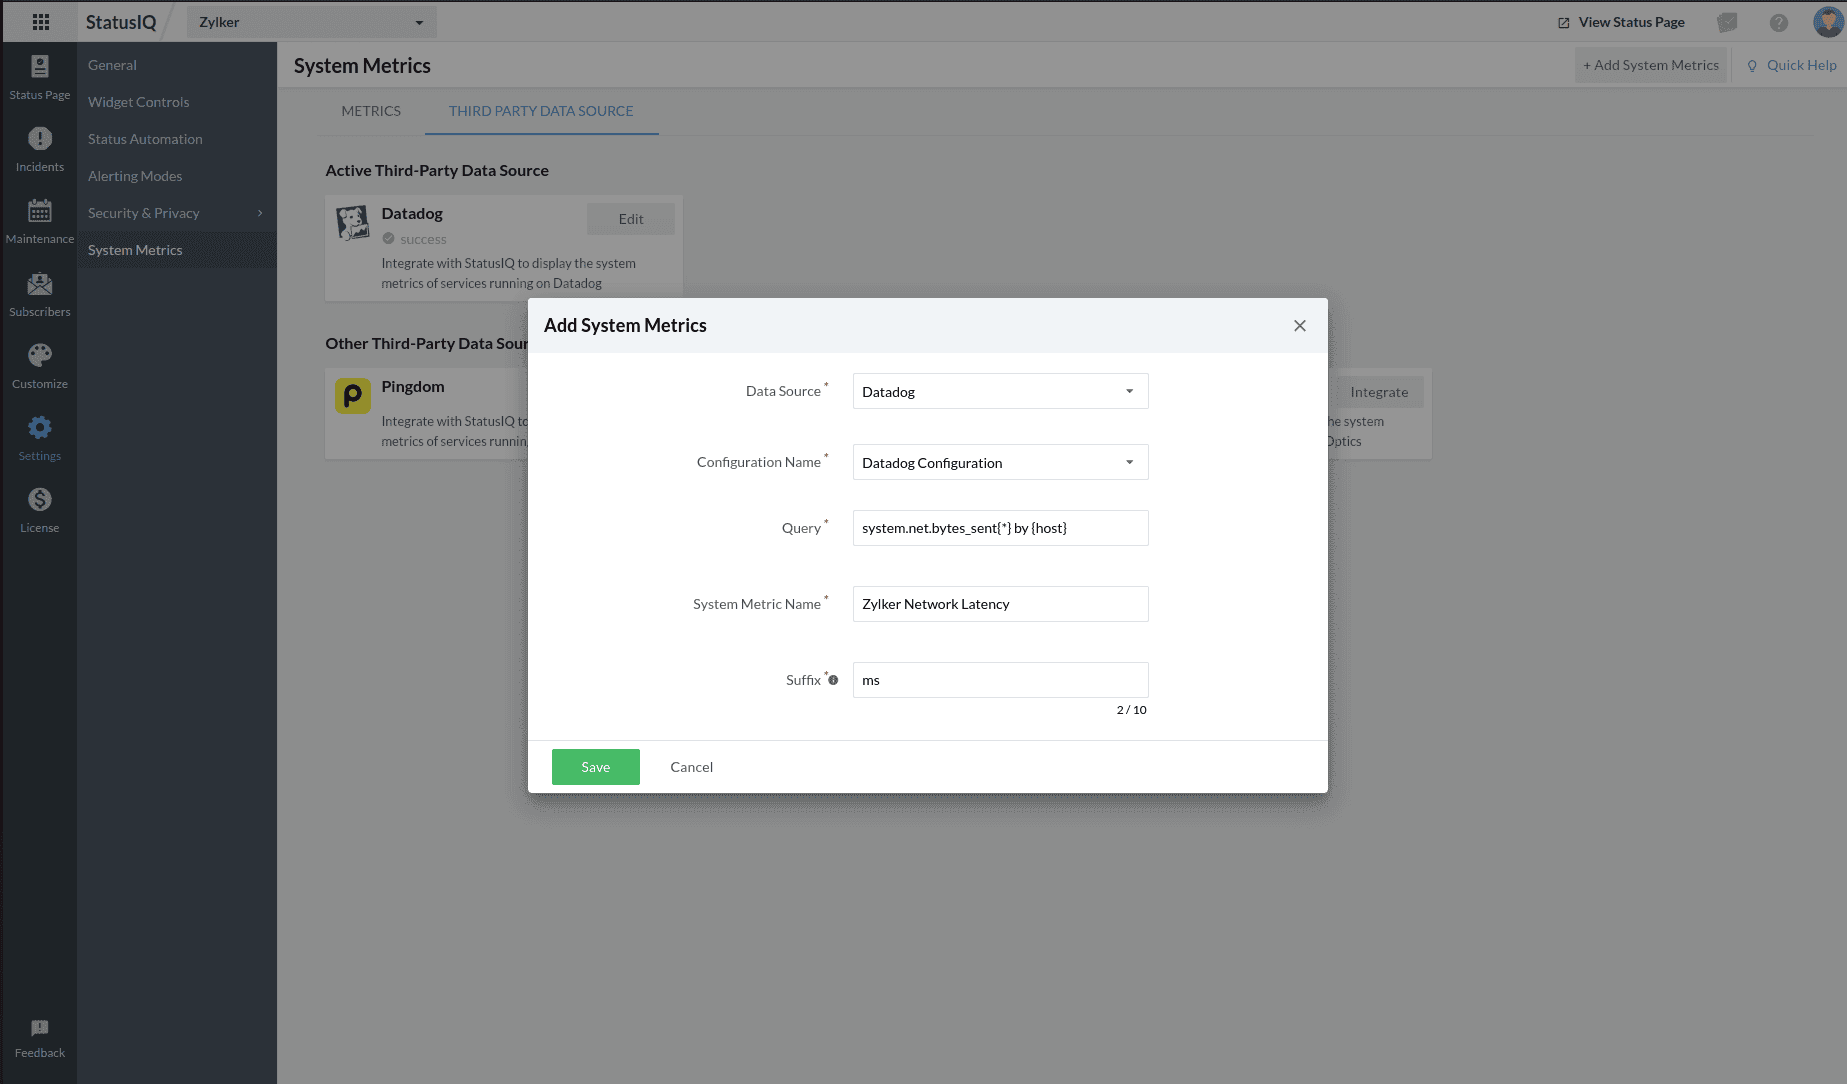
- Fill out the Add System Metrics form and click Save. (Learn how to generate a query here)
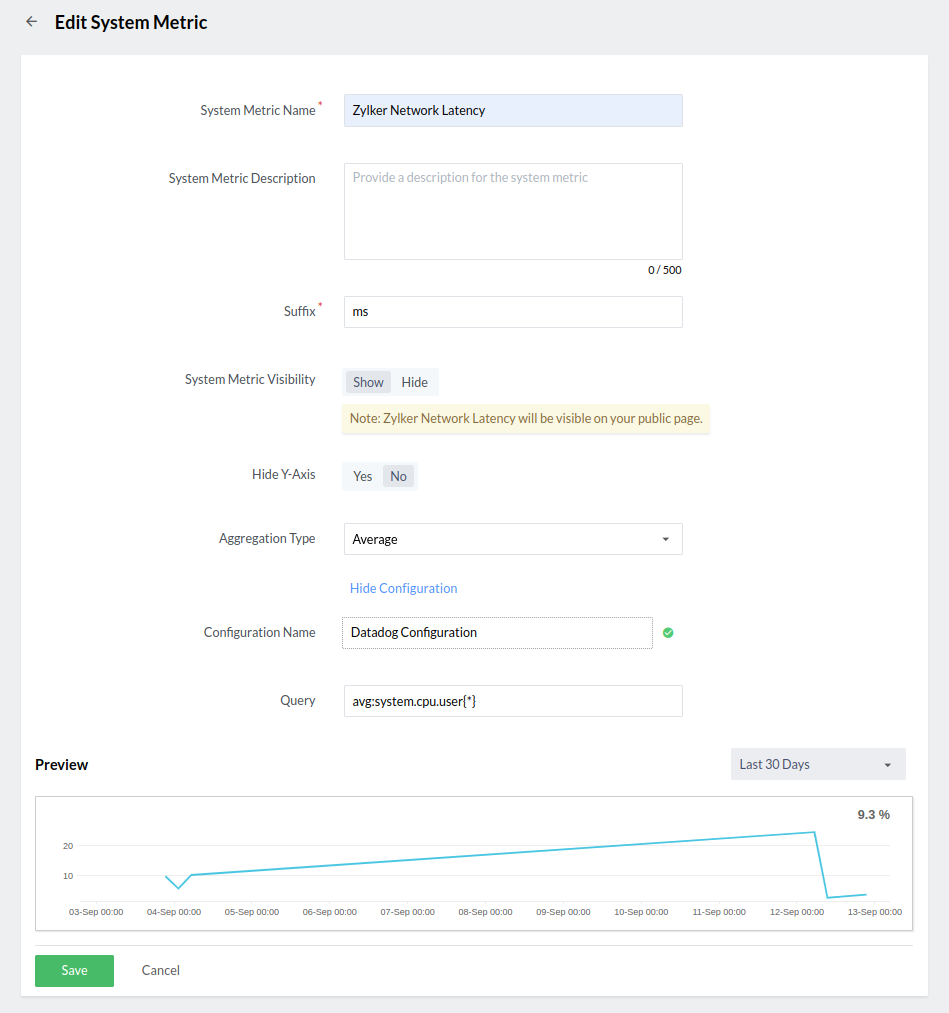
- Fill out the Edit System Metrics page and click Save.
- In StatusIQ, go to Settings > System Metrics and click + Add System Metrics in the top band as shown below.
-
Click Set it to visible for the system metric to be displayed on the public page.
How to set up custom system metrics
-
- Log in to StatusIQ.
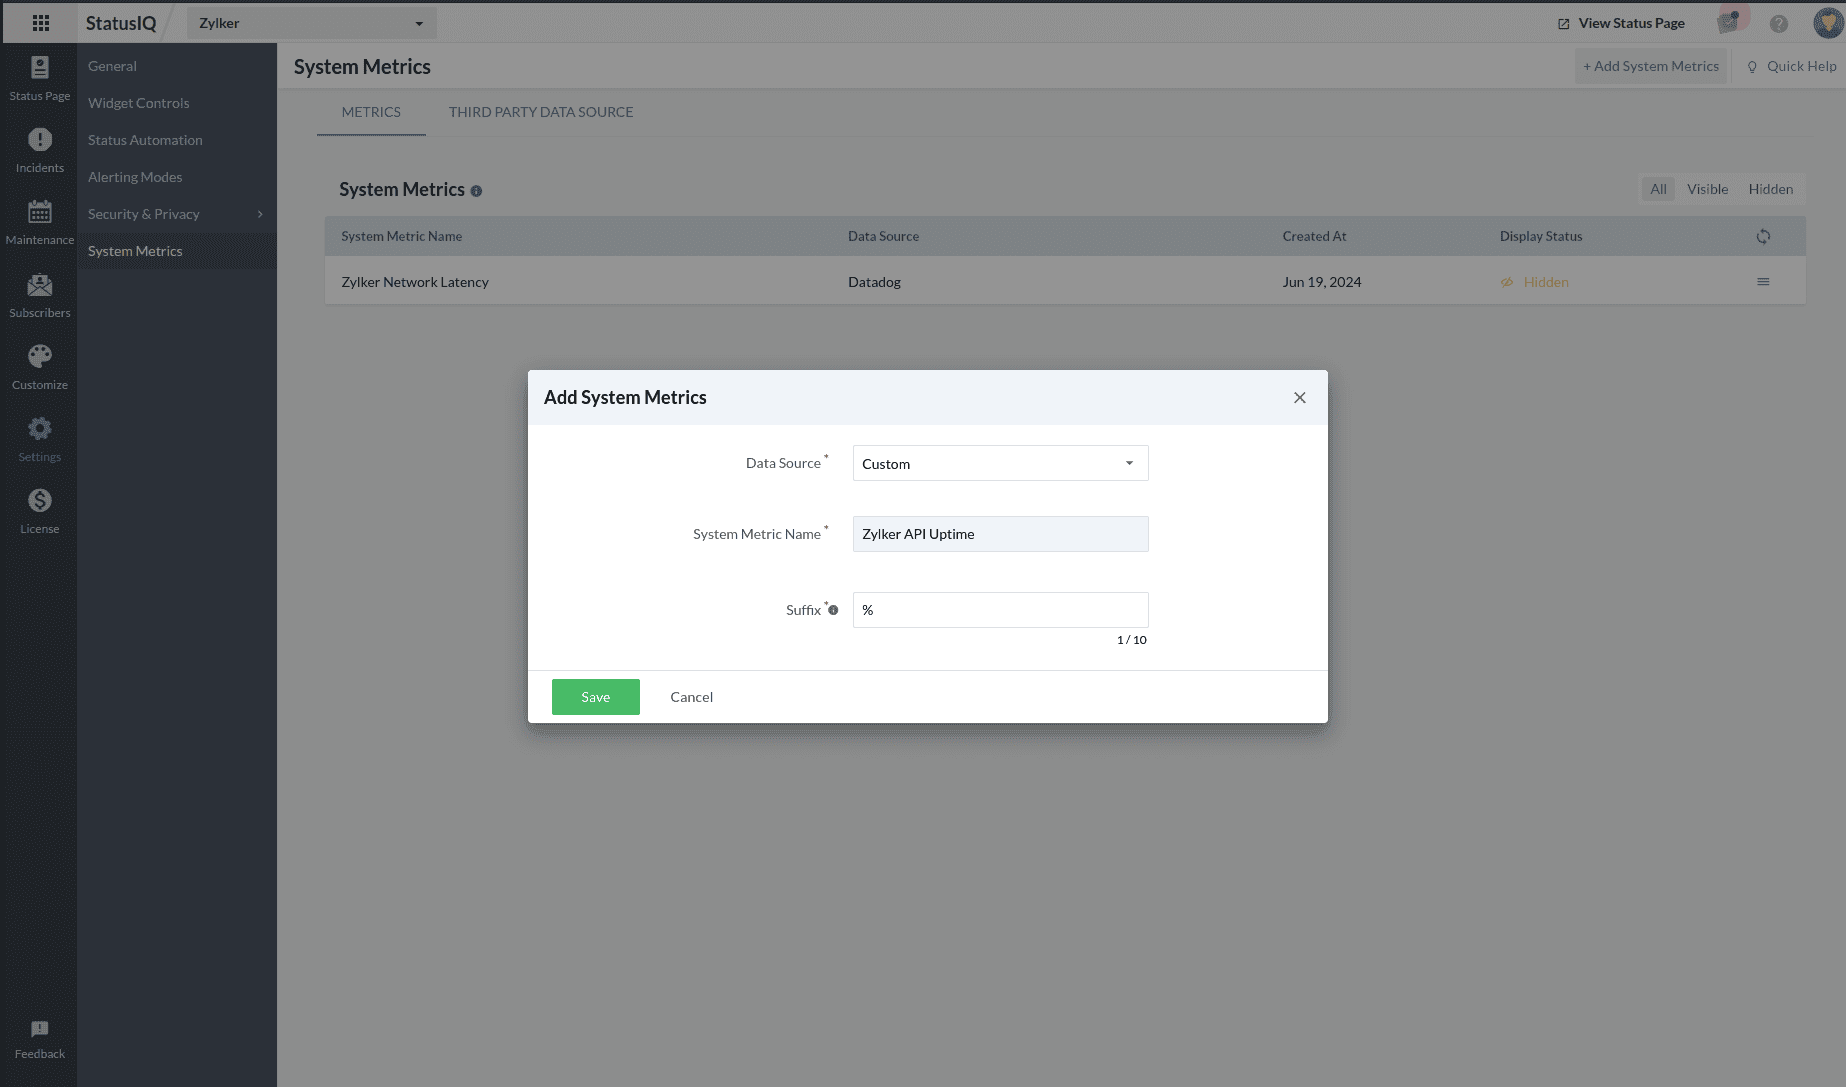
- Navigate to Settings > System Metrics. Click + Add System Metrics in the top-right corner of the page.
- In the Add System Metrics pop-up, provide the desired Data Source, System Metric Name, and Suffix, and click Save.
- On the Edit System Metric page, fill out the details and click Save.
How to reset the custom system metric data
You can reset the custom system metric data from the Edit System Metric page by clicking Reset System Metric Data.
How to edit or delete third-party data source configurations
-
- From the System Metrics page, toggle to Third-Party Data Source and click Edit on your desired third-party data source.
- You can edit the details and click Save, or you can choose to Delete the third-party data source from there.

- From the System Metrics page, toggle to Third-Party Data Source and click Edit on your desired third-party data source.
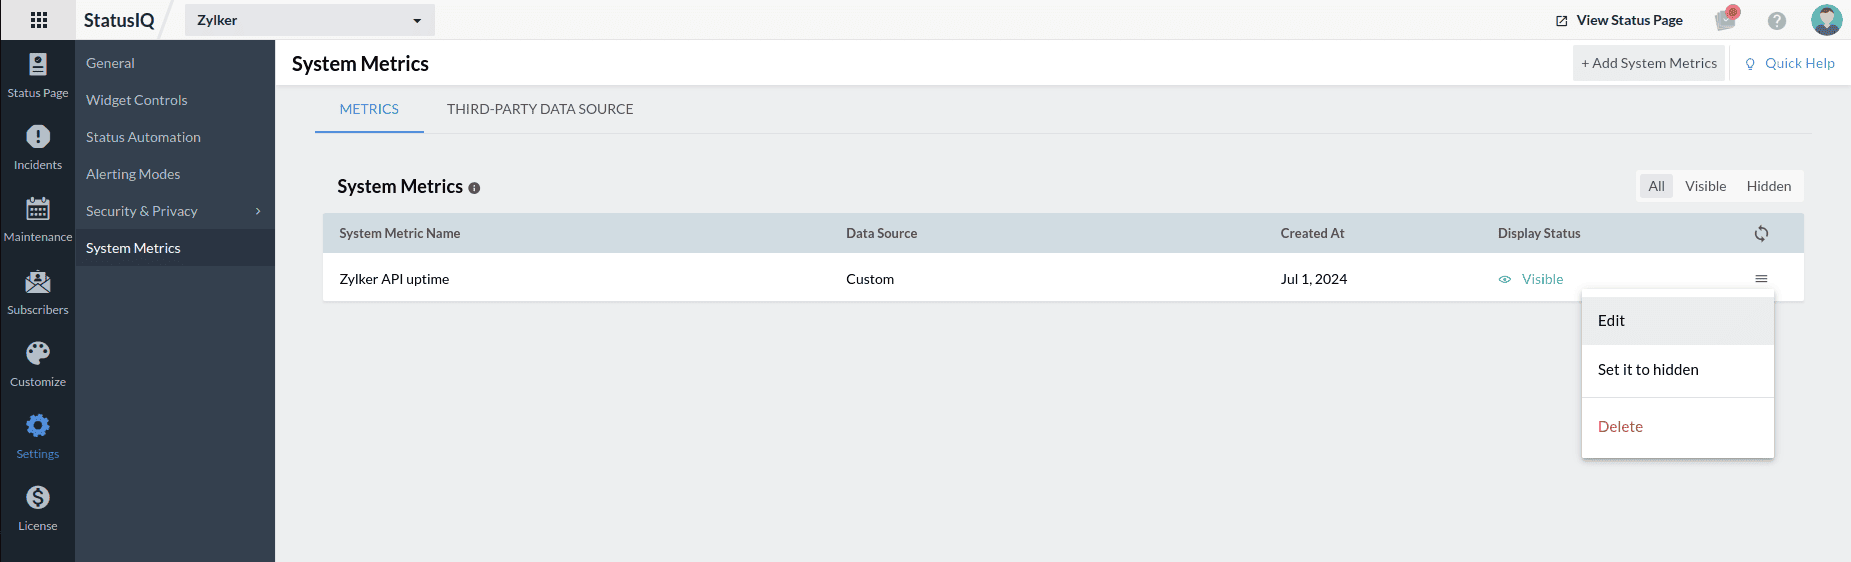
How to edit or delete a system metric
Go to Settings > System Metric. Click the hamburger icon on the desired system metric and choose Edit or Delete.