Performance metrics of OS X Server monitor
Install and add an OS X agent and monitor your OS X servers to measure important performance metrics including CPU, memory, disk utilization, network traffic and more from a customizable and unified console. Know how the agent sends complete performance metrics every 5 minutes to the Site24x7 data collector where users can view their reports via their browser.
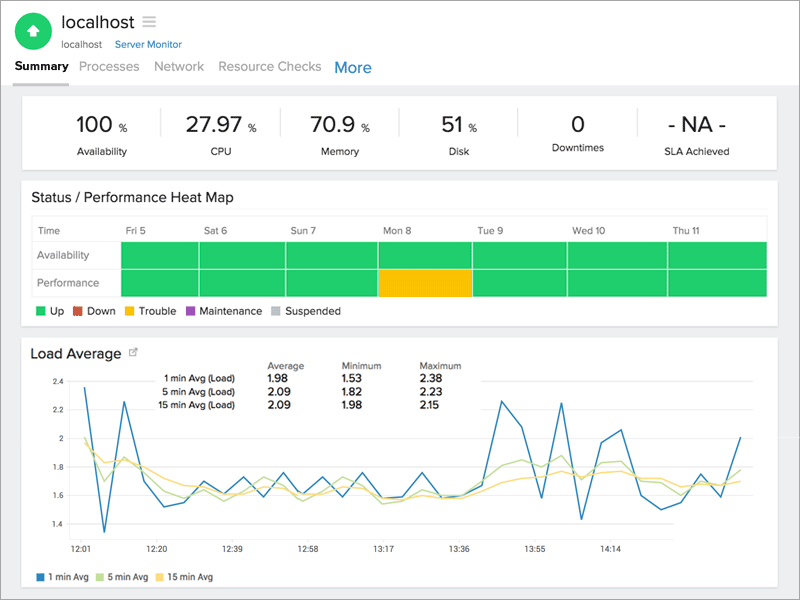
Device snapshot
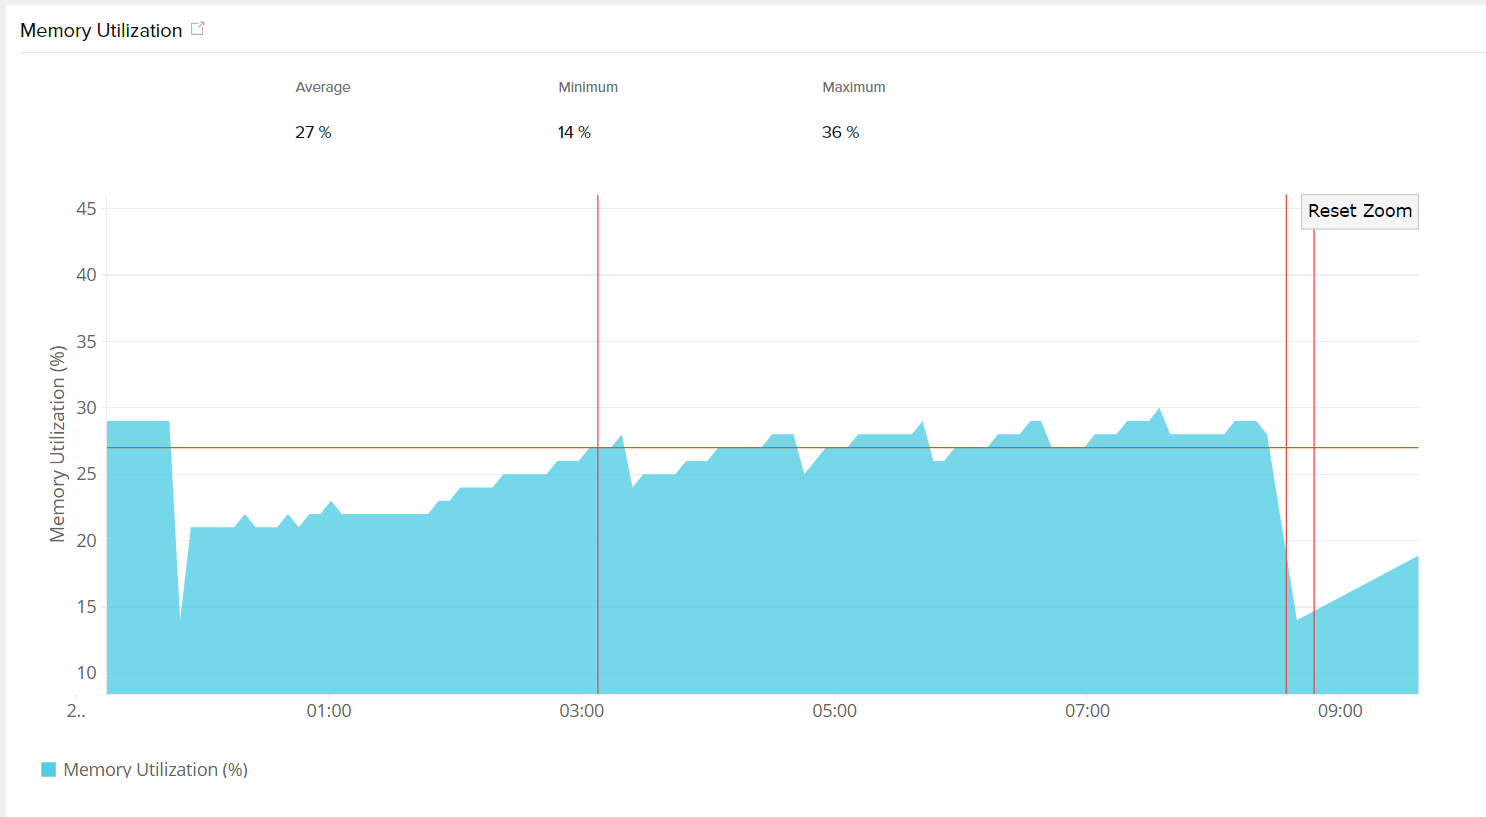
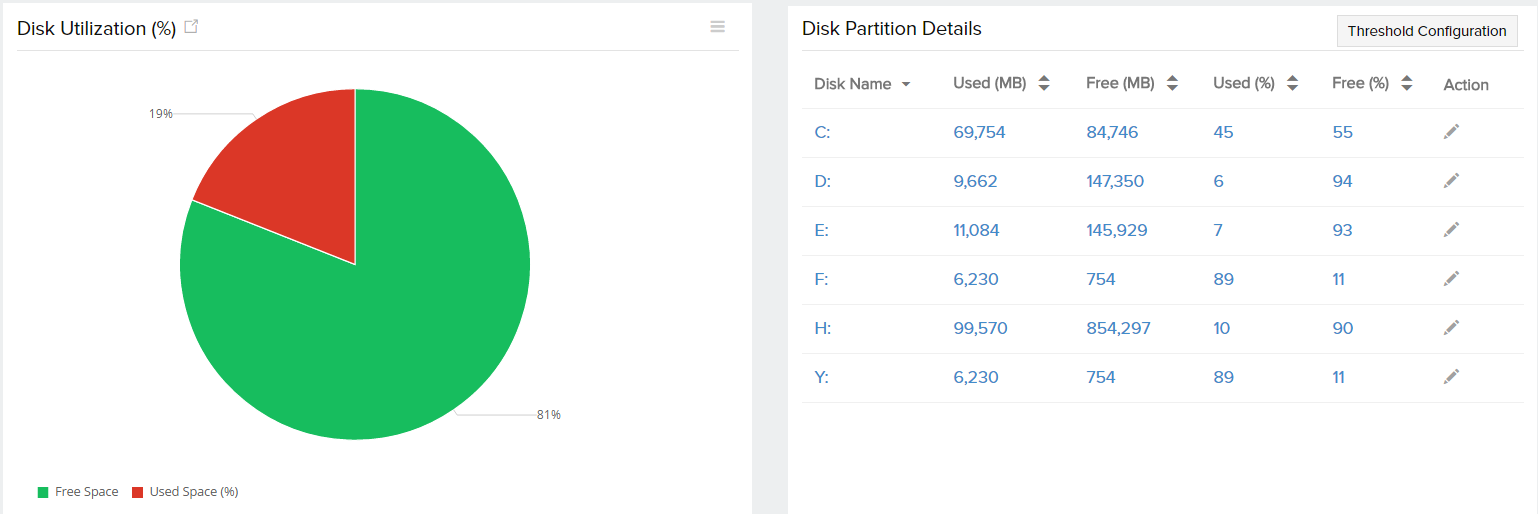
In-depth analysis and study can be made for every parameter listed under the Device Snapshot tab. By clicking on the desired parameter, a detailed synopsis opens up in a new window, which can be sent as an email or exported as a PDF/CSV file. Reports can also be generated for a specific time period, by using the drop down on the top left corner of the page.
Memory utilization
Disk utilization
Asset details
| Parameters | Description |
| Host Name | Name of the system |
| IP Address | The IP address of the host machine |
| Operating System | Name of the OS running in the instance |
| OS Architecture | Specifies the underlying OS architecture - 32 bit or 64 bit |
| Installed Memory | The physical memory of the server in MB |
| Processor | Name and description of the processor |
Processes
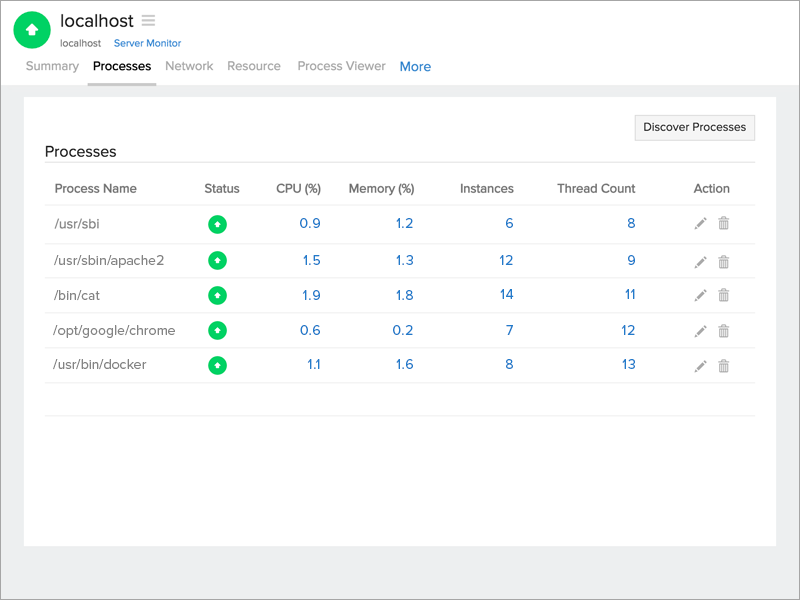
The various processes associated with OS X are detailed under this section, along with the following metrics:
| Parameters | Description |
| Process Name | Name of the process |
| Status | Status of the process, it is up or down |
| CPU (%) | The percentage of CPU used by a particular process |
| Memory (%) | The percentage of memory used by a particular process |
| Instances | The number of running instances in a process |
| Thread Count | No of threads created by a process |
| Action | Set thresholds or delete a particular process |
Network statistics
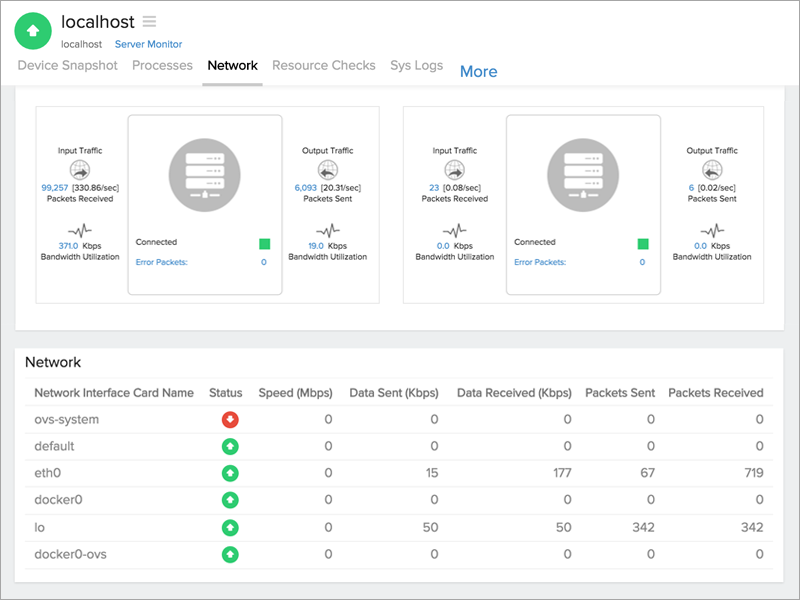
This section provides a complete description on the input and output traffic, in addition to the bandwidth utilization for both input and output traffic. Clicking on the traffic icons will generate individual reports on the error/discarded packets and packets traffic.
Resource checks
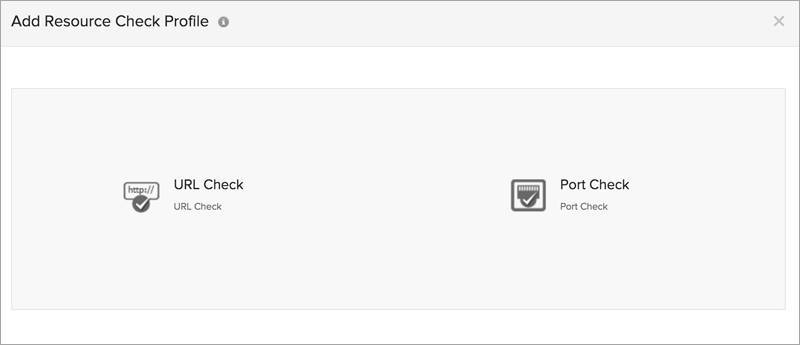
Gather inputs on url and port checks and configure thresholds to be alerted when a check fails. New/existing checks can be added/edited using the Edit Resource Check Profile option on the right corner of the page. To know more on how to add/edit/modify a resource check, click here.
Process viewer
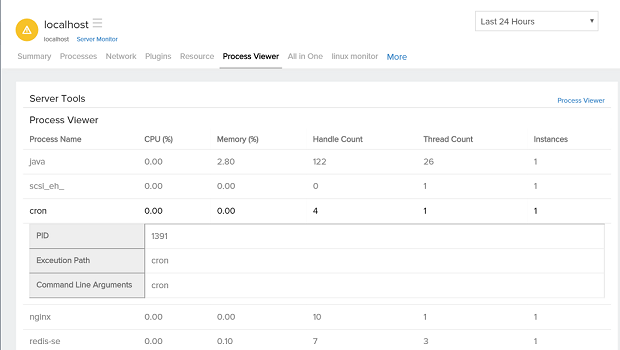
The various processes on the server monitor can be studied using the Process Viewer. Hovering the mouse on the process name lists their respective PID, Execution Path, and Command Line Arguments. Sort the processes based on CPU, memory handle, and thread count.
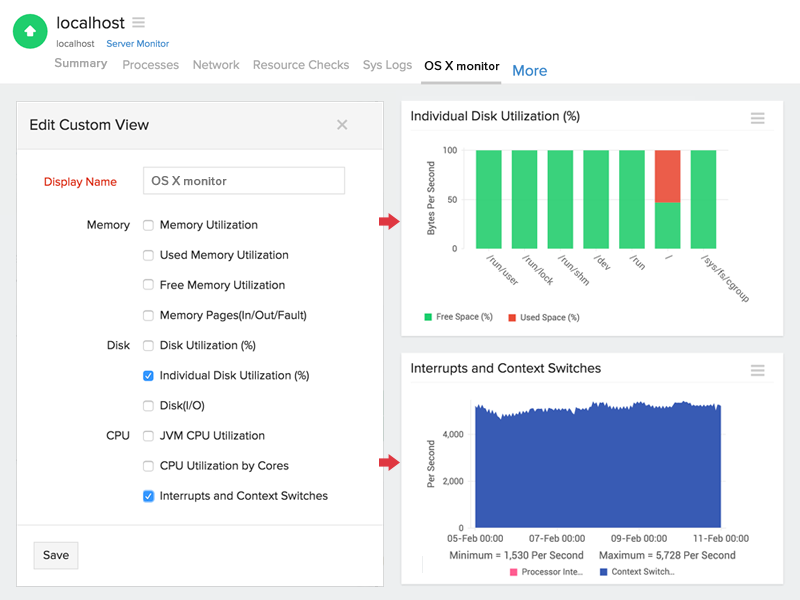
Customize your reports
Users can create reports based on their preference by clicking on the desired metric and access the icon. Here, you can select the required parameters based on memory, disk, and CPU.
