Performance metrics of Data Lake
Get a detailed overview of the Data Lake monitor's performance and its key metrics. This page helps you analyze the data collected, visualize trends, and gain actionable insights. It includes multiple tabs like Dashboard, Fields, Query Data, and Alerts, offering a comprehensive way to view and manage metrics, customize dashboards, and set up alerts.
You can click on the required monitor to view the performance metrics of the fields added to it. On the right corner, you can also decide on the time frame for which you need the metrics.
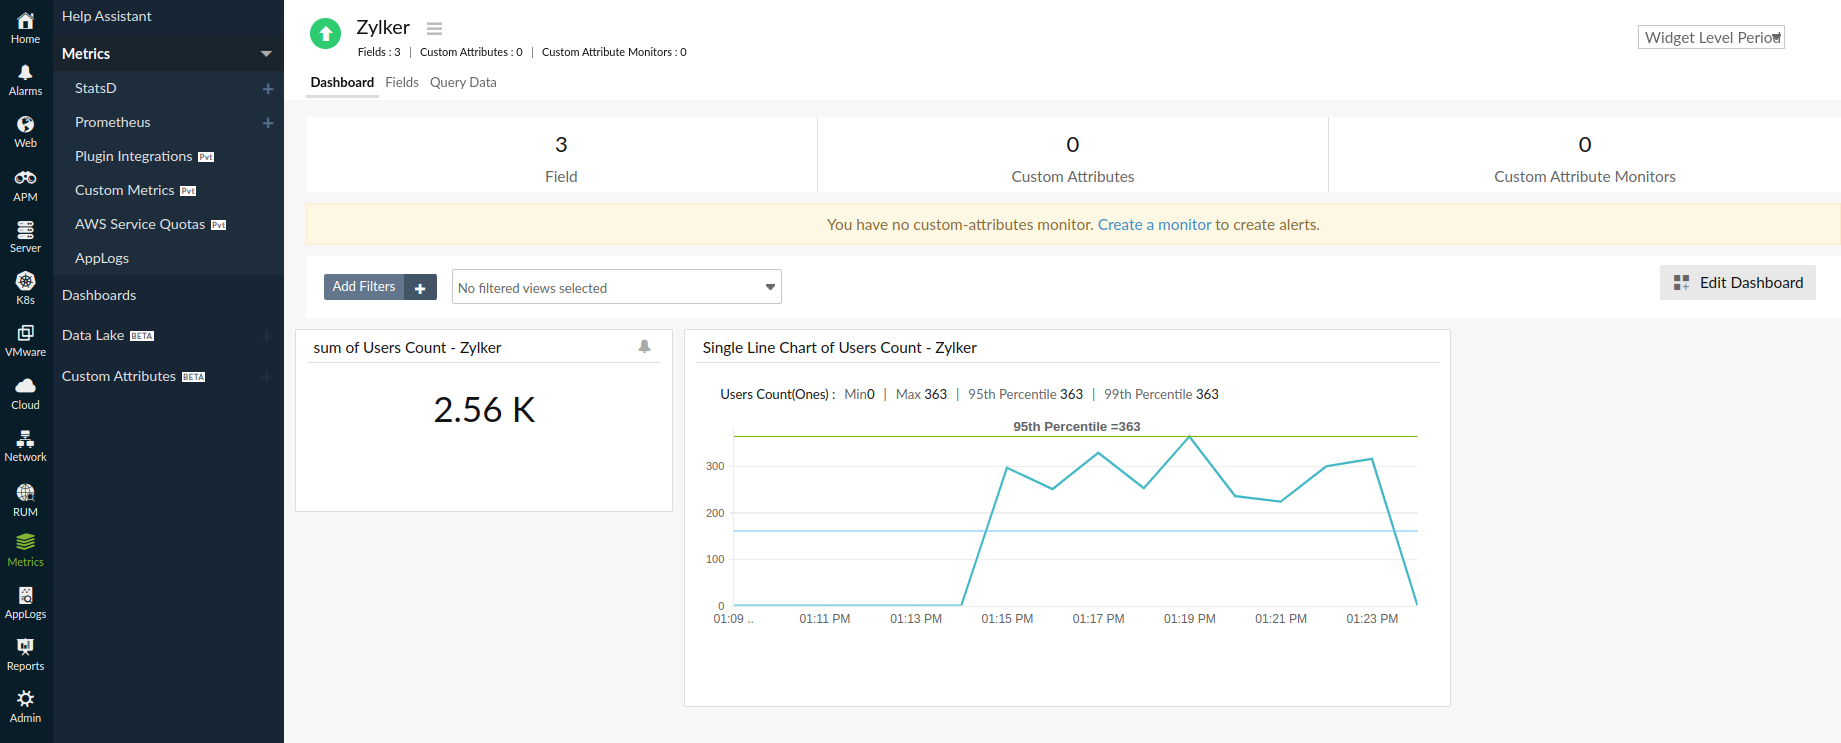
Dashboard tab
A default dashboard view will be displayed, showing the number of fields, custom attributes, and custom attribute monitors present.
It also displays numeric widgets and single-line charts for all numeric fields. You can also customize the dashboard using the Edit Dashboard option.
Edit Dashboard
You can build your own dashboard that includes various visualization options like numeric charts, graphs, and tables, which help you visualize and understand the metrics data. This visual representation makes it easier to spot trends, anomalies, and correlations.
Follow the steps below to create a custom dashboard:
- Click on Edit Dashboard.
- Provide a suitable name and description for your dashboard.
- Under Widget Type, choose from Numeric, Graph, or Table.
- Numeric chart:
Select the required Field, Aggregation, Unit, and Time Period. Finally, drag and drop the widget onto the working space to visualize the chart. - Graph:
Select the required Graph Type, Label Name, Field, Aggregation, and Time Period. Finally, drag and drop the widget onto the working space to visualize the graph. - Table:
Select the required string field to split the rows based on that. Provide the column properties, Aggregation, and Time Period. Finally, drag and drop the widget onto the working space to visualize the table.
- Numeric chart:
- When you're done, click Done customizing at the top of the page.
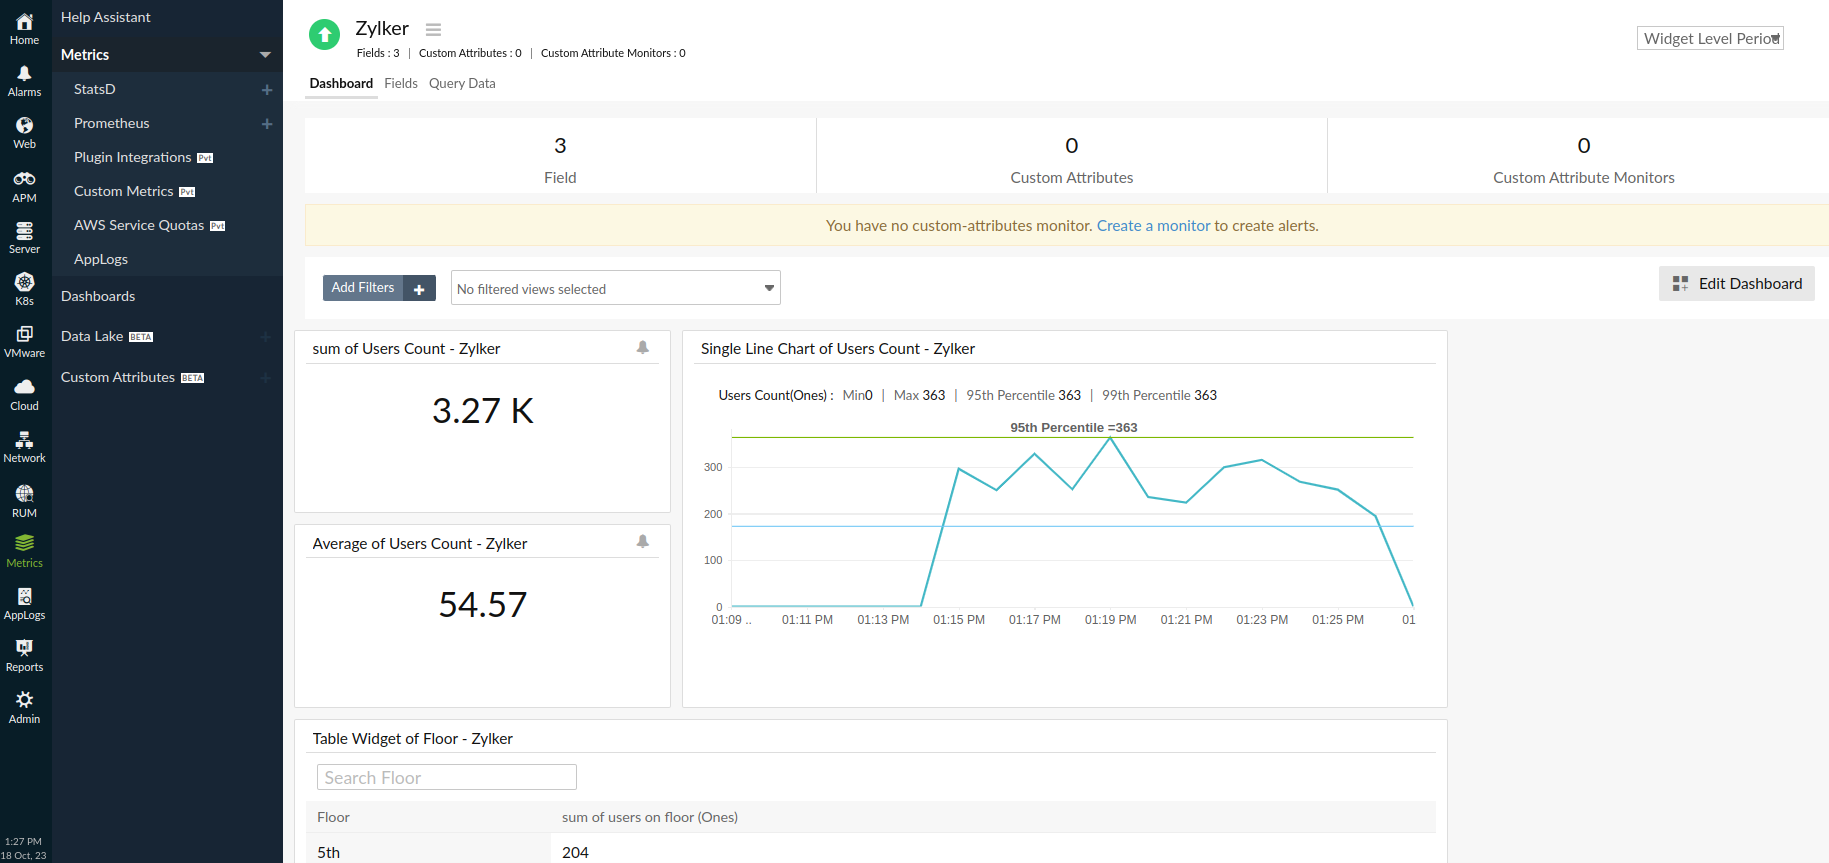
The new widgets added are displayed on the Dashboard tab.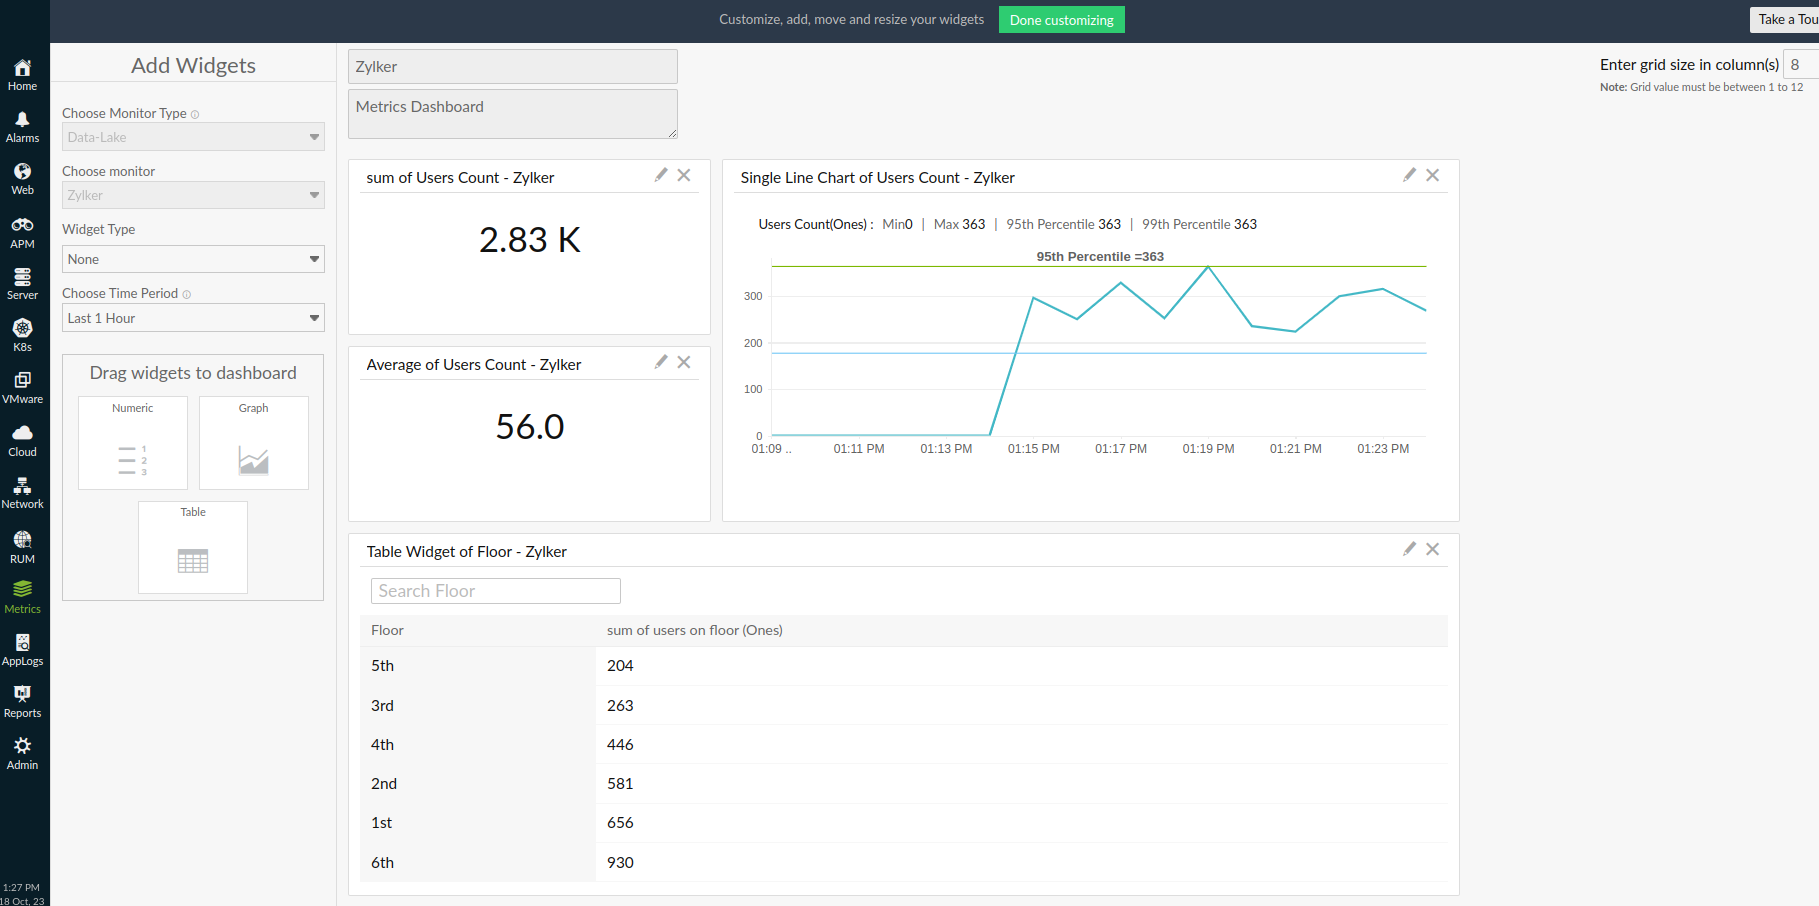
Filter
The Add Filters option includes AND conditions. The filter conditions will be applied to all widgets present, and the results will be shown accordingly.
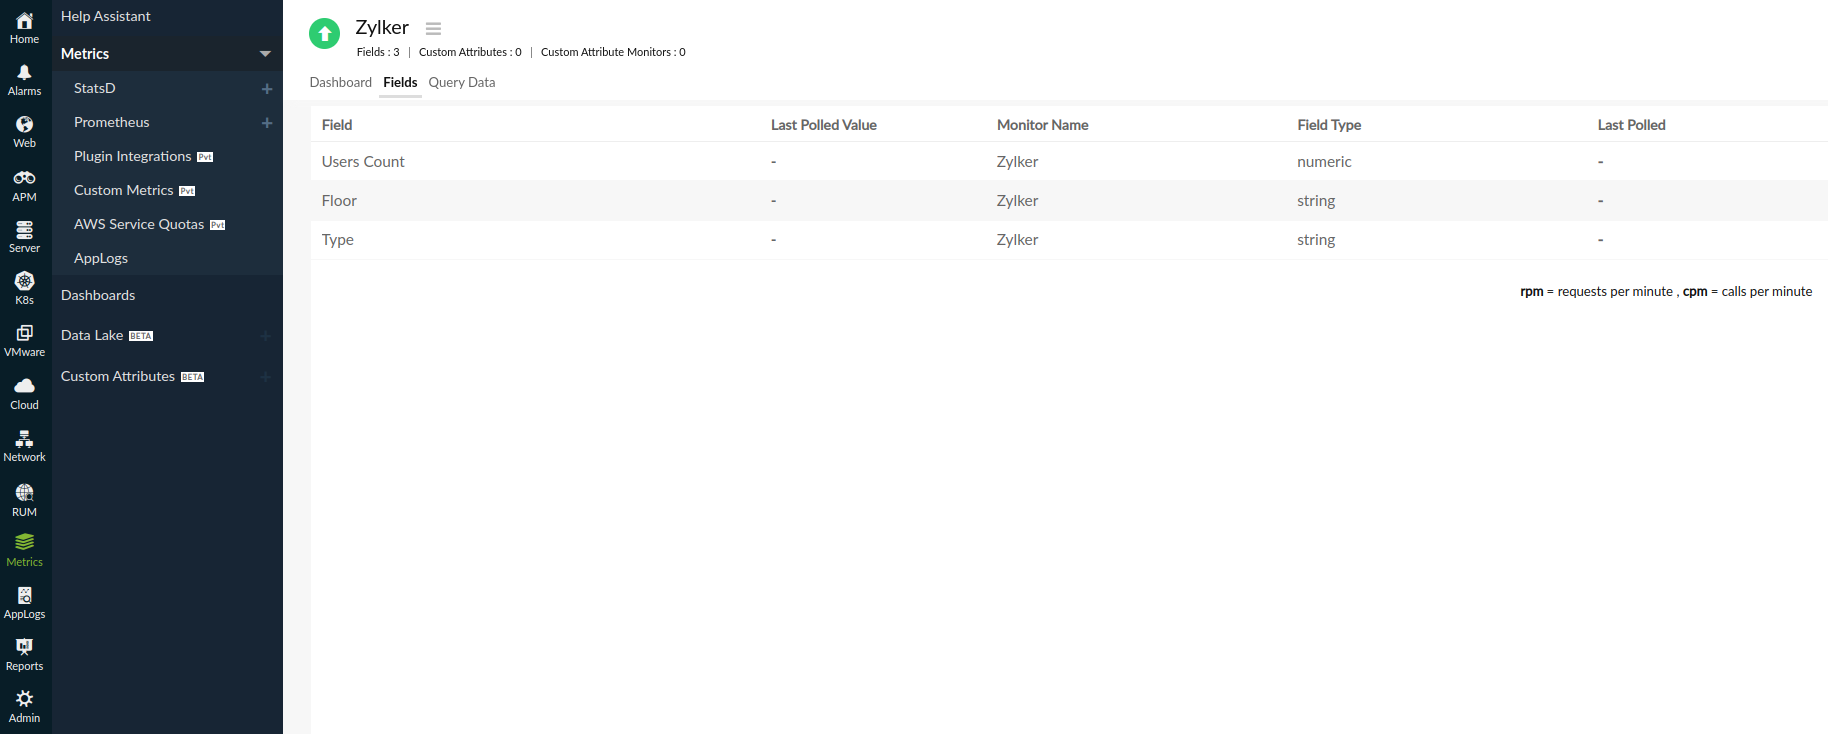
Fields tab
In general, you can see a comprehensive list of all the fields of your monitor. You can view details like monitor name, field type, last polled value, and last polled time.
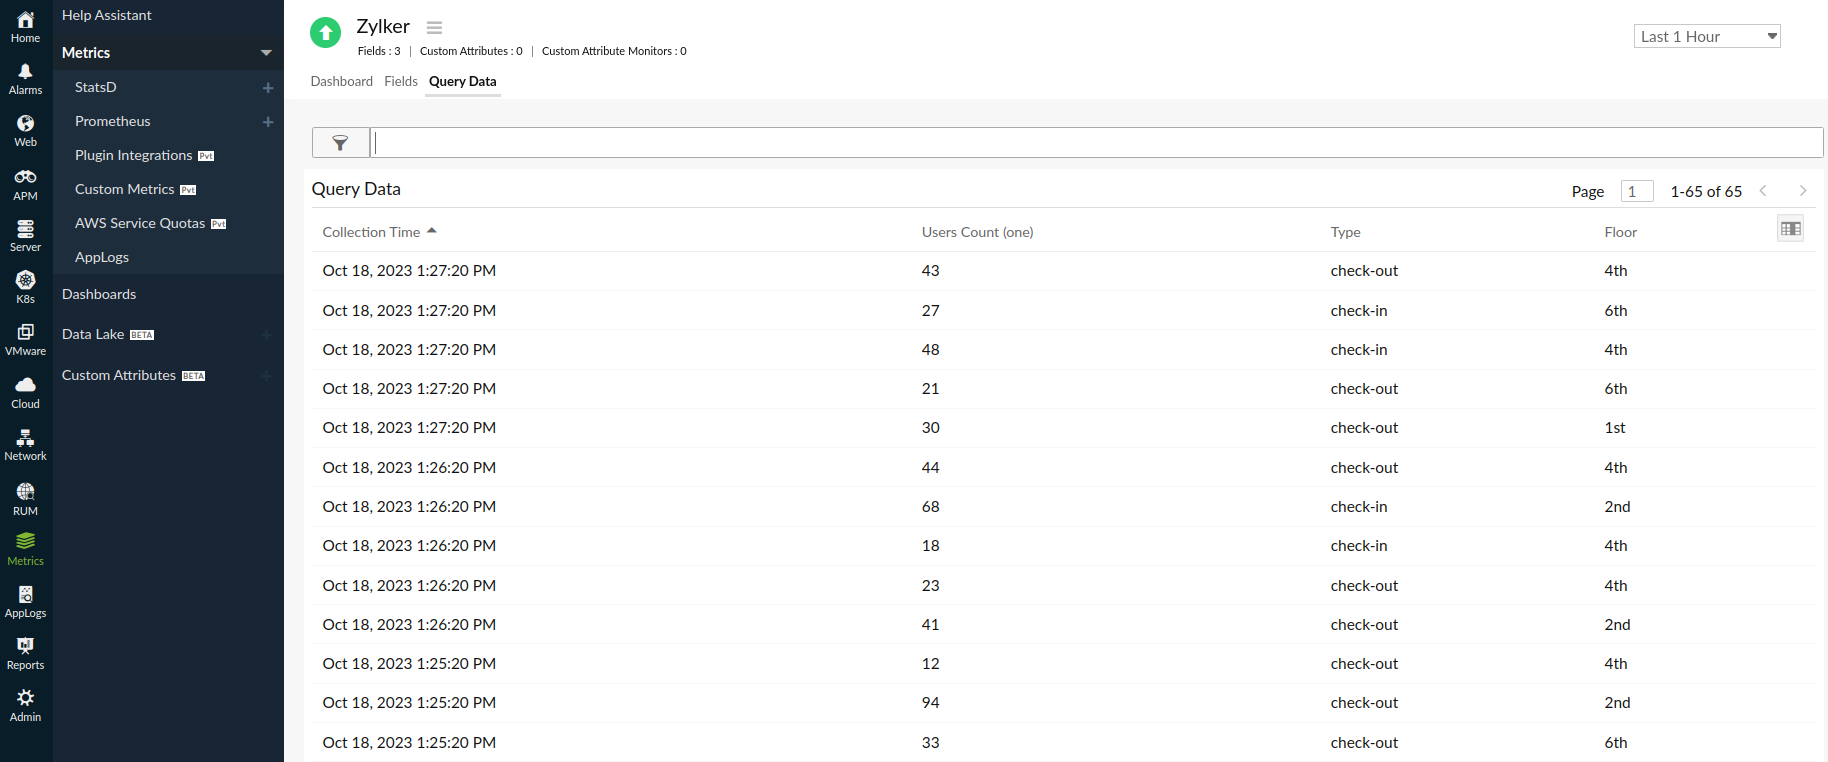
Query Data tab
This tab gives a detailed data report of the respective data lake monitor for the chosen time period.
You can perform a quick search by simply entering a valid SQL query into the filter box.
Alerts tab
The list of custom attributes configured is displayed here. You can also view the real-time status of each, aggregated value, name of the data lake monitor to which it belongs, configured filter, and aggregation type.
This tab will appear only if you configure Custom Attributes for any of the fields in your Data Lake Monitor.
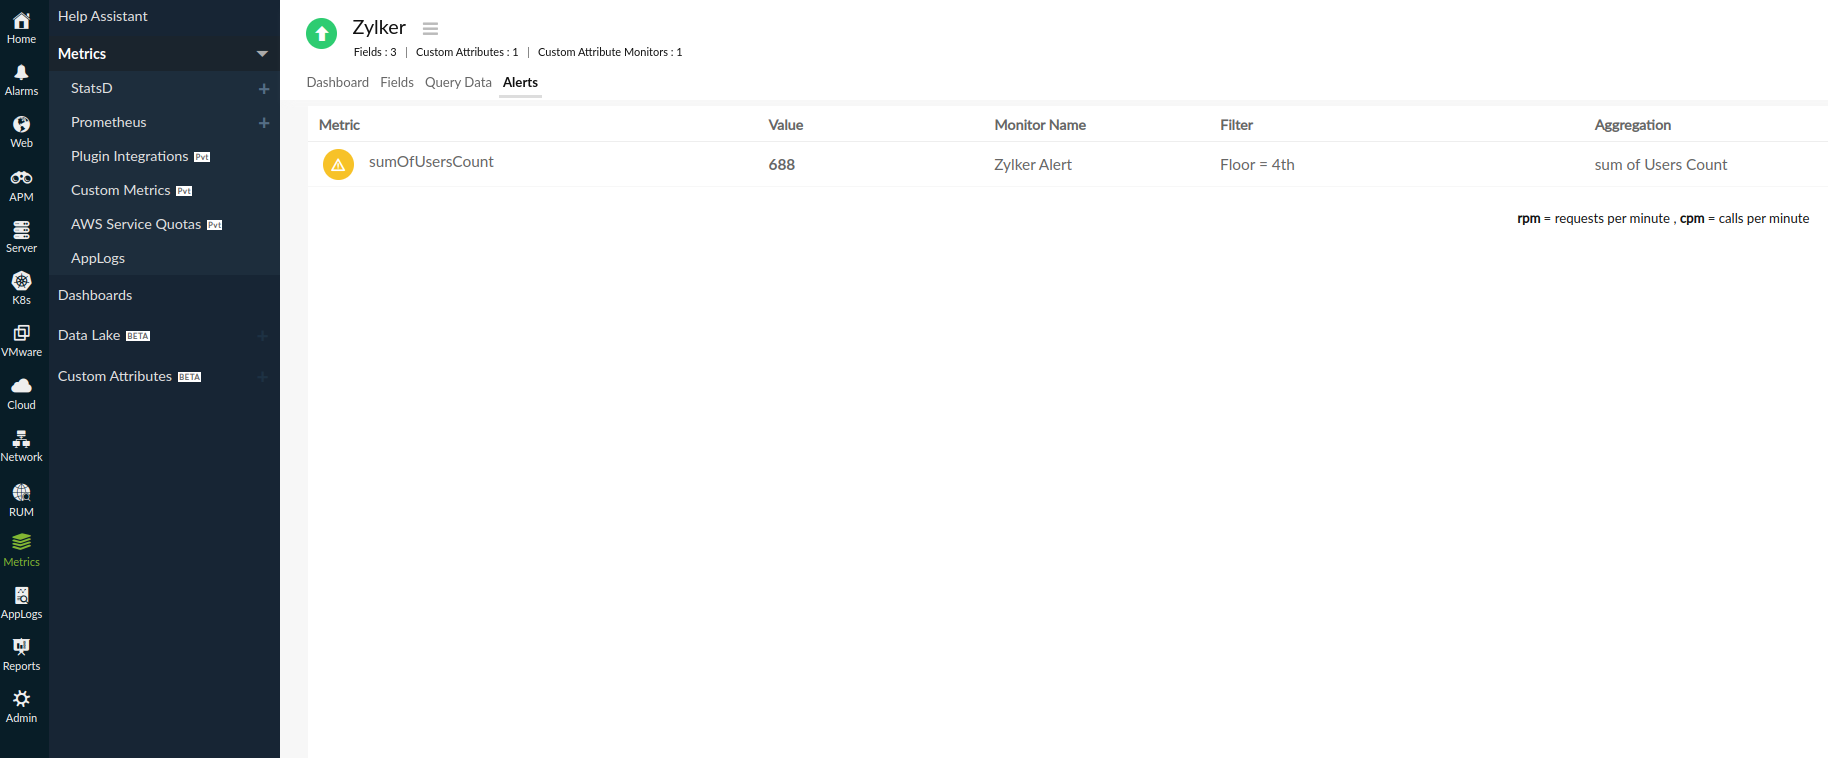
You can also create a Custom Attributes monitor for certain key metrics of a data lake monitor for which you need alerts.
-
On this page
- Dashboard tab
- Fields tab
- Query Data tab
- Alerts tab