Help Docs

Data Lake

A data lake serves as a central storage repository where you can securely store extensive amounts of structured and unstructured data on a large scale. This data is typically stored in its raw, original format and can be used for various data analytics and processing purposes. It's often used for big data analytics, machine learning, data mining, and more.
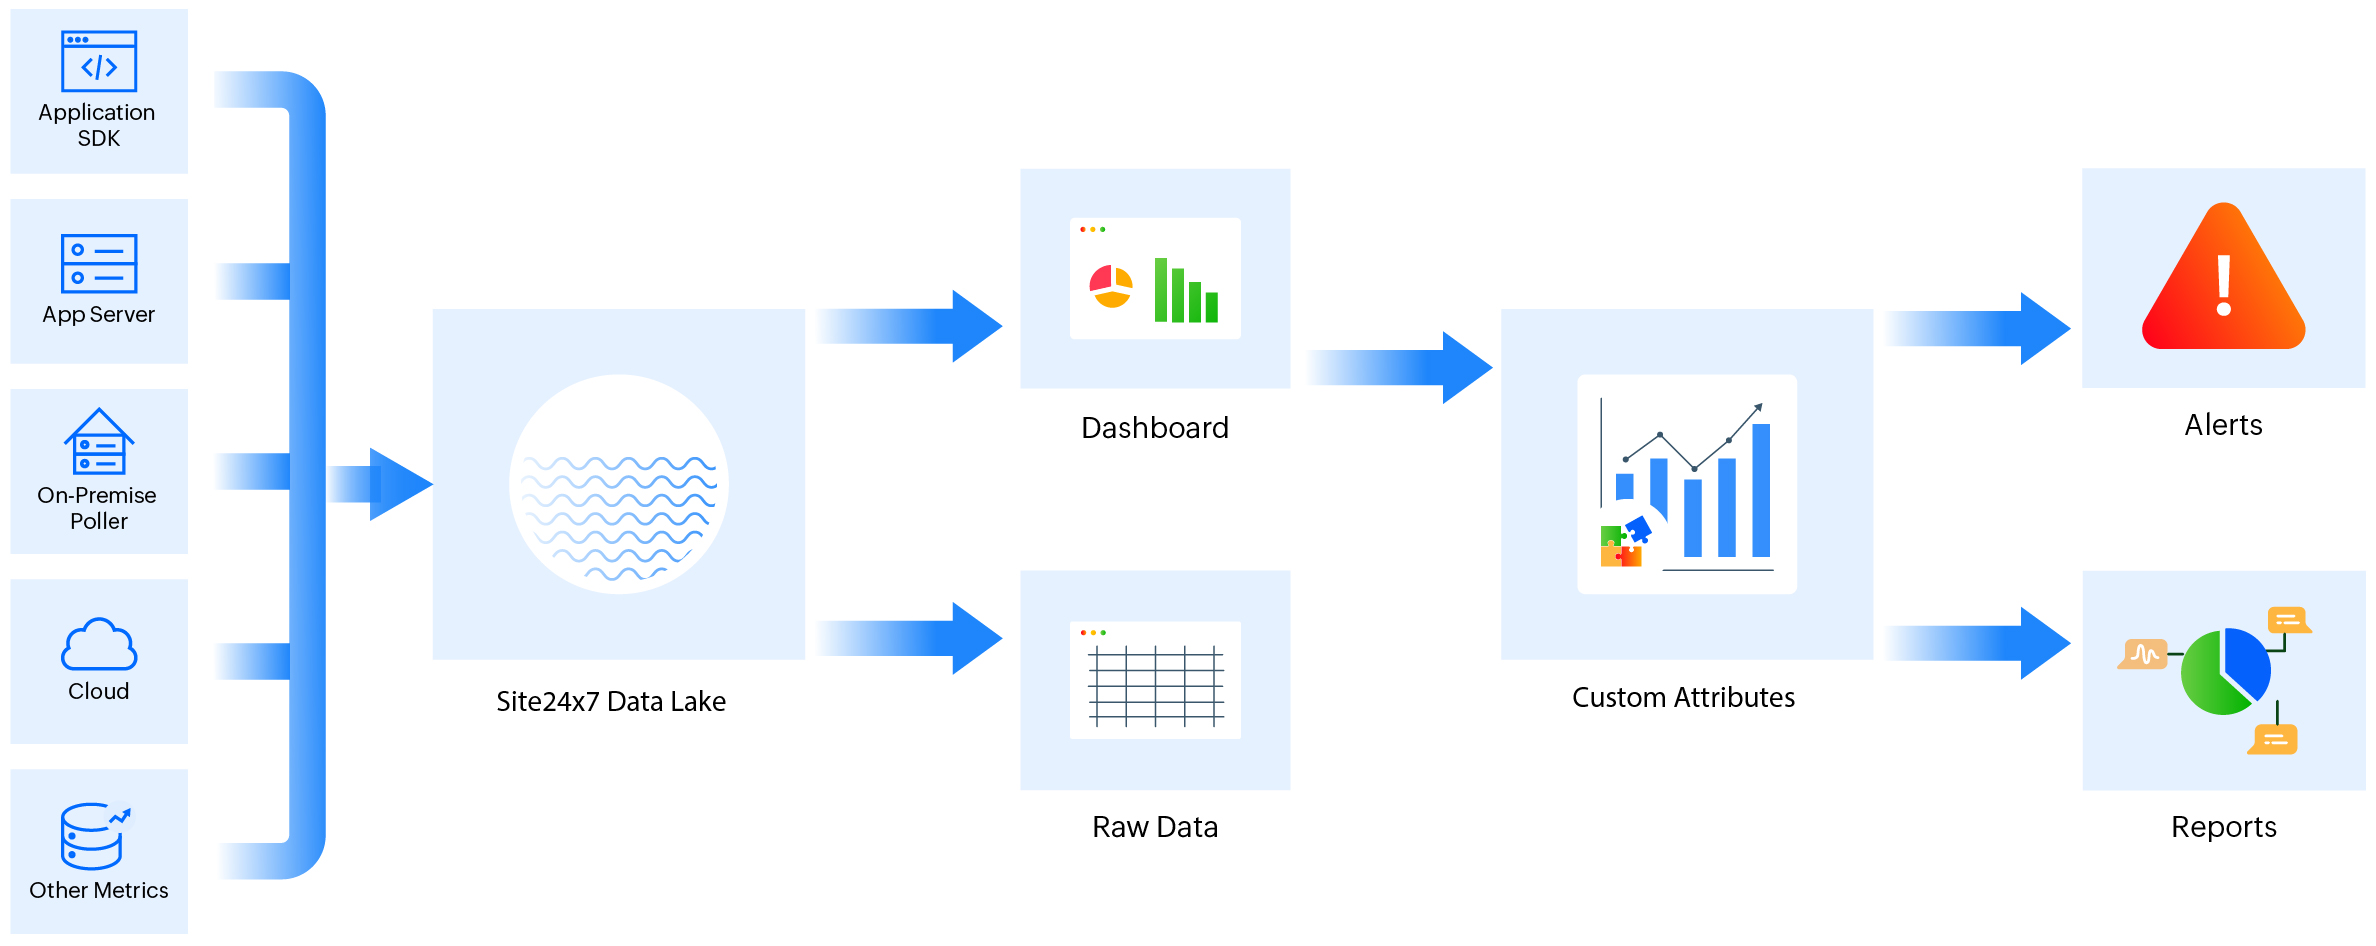
Site24x7's Data Lake feature supports the creation of Custom Metrics monitors, allowing data to be pushed through API or SDK.
Use case

Consider an e-commerce platform where critical user journey metrics like product searches, shopping cart activity, check-in, and checkout processing can be stored. Customized dashboards can be created to visualize these metrics through charts, graphs, and tables, aiding in the identification of performance trends and bottlenecks. Furthermore, with the Custom Attributes feature, custom alerts and notifications can also be configured to proactively address issues, such as high cart abandonment rates or slow payment processing, ensuring a seamless shopping experience.

Benefits of a data lake

The Site24x7 Data Lake feature enables you to define and track metrics that are specific to your application and its unique requirements. 

  • Tailored monitoring: You can track any application-specific metric in addition to what Site24x7 provides by default.
  • Granular visibility: You can monitor specific parts of your application's code, third-party integrations, or other components that are particularly important to your application.
  • Customized dashboard: You can create your own dashboard that includes various visualization options like numeric charts, graphs, and tables to generate illustrations that help you understand the metrics.
  • Alerting and notifications: You can set up custom alerts and notifications based on these metrics.
  • Flexibility: You can adapt and create new custom metrics to monitor different aspects of your application that become important over time.

Add Data Lake monitor

To add a Data Lake monitor, follow the steps below:

  1. Log in to the Site24x7 web client.
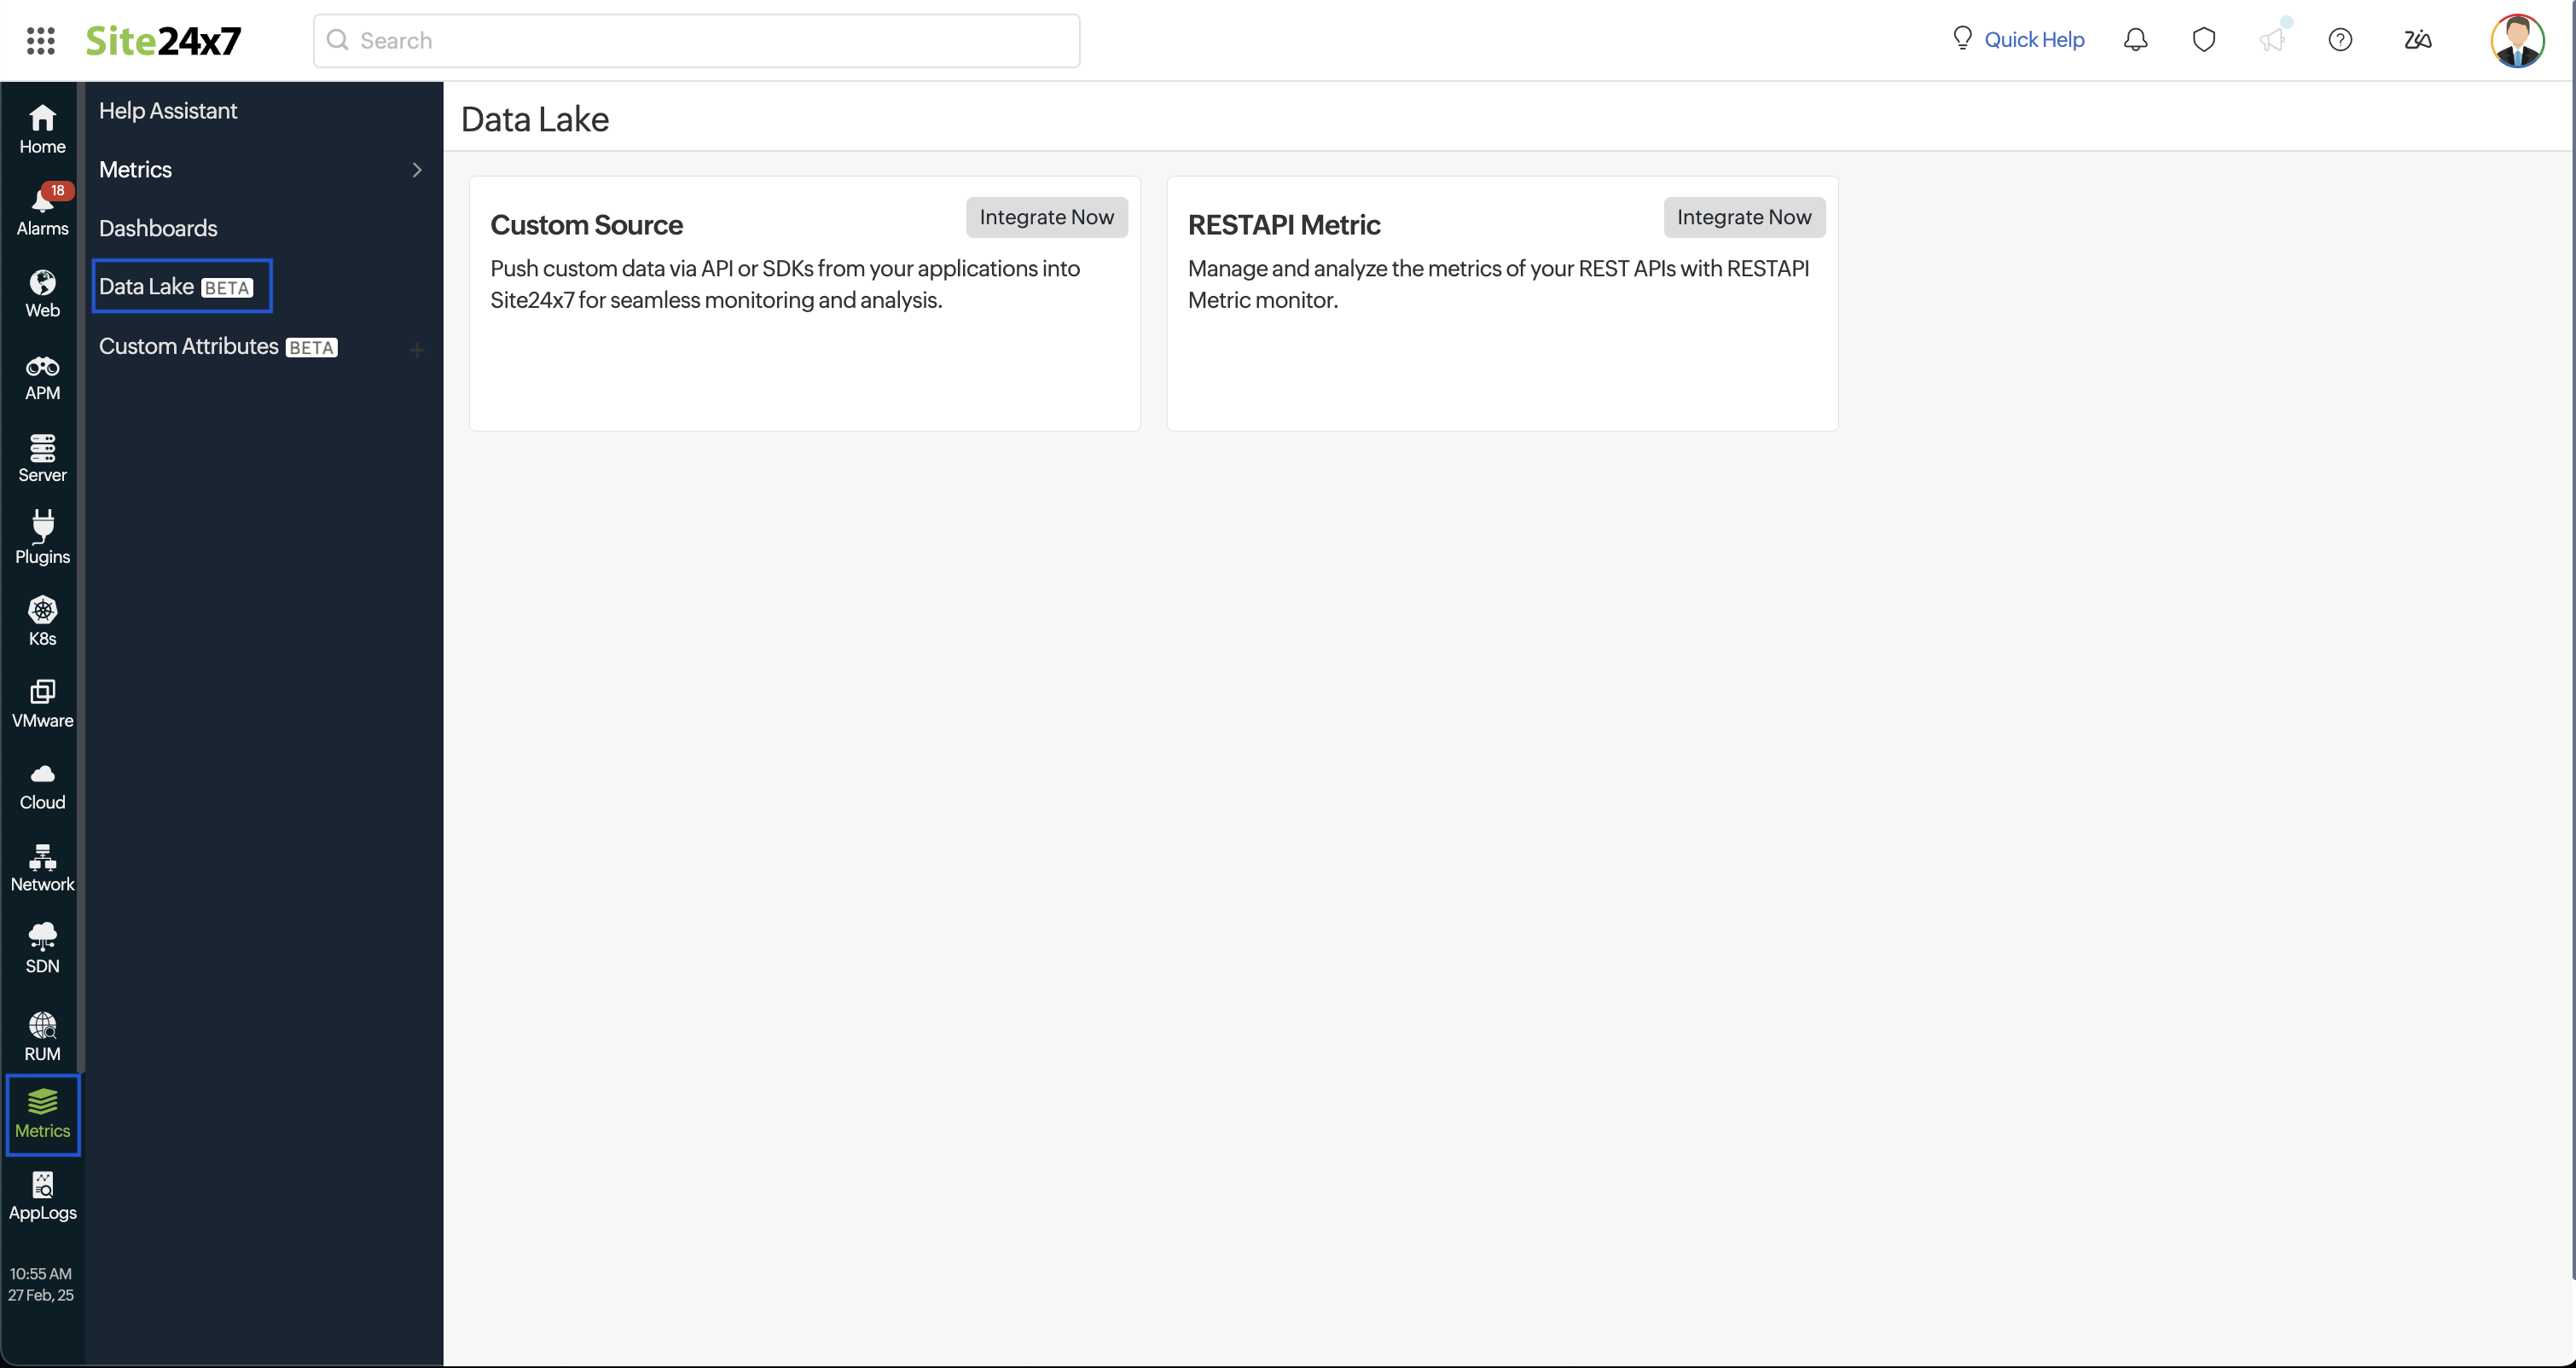
  2. Navigate to Metrics > Data Lake and then click the (+) icon.
  3. Provide a Display Name, which will be the name of your monitor.
  4. If you want a template of your monitor with the field details, set Send template to mail to Yes, otherwise No.

Add fields

The fields can be added individually, or in bulk by selecting Add Field or Bulk Addition.

Note
Each monitor can have a maximum of 1 numeric and 50 string fields.

Add Field option

This option is used to add fields one by one.

  1. Name

    Provide a name for the field.
  2. Type

    String: String fields, also called tags, can be used to filter numerical data.

    Numeric: Each monitor should contain at least one numeric field.

    Note
    Each Data Lake monitor can accommodate a maximum of 50 string fields and 1 numeric field.
  3. Select Unit

    Note
    It will only be enabled if the Numeric type is selected.
    You can choose from the following units.
    1. Time is measured in milliseconds, seconds, and so on.
    2. Size is measured in bytes, KB, MB, GB, and so on.
    3. Count is measured in ones, thousands, lakhs, millions, billions, and trillions.
  4. Select Metric Type

    Note
    It will only be enabled if the Numeric type is selected.
    The following metric submission types are accepted:
    Count
    The Count metric indicates the total number of event occurrences within a specific time frame.
    Rate
    The Rate metric measures the number of event occurrences within a specific time interval. 
    Gauge
    The Gauge metric represents a snapshot of events for a given time interval. This value is the last value submitted to the SDK during that time interval.
    Histogram
    The Histogram metric calculates and stores various metrics such as Total, Count, and Percentiles (0, 50, 95, 99, 100) for an array of events. This type of metric can help identify anomalies during specific periods of the event.
    Note
    A detailed description of Metric Types can be found in the UI.
  5. Click Save.
Note
  • If you want to add more fields, repeat the above steps. 
  • The list of fields added will be displayed under Fields Configuration.

Bulk Addition option

If you want to add a large number of fields at once, follow the steps below:

  1. Click on Bulk Addition.
  2. Paste the JSON code and click Validate.
    Sample code for bulk addition:
    [
        {
          "name": "users count",
            "type": "numeric",
            "format": "count",
          "metric_type": "count"
      },
        {
          "name": "Type",
            "type": "string"
        },
        {
          "name": "Floor",
            "type": "string"
      },
    ]
  3. If the code is error-free after validation, the Save button will be enabled.
    Note

    If the Save button is not enabled after clicking the Validate button, you must recheck the code for errors and update it.

  4. Click Save.
    Note
    The list of fields added via Bulk Addition will be displayed under Fields configuration.

Fields configuration

The various fields that have been added are listed here, along with their Type

Note
You can remove any fields that are not required by clicking the delete button.
  1. Once you finish adding the fields, Click Save.
    You will be redirected to the dashboard, where you can see the newly created monitor.
  2. You are all set. You must now push data to the newly added monitor.

Data lake dashboard

Once you've successfully added a data lake monitor, you'll be directed to the data lake dashboard. You can also access it by navigating to Metrics > Data Lake.

Get a holistic view of your Data Lake monitors. The dashboard categorizes your monitors based on their status (Up, Trouble, Critical, or Down).

Monitors view

Gives an overall summary of the Fields Count, Custom Attributes Monitors Count, and Custom Attributes Count

Edit monitor

You can add/remove fields or update the details of the existing fields.

  1. Click the hamburger icon (Hamburger icon) beside the monitor name. Click Edit.
  2. In the Edit Data Lake Monitor page, you can add or remove the required fields.
  3. Save your changes.

Delete monitor

You can delete any data lake monitor that is no longer needed.

  1. Click the hamburger icon (Hamburger icon) beside the monitor name.
  2. Click Delete.

Fields view

Gives a comprehensive list of all the fields from all monitors. You can view details like Monitor Name, Field Type, Last Polled Value, and Last Polled Time.

Import data to the created monitor

You can push data via API or SDK:

Push data via API

This option is used to push the aggregated data.

  1. Go to the data lake monitor listed and click on it.
  2. Hover over the hamburger icon (Hamburger icon) next to the monitor's name.
  3. Select Show Post URL from the drop-down menu.
  4. Follow the on-screen instructions.
    Note
    Sample Payload:
    {"values":[{"numeric_data":
    [{"name":"Users Count","count":1,"value":0}],
    "time_stamp":1697107024462,
    "tags":{"Type":"data"}}]

    Where,

    • count is the number of values aggregated. This field is optional, and the default value is 1.
    • value is the aggregated value. The aggregate calculation should be done based on the Metric Type (Count, Rate, Gauge, and Histogram) you chose.

Push data via SDK

This option is used to send raw data (unaggregated data), and the aggregation will be done at our end.

Step 1: Add/Set up the SDK to your application

Note

You must have the SLF4J jar in your application for logging purposes. If you haven't added the jar, please do so.

  1. Go to the Maven Central Repository.
  2. Add the dependency into your application based on your build framework. 
    Note
    You can also download and add the SDK jar to your application.

Step 2: Create the object of SDK MetricProvider

Create a MetricProvider object with the Site24x7 exporter using the MetricProviderBuilder class. This object is used to push metric data.

Note

For a single application, a sole license key is applicable. Even if you create a new object within the same application, it will continue to utilize the initial license key rather than obtaining a new one.

MetricProviderBuilder metricProviderBuilder = new MetricProviderBuilder();
metricProviderBuilder.withExporter(new Site24x7Exporter("<Your license key>"));
MetricProvider metricProvider = metricProviderBuilder.build();


Step 3: Provide raw data to the SDK

Specify the accurate method to properly aggregate the values of the defined field.

Count

metricProvider.count(
    "<app key>", // The app key associated with the Data-lake monitor
    "db_write", // The metric name (field name)
    2.0, // Numerical value of the metric
    Collections.singletonMap("host", "192.168.10.254") // Set of tags to associate with the metric
);

Rate

metricProvider.rate(
 "<app key>", 
 "disk_free",
  16868264.0,
  Collections.singletonMap("host", "192.168.10.254")
);

Gauge

metricProvider.gauge(
 "<app key>", 
 "disk_free",
  16868264.0,
  Collections.singletonMap("host", "192.168.10.254")
);

Histogram

metricProvider.histogram(
 "<app key>", 
 "disk_free",
  16868264.0,
  Collections.singletonMap("host", "192.168.10.254")
);

Where,

  • disk_free is the numeric field.
  • Collections.singletonMap ("host", "192.168.10.254") is the String field, which is optional.
  • The default values for units are as follows:
    • ms for Time
    • Bytes for Size
    • Ones for Count
Next Step

You can click on the required monitor to view the performance metrics.

Related article

Custom Attributes

Was this document helpful?

Would you like to help us improve our documents? Tell us what you think we could do better.


We're sorry to hear that you're not satisfied with the document. We'd love to learn what we could do to improve the experience.


Thanks for taking the time to share your feedback. We'll use your feedback to improve our online help resources.

Shortlink has been copied!