Azure Cosmos DB for MongoDB (vCore) monitoring configuration
Site24x7’s Azure Cosmos DB for MongoDB (vCore) monitoring provides comprehensive visibility into the performance, availability, and usage of your Cosmos DB instances configured for the MongoDB. By collecting critical metrics and delivering actionable insights, Site24x7 ensures that your database workloads remain optimized and reliable.
Key features
Site24x7’s Azure Cosmos DB for MongoDB (vCore) monitoring integration supports tracking:
- Resource utilization: Monitor CPU, memory, and committed memory usage to identify resource constraints.
- Performance metrics: Track IOPS, autoscale utilization, and Mongo request duration for performance tuning.
- Storage insights: Keep an eye on storage usage and capacity trends to avoid overages.
- Alerts and Root Cause Analysis: Get notified about anomalies like high CPU, memory pressure, or storage thresholds.
")
Setup and configuration
You can add Azure Cosmos DB for MongoDB (vCore) services while adding a new monitor, or you can add it to an existing Azure monitor. Follow these steps to add the service.
Supported metrics
| Metric name | Description | Statistic | Unit |
|---|---|---|---|
| CPU Percent | The average percentage of CPU resources consumed by the Cosmos DB instance. | Average | Percentage |
| Memory Percent | The average percentage of memory used by the Cosmos DB instance. | Average | Percentage |
| Committed Memory Percent | The average percentage of committed memory compared to the available memory. | Average | Percentage |
| IOPS | The average number of input/output operations performed per second. | Average | Count |
| Autoscale Utilization Percent | The percentage of autoscale throughput currently utilized. | Average | Percentage |
| Storage Percent | The average percentage of allocated storage currently in use. | Average | Percentage |
| Storage Used | The average amount of storage consumed by the database. | Average | Bytes |
| Mongo Request Duration | The average time taken to process MongoDB requests. | Average | Milliseconds |
Threshold configuration
Associating a threshold profile can be done from the monitor's Edit page:
- Under Configuration Profiles > Threshold and Availability > select the corresponding threshold profile from the drop-down.
The changes made to this threshold profile will be applied to all the associated monitors. You can either add or edit a threshold profile by clicking the plus icon + or pencil icon , respectively.
Bulk Action
Bulk association of threshold profiles can be done from the Admin page (Admin > Inventory > Bulk Action > under Monitor Configuration, go to Modify Threshold Profile).
You can set threshold values for the metrics by selecting the Threshold and Availability option. You can also configure IT automation at the attribute level.
Default thresholds
Site24x7 alerts you based on a set of default thresholds. These default thresholds ensure that your database is not overutilized, thus maintaining optimal storage and performance. This also helps to reduce costs by ensuring you receive alerts for unusual changes. The default thresholds are as follows:
Metrics thresholds
- CPU Percent
- Memory Percent
- Autoscale Utilization Percent
- Storage Percent
- Mongo Request Duration
Onchange thresholds
- Alert if Provisioning State is Changed
- Alert if Performance Tier is Changed
- Alert if Storage Size GB is Changed
- Alert if Shard Count is Changed
- Alert if Public Network Access is Changed
- Alert if Replication State is Changed
IT automation
Site24x7 offers a set of exclusive IT automation tools to auto-resolve performance degradation issues. These tools react to events proactively rather than waiting for manual intervention.
How to configure IT automation for a monitor
Configuration Rules
With Site24x7's Configuration Rules, you can set parameters like Threshold Profile, Notification Profile, Tags, and Monitor Group for multiple monitors. These rules can be configured and run for the existing or new monitors (during addition) matching the given criteria.
How to add a configuration rule
Reports
Gain in-depth data about the various parameters of your monitored resources and accentuate your service performance using our insightful reports.
To view reports for an Azure Cosmos DB for MongoDB (vCore):
-
Navigate to the Reports section on the left navigation pane.
-
Select Azure Cosmos DB for MongoDB (vCore) from the menu on the left.
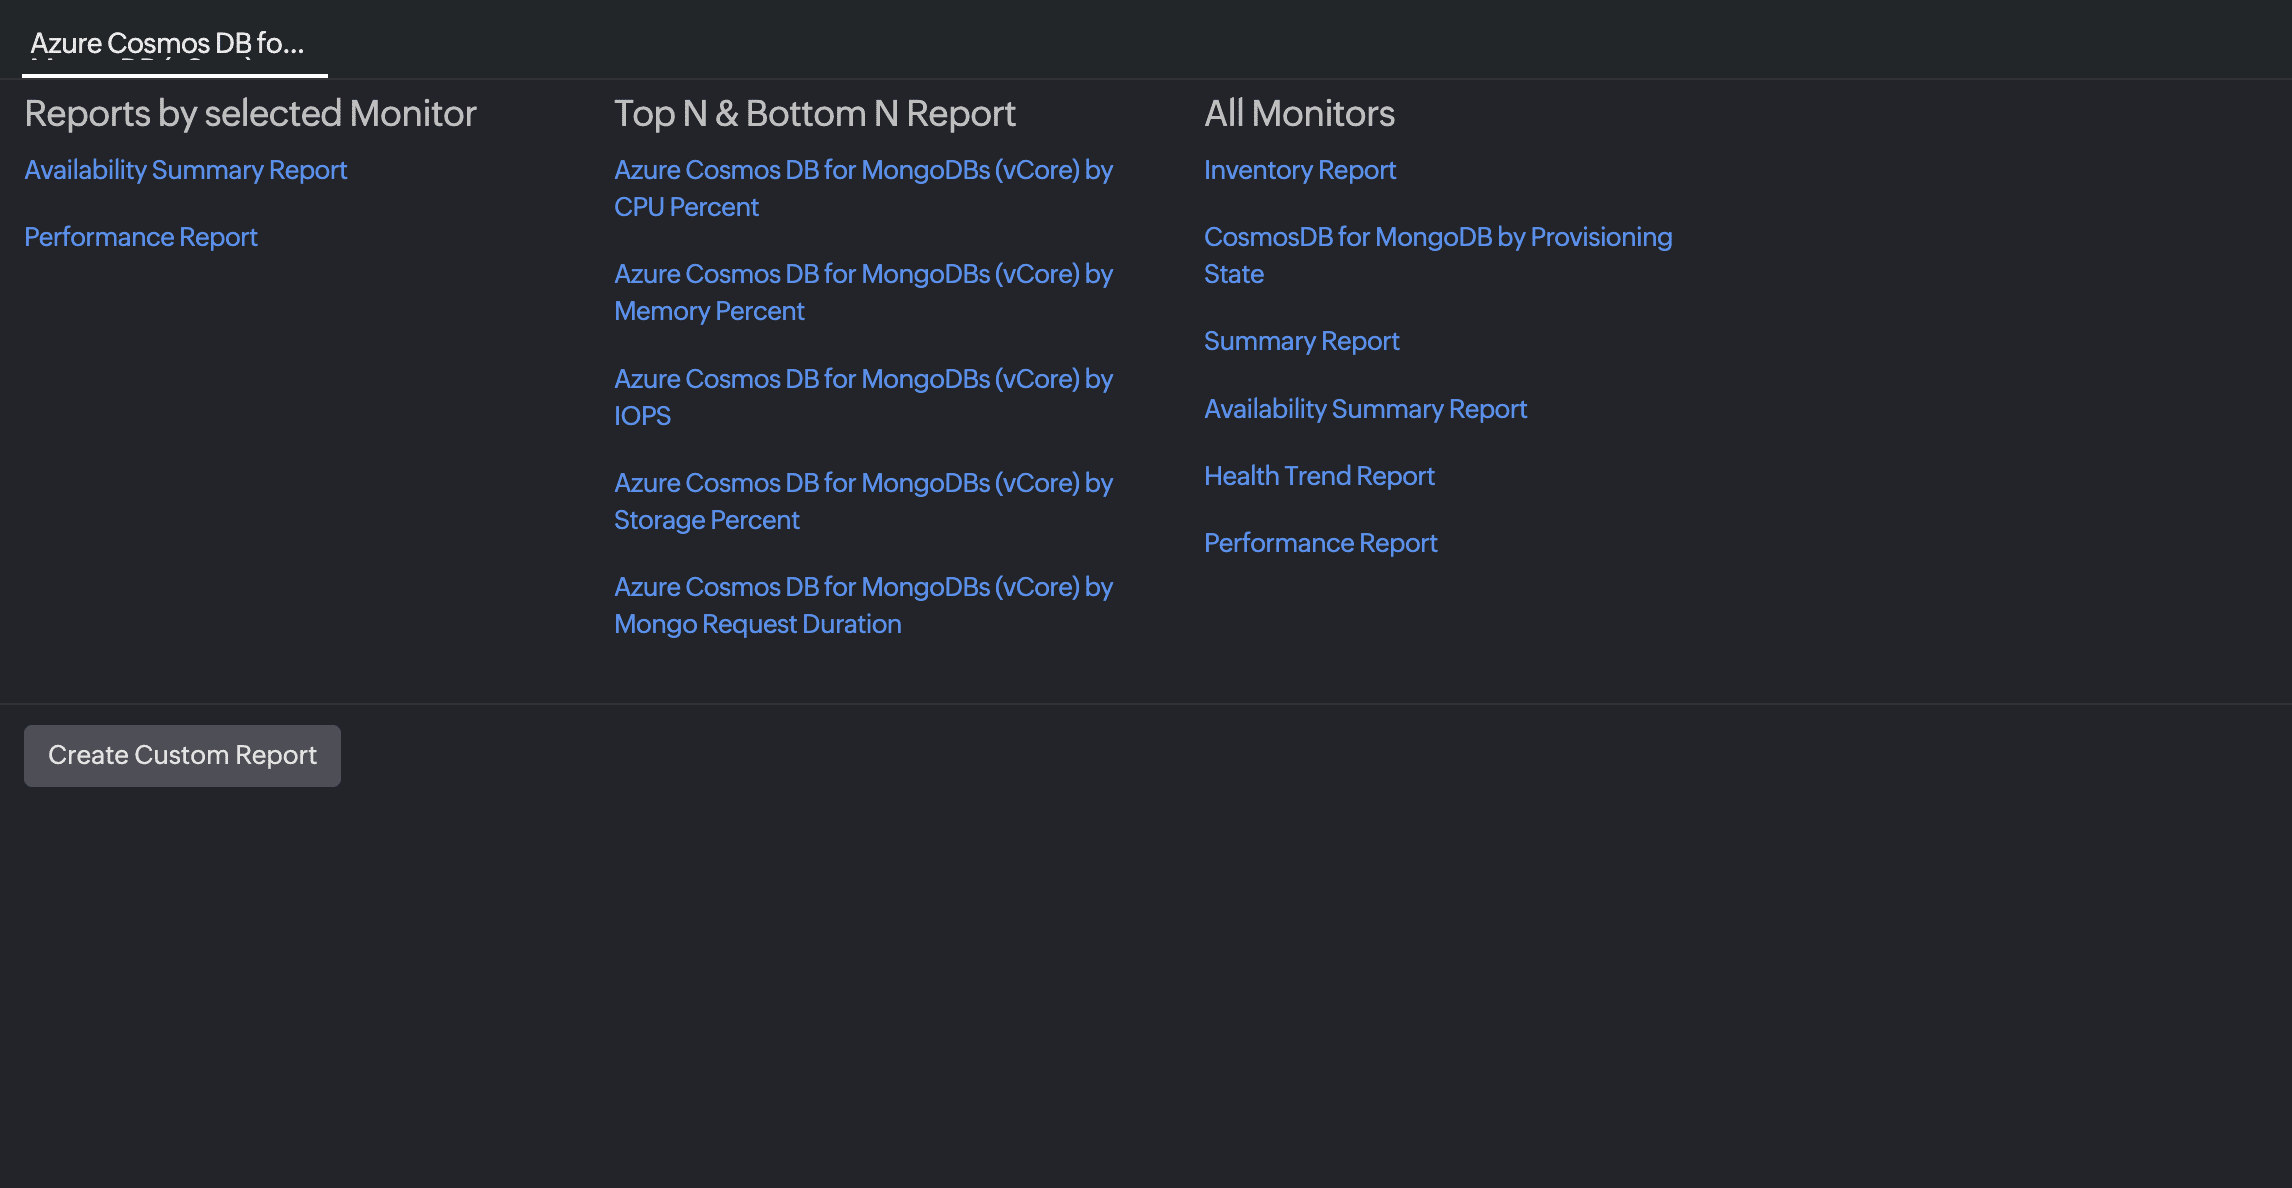
You can find the Availability Summary Report, Inventory Report, and Performance Report for one selected monitor, or you can get the Summary Report, Availability Summary Report, Health Trend Report, and Performance Report for all the Cosmos DB for MongoDB (vCore) monitors.
Schedule reports
You can also schedule the Inventory Report by navigating to Reports > Azure Cosmos DB for MongoDB (vCore) > Inventory Report and clicking the Share This button at the top-right corner. In the Schedule Report pop-up, choose the monitor, assign the desired frequency—daily, weekly, monthly, or quarterly—and receive the regular reports of your inventory details to the groups that you desire.
 Inventory")
Site24x7 Azure Cosmos DB for MongoDB (vCore) monitoring also provides an exclusive set of reports that will enable you to gain deeper insight into your resources.
These reports include:
-
CosmosDB for MongoDB by Provisioning State
Top N and bottom N reports
-
Azure Cosmos DB for MongoDB (vCore)s by CPU Percent
-
Azure Cosmos DB for MongoDB (vCore)s by Memory Percent
-
Azure Cosmos DB for MongoDB (vCore)s by IOPS
-
Azure Cosmos DB for MongoDB (vCore)s by Storage Percent
-
Azure Cosmos DB for MongoDB (vCore)s by Mongo Request Duration
You can also view the reports from the Summary tab of the Azure Cosmos DB for MongoDB (vCore) monitor.
By clicking on any chart title, you can also find the Performance Report of the monitor.