Infrastructure Events in Site24x7
In Site24x7, every event including a status change, threshold breach, anomaly detection, configuration update, or an application build change is recorded as an Infrastructure Event. These events are stored in Applogs and can be retrieved using queries. Infrastructure Events cover a wide range, including status-based events, performance events, availability events, inventory changes (such as an IP or CPU update), and application-level changes. This consolidated view makes it easier to analyze, and correlate events across your entire IT stack.
Use cases
- Track critical changes for operational awareness by capturing and reviewing events like configuration updates, IP changes, or CPU core modifications.
- Identify issues impacting system performance and uptime by pinpointing status-based events such as threshold breaches, anomalies, performance deviations, and availability drops.
- Accelerate problem resolution by storing and querying all infrastructure-related events for quick troubleshooting and analysis.
- Use Infrastructure Events as the foundation for linking related events and identifying root causes.
Accessing Infrastructure Events
Follow the steps below to view the Infrastructure Events:
- Log in to Site24x7.
- On the left navigation menu, navigate to Alarms > Infrastructure Events.
- Provide the query and time period to fetch the desired data.
Understanding Infrastructure Events
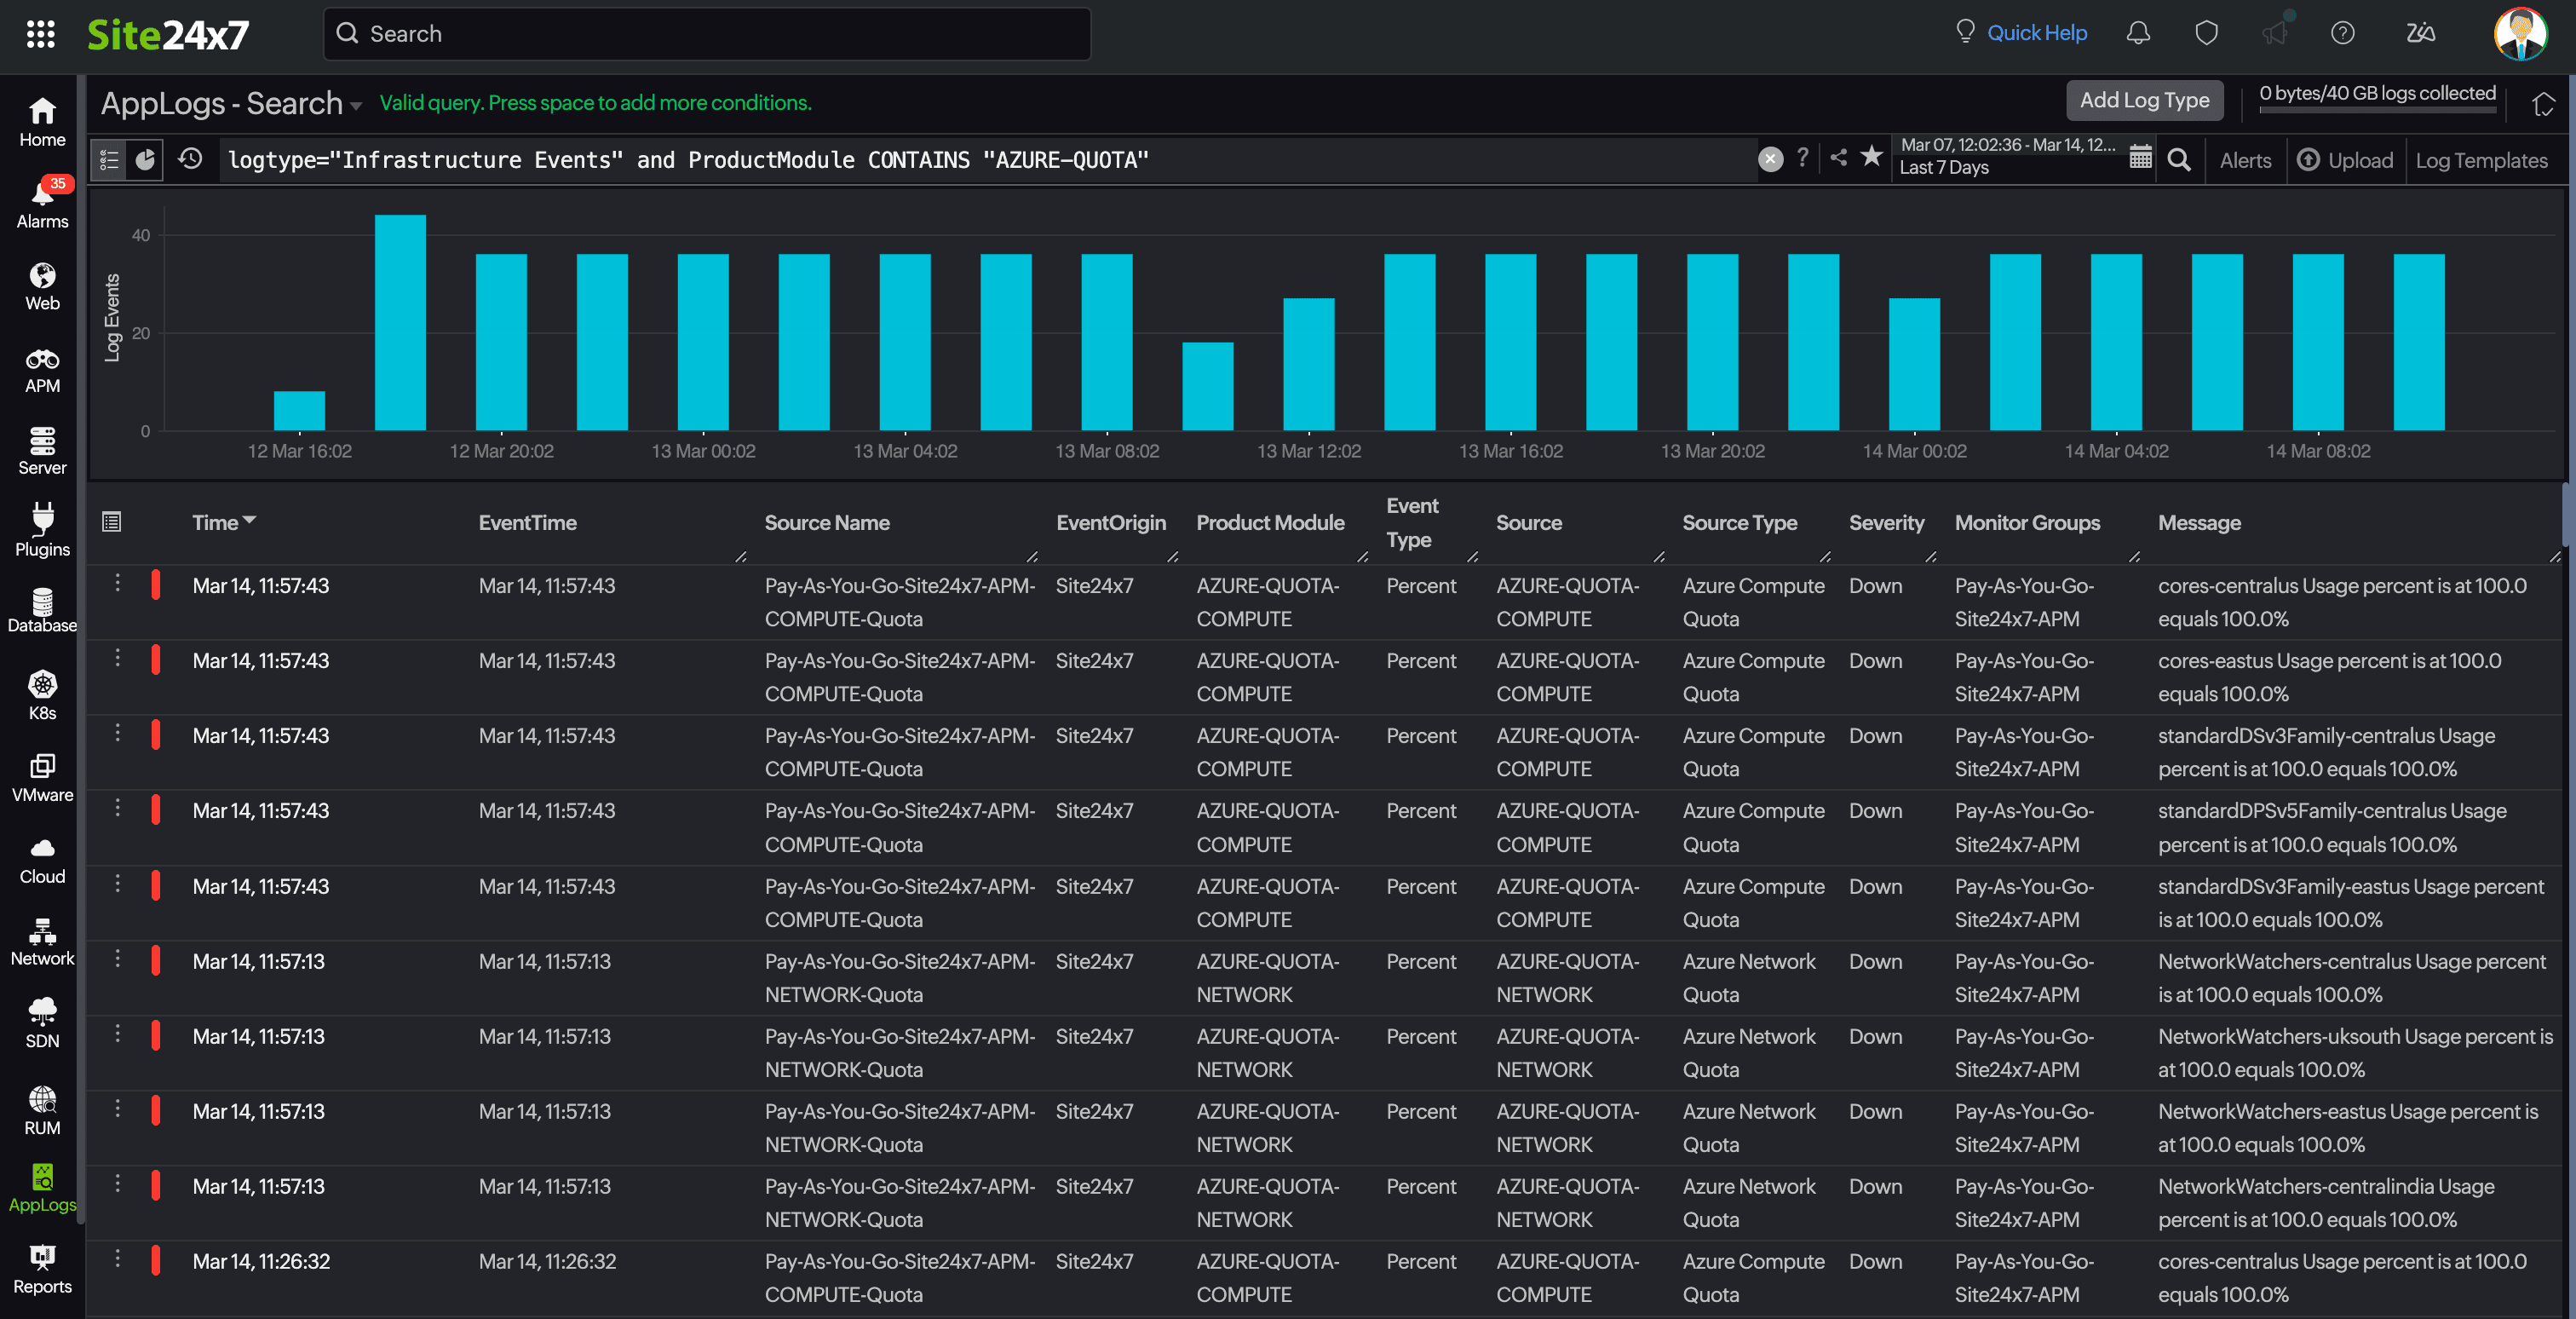
Apply a query-based filter to navigate through a large volume of data and view specific infrastructure event details. Once you enter the query you want, the appropriate Infrastructure Events are displayed.
There are two sections on this page:
Query section
You can perform the following actions using the icons in the query section:
- Switch between the Infrastructure Events page and a dashboard view of the Infrastructure Events using the Dashboard
 icon.
icon. - View previously saved log search queries using the
 icon. You can reuse the queries from the drop-down menu.
 - Click the Question Mark
 icon to learn how to generate queries.
 - Share the queried logs or view the history using the Star
 icon. You can email the Infrastructure Events as a PDF or download them as a PDF or CSV.
 - To generate a new query, use the correct query syntax.
- To enhance search and manage large log data in Infrastructure Events, refer to this documentation.
Event details
Click the Customize Columns ![]() icon to choose the columns you want to display from the list below.
icon to choose the columns you want to display from the list below.
| Column | Details displayed |
| Event Time | The time at which the event was triggered. |
| Source Name | The display name of the monitoring service from which the event originated. |
| Event Origin | The source system or component that generated the Infrastructure Event. |
| Product Module | The module or feature that generated the event. |
| Service Name | The service associated with the event. |
| Host | The host or IP address where the event occurred. |
| Event Type | The category of the event (e.g., status change, threshold breach, anomaly). |
| Source | The monitoring service from which the event originated. |
| Source Type | The type of resource (server, application, network device, or third-party). |
| Severity | The priority or impact level of the event (Up, Down, Critical, Trouble). |
| Tags | The tag associated with the monitor during alert generation. |
| Monitor Groups | The monitor group associated with the monitor during alert generation. |
| IP Address | The IP address of the resource associated with the event. |
| Message | A description detailing the event. |
| Event Layer | Indicates the layer of the infrastructure (such as network, application, or database) where the event occurred. |
| Technology | The associated technology based on the product module—for example, it shows Website for URL monitors, Network for Network Devices, or NCM. |
| Application Name | The specific application associated with the event. |
Here, you can switch between two views—Tabular and Raw Logs (logs in JSON format)—and also select from four different font sizes. Click +Create New View to customize and set a default view for infrastructure events.
Integrating third-party events with Infrastructure Events
Site24x7 allows you to correlate third-party events with existing infrastructure and application monitoring data, providing a holistic view of system health, speeding up root cause analysis, and ultimately reducing mean time to repair (MTTR).
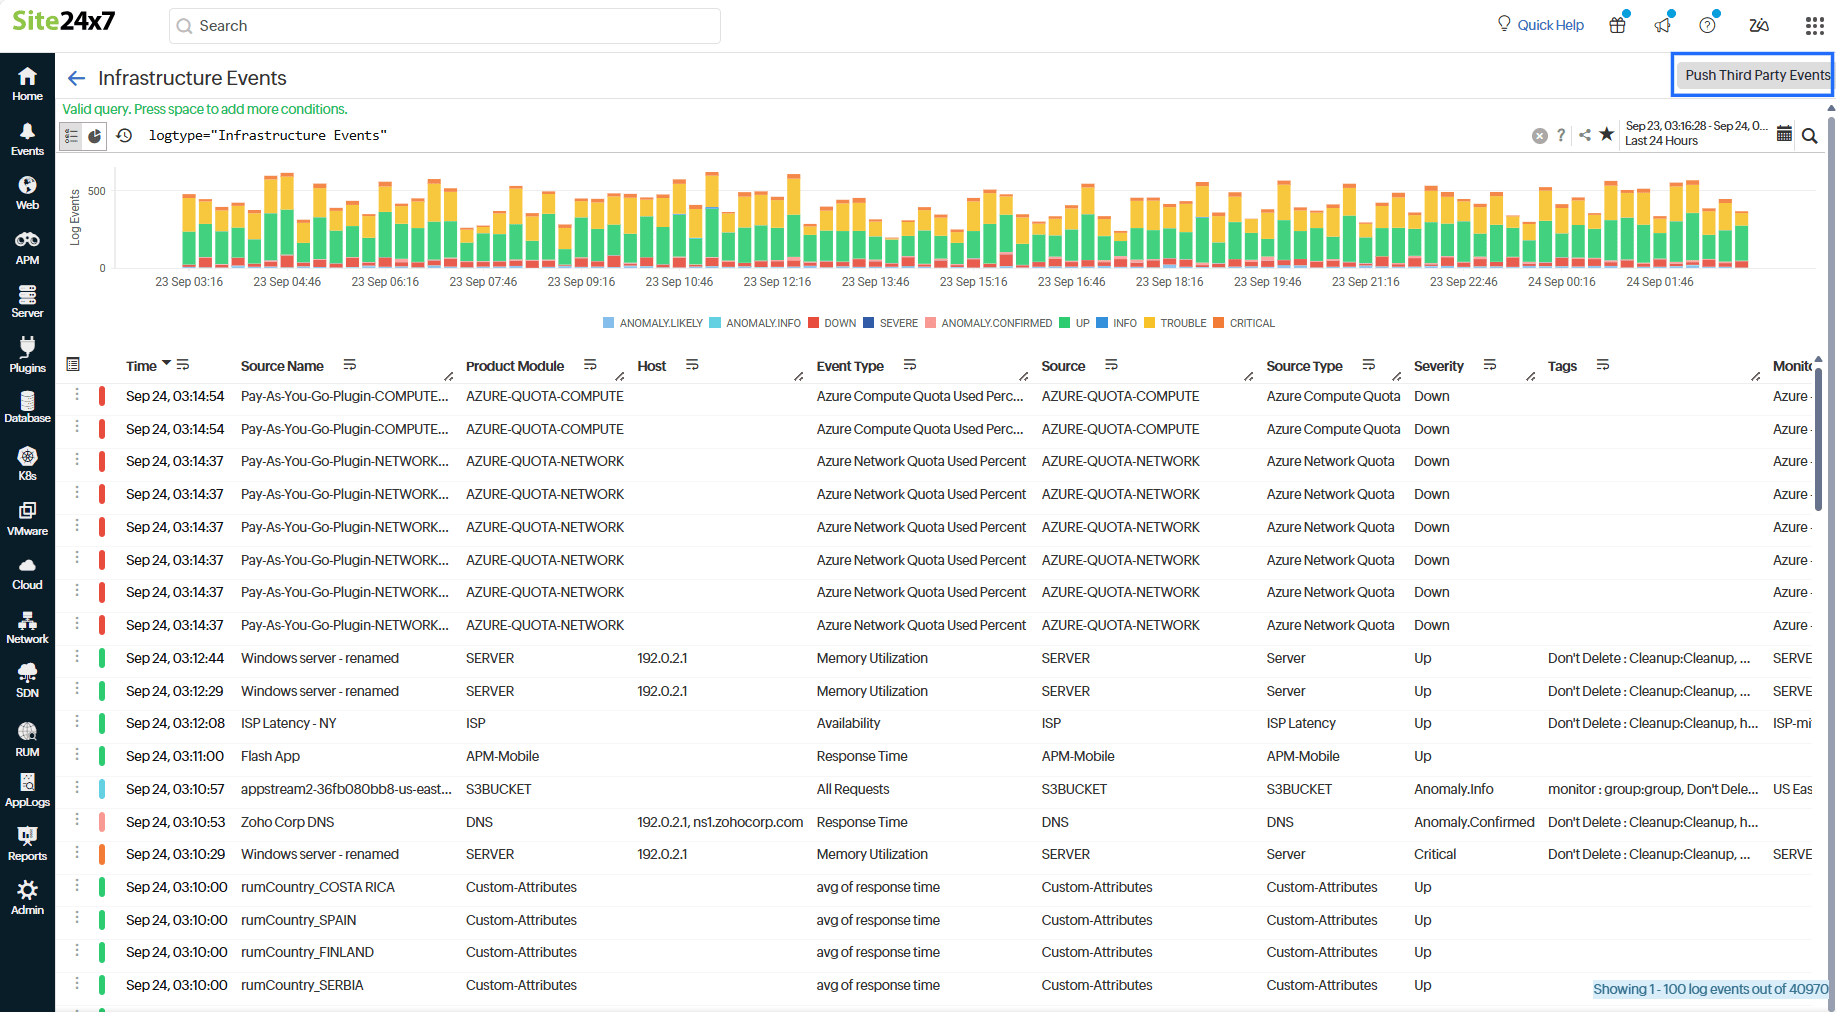
Follow the steps below to integrate external events with Site24x7 Infrastructure Events:
- Click Push Third Party Events on the top right corner.
- Obtain an OAuth token with: Site24x7.Integration.Create.
- Use the one_index_event API with the POST URL: http://www.site24x7.com/api/one_index_event.
- Add the relevant event information from your third-party tool in the request body (such as event type, severity, source, message, and timestamp).
- Submit the POST request to Site24x7.
- Once sent, the events are ingested into Site24x7, where they are tracked along with other infrastructure events.