by Deva Priya
Greetings!
Ever struggled to pinpoint issues inside your IBM WebSphere Application Server when response times rise or transactions begin to fail?
WebSphere environments rely on multiple components such as JVMs, thread pools, JDBC connections, EJBs, servlets, and messaging systems to process requests. Issues like memory pressure, stuck threads, or slow database interactions can quickly affect performance. Without clear visibility into these layers, identifying the root cause becomes time-consuming and complex.
To address this, we’re introducing Enterprise Application Monitoring for IBM WebSphere. It provides detailed insights into JVM behavior, thread activity, connection pools, and application components, helping you troubleshoot faster, optimize resource usage, and maintain consistent performance and availability.
With this feature, you can:
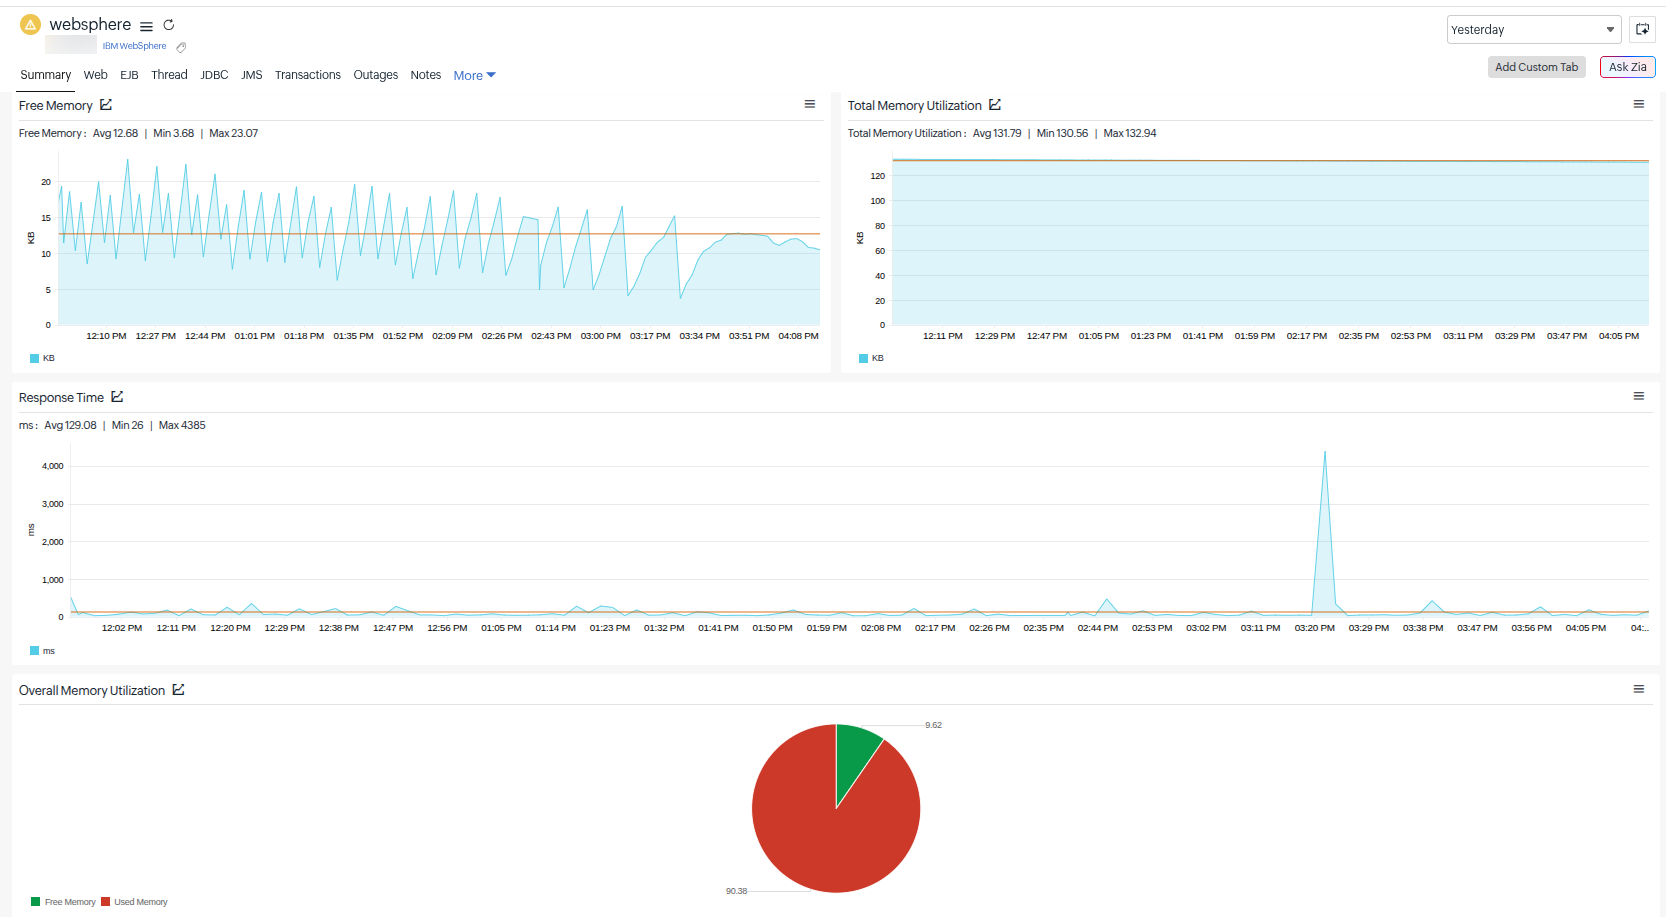
Monitor core system health
- Track CPU, JVM memory usage, and response time to assess overall server performance.
- Gain a unified view of resource utilization across JVM memory pool.
Analyze web application activity
- Keep an eye on active sessions, request load, and session life cycle.
- Detect session affinity issues or failover behavior.
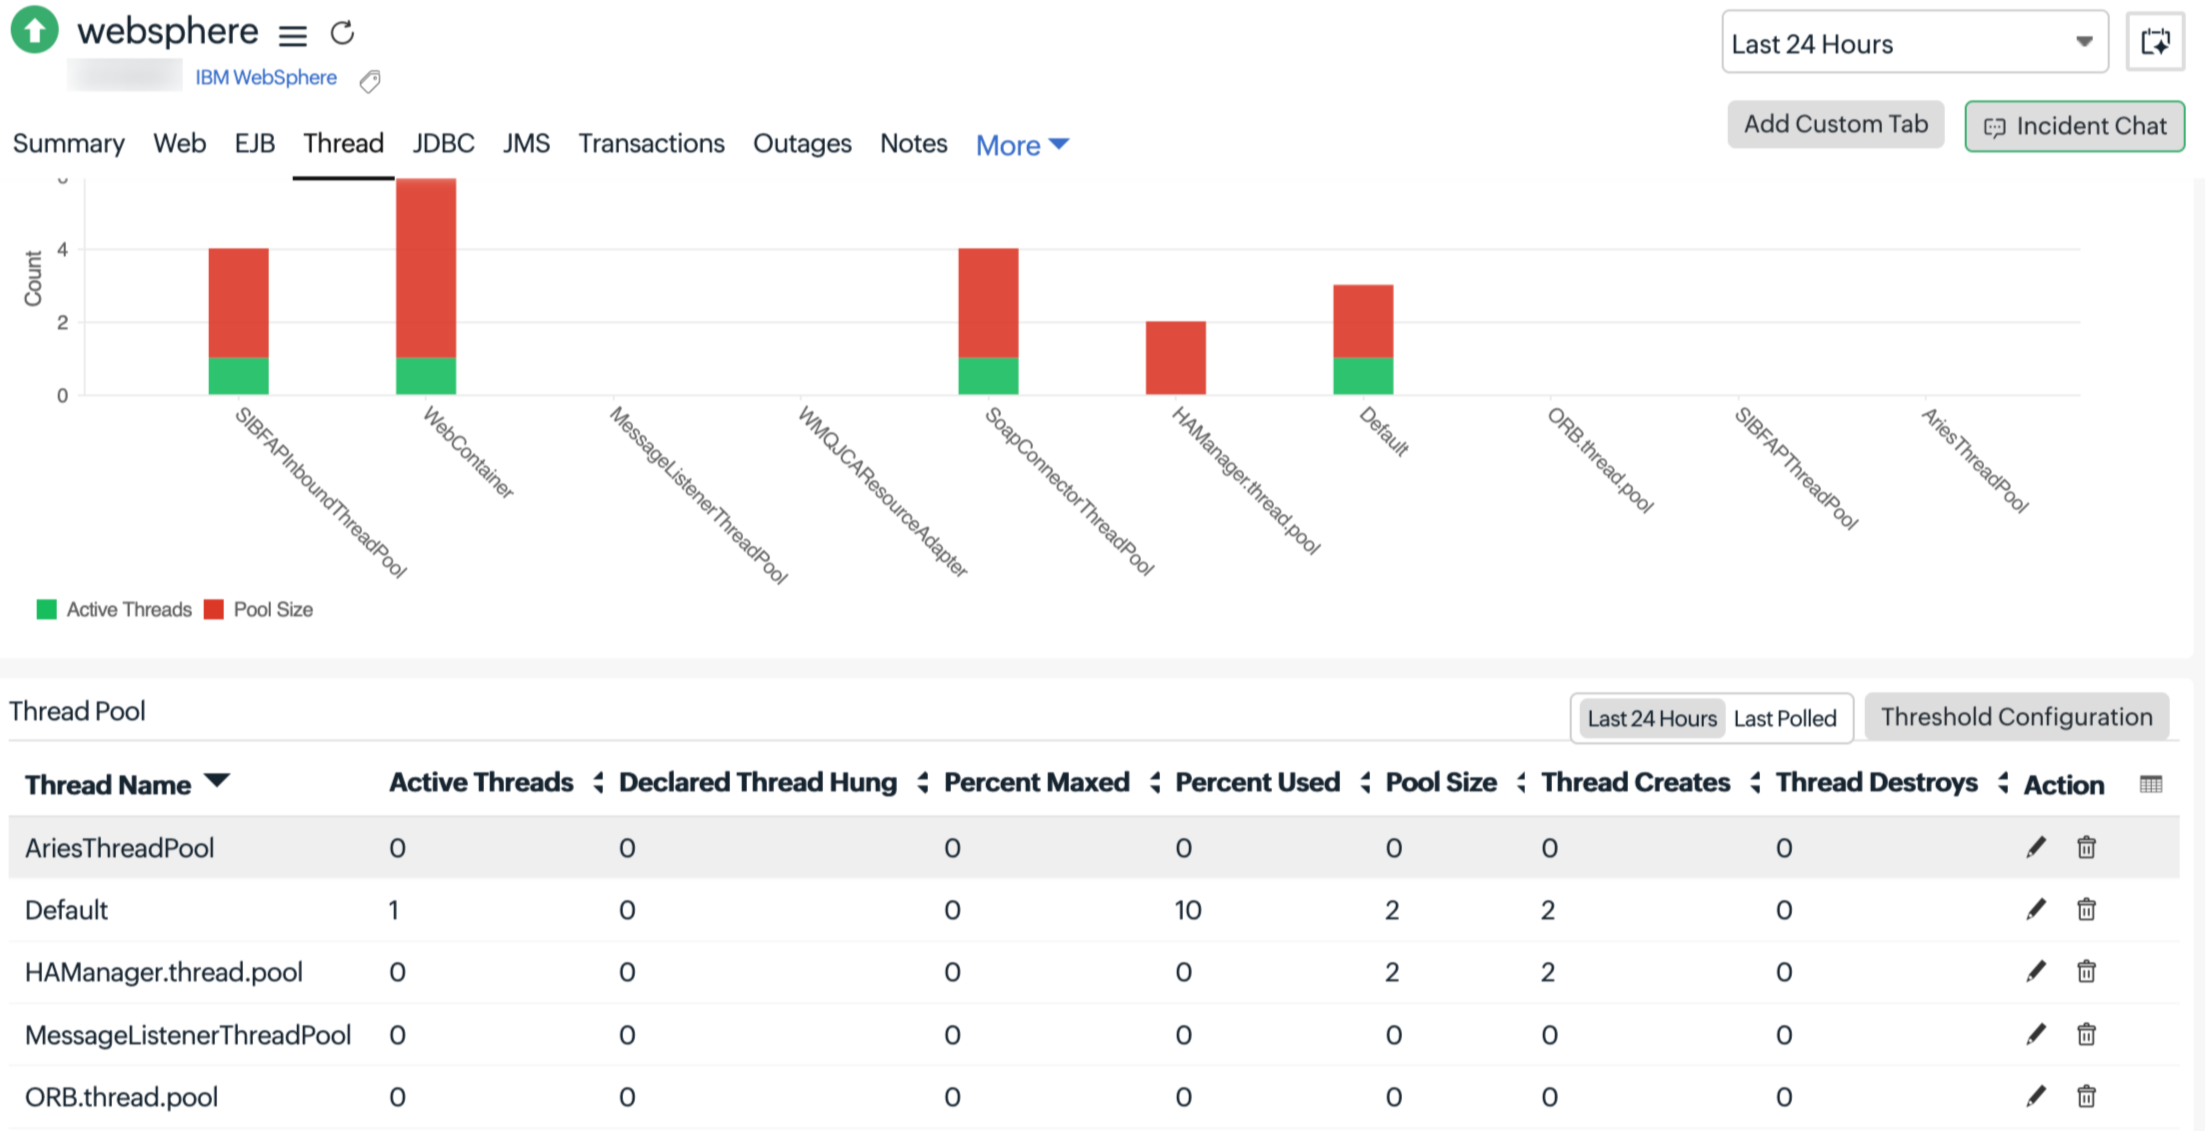
Identify thread bottlenecks
- Monitor thread pool utilization, active threads, and hung threads.
- Quickly pinpoint performance bottlenecks and thread exhaustion.
Optimize database interactions (JDBC)
- Track connection pool usage, wait times, and failures.
- Identify database contention and connection saturation issues.
Gain visibility into application components (EJB)
- Analyze EJB pool usage, method response time, and life cycle events.
- Understand business logic performance and execution delays.
Monitor messaging systems (JMS and Queues)
- Track message throughput, queue depth, and processing delays.
- Identify backlogs, slow consumers, and messaging bottlenecks.
Track transaction performance
- Monitor commit/rollback rates and transaction latency.
- Detect slow or failed transactions impacting business operations.
Enable proactive alerting and faster troubleshooting
- Receive real-time alerts on performance degradation.
- Reduce MTTR with actionable insights across all tiers.
Get started
- Navigate to Plugins > Enterprise Applications > IBM WebSphere.
- Set up your monitor using the On-Premise Poller and start exploring detailed performance metrics for your WebSphere environment.

This feature is supported from On-Premise Poller 6.8.4 onwards.
For more details, please refer to our help documentation.
Have questions or suggestions? Drop them in the comments. We’d love to hear from you!
Happy monitoring,
The Site24x7 team
Like (1)
Reply
Replies (0)