Navigating digital disruptions: Lessons from the Microsoft outage
The recent Microsoft-CrowdStrike outage serves as a stark reminder of the interconnectedness and fragility of our digital infrastructure. What began as a seemingly isolated issue with a software update rapidly escalated into a widespread disruption, affecting businesses across multiple sectors.
The incident highlights the potential cons...
The role of IT monitoring in digital transformation for Australian SMEs

Status page examples

Top IT challenges Australian SMEs must tackle for better operational efficiency

A guide to choosing the best cloud infrastructure monitoring tool
Top 7 best practices for monitoring your OpenShift environment

To ensure your OpenShift environment is healthy and stable, consider these seven tips:
Ensure your OpenShift platform is available at all times. Your monitoring tool is invaluable during these periods. Utilize node redundancy, multiple pod replicas, and load balancing. Regularly back up your monitoring data and configurations, and adjus...
The pros and cons of cloud-native infrastructure

Digital transformation and cost savings: How AI benefits Australian SMEs to enhance digital experience

Understanding Network Mapping with Site24x7
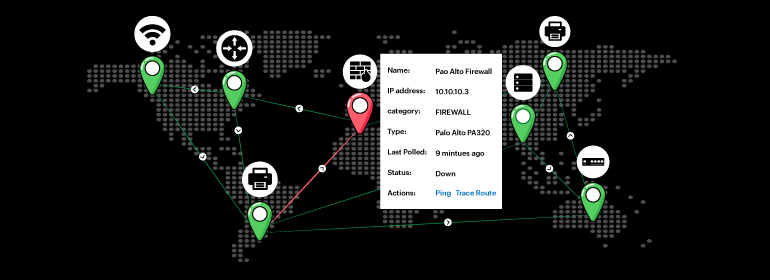
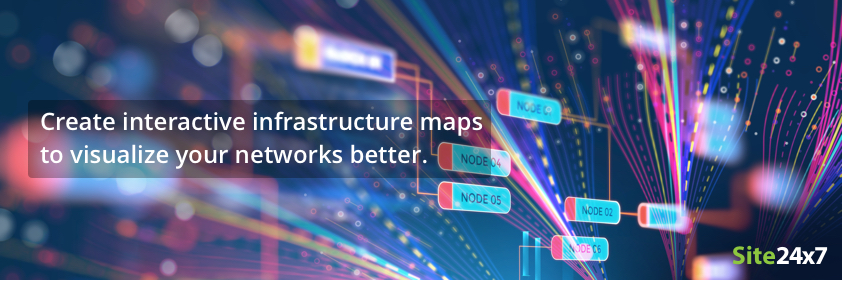
Infrastructure maps: Build and visualize custom network topology maps to dissect network outages and performance bottlenecks in your IT stack
The ability to visualize your IT infrastructure from end to end is critical in fostering successful operations and delivery of service. Being a network admin, you need to keep a close eye on all your network devices, whether they're across the globe or inside your data centers. However, this is difficult to do without an actual location-b...