Syslog Checks: How to find Insights in the Data Flood
Here's why this happens: Traditional syslog infrastructure was designed for storage and retrieval, not detection and response .
Messages flow from applications to syslog daemons to files or remote collectors, where they sit waiting for someone to grep through them after something breaks .
Syslog isn't just a debugging tool. If it is configured correctly, it becomes an early warning system that detects problems while they're still containable—often minutes or hours before they snowball into user-facing incidents.
This is where Site24x7's Syslog monitoring capabilities enter the picture. But first, we must explain everything you need to know about Syslogs.
Understanding Syslog
Syslog started in the 1980s as a simple message logging protocol. Send a UDP packet to port 514, include a priority value and a message, and that was all.
However, Syslog has evolved considerably while maintaining backward compatibility. Modern implementations support TCP transport, TLS encryption, structured data fields, and reliable delivery mechanisms. RFC 5424 formalized the protocol with proper timestamp formatting, hostname identification, and extensible metadata.
The syslog message anatomy looks like this:

Example :
That priority value encodes two critical pieces of information: the facility (which subsystem generated the message) and the severity level. Understanding severity is crucial for effective monitoring:
Severity | Meaning | Keyword | Monitoring Response |
0 | Emergency | System unusable | Immediate ticket, all hands |
1 | Alert | Immediate action required | Inform on-call engineer |
2 | Critical | Critical conditions | Assign with high priority |
3 | Error | Error conditions | Alert, investigate promptly |
4 | Warning | Warning conditions | Alert, investigate soon |
5 | Notice | Normal but significant | Log, review periodically |
6 | Informational | Informational messages | Log for analysis |
7 | Debug | Debug-level messages | Development only |
The warnings are where proactive monitoring lives. The errors are where reactive firefighting begins.
How Site24x7 approaches Syslog monitoring
Site24x7's syslog monitoring is designed for detection, not storage.
The primary design intent is real-time pattern matching and threshold-based alerting, not building a searchable archive of every message your infrastructure generates.
The architecture works like this. The Site24x7 Server Monitoring Agent can be configured to receive syslog messages directly, acting as a local collector. Alternatively, you can forward syslog from your existing infrastructure (rsyslog, syslog-ng, or centralized collectors) to Site24x7's cloud endpoints (refer Applogs - one log management platform for any and all logs). Either approach feeds messages into the same analysis pipeline.
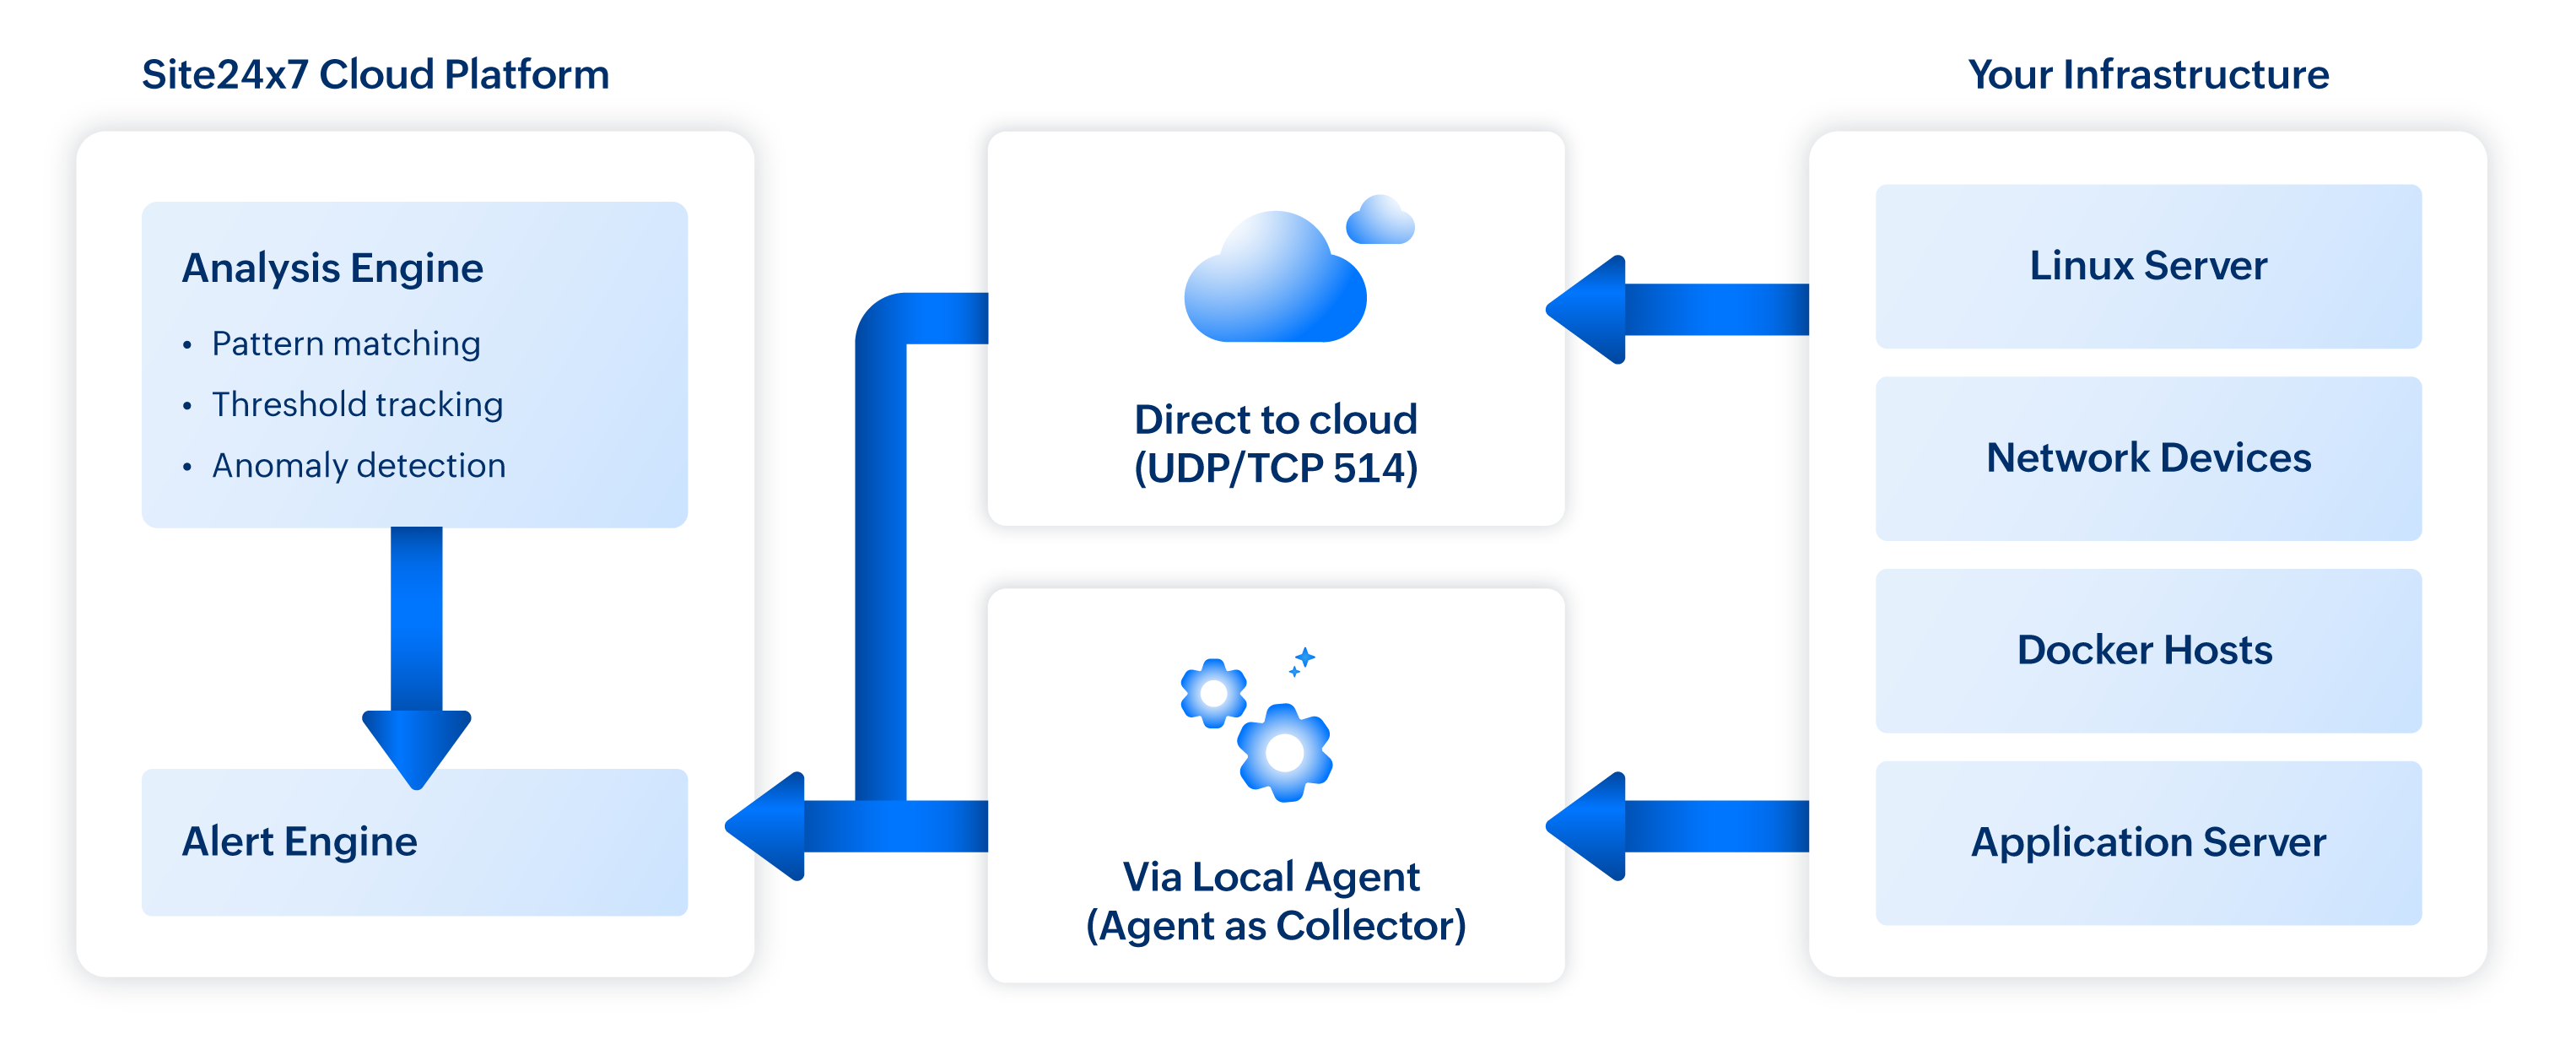
What makes this architecture powerful for incident response is the real-time processing. Messages aren't batched and analysed hourly. They're evaluated against your defined rules as they arrive, with alerts triggered within seconds of pattern matches.
How to build an effective Syslog monitoring strategy
The first step is to define what matters.
An average Linux server generates thousands of syslog messages daily. A busy application server might produce tens of thousands. Monitoring everything guarantees alert fatigue. Monitoring nothing guarantees missed incidents. The secret lies in identifying the signals that matter.
Industry experts categorize Syslog signals into four buckets:
- Critical indicators : The messages that almost always indicate a problem requiring immediate attention. Authentication failures, service crashes, kernel panics, hardware errors, security violations. These warrant high-priority alerts regardless of volume.
- Warning indicators: The messages that suggest developing problems. Resource pressure warnings, intermittent connectivity failures, retry attempts, timeout events. These warrant alerts with slightly lower priority, giving teams time to investigate before situations escalate.
- Noise : Comprises of messages that are technically informational but provide little actionable insight. Service start/stop confirmations, routine cron job completions, debug output that somehow made it to production. These should be logged for forensics but filtered from active alerting.
- Anomaly candidates : Messages that individually mean nothing but collectively signal trouble. A single failed SSH login is irrelevant. A hundred failed SSH logins from diverse IP addresses in ten minutes is a brute force attack in progress. These require threshold-based detection rather than pattern matching.
We should not treat all four categories identically.
Site24x7's syslog monitoring supports pattern-based detection, and this is where the capability becomes genuinely powerful. Rather than alerting on exact string matches, you can define regular expressions that capture entire classes of events.
Consider authentication monitoring. You could create individual alerts for each authentication failure message format:
- sshd: Failed password for invalid user admin
- sshd: Failed password for root from
- su: FAILED SU (to root) on
- sudo: authentication failure
That approach requires constant maintenance as you discover new message formats. The pattern-based alternative captures the semantic meaning:
- Pattern : (Failed|FAILED|failure|denied|unauthorized).*([Aa]uth|password|login|credential)
- Captures : Any authentication-related failure regardless of specific format
This pattern catches messages you haven't explicitly anticipated, which is precisely what you want for comprehensive monitoring.
How to catch patterns in scale
Some incidents don't announce themselves with distinctive error messages. They show themselves as unusual volumes of otherwise normal events. This is where threshold-based syslog monitoring proves invaluable.
Site24x7 allows you to define static thresholds or let an AI engine dynamically adjust thresholds that trigger when message counts exceed defined limits within specified time windows.
The window of time selection matters enormously. Too short, and you'll catch transient spikes that resolve themselves. Too long, and you'll miss rapid-onset incidents until they've already caused damage.
How to integrate Syslog Monitoring into incident response
Monitoring without response is just observation. The real value of syslog monitoring materializes when alerts trigger meaningful action. This requires integration with your broader incident response workflow.
Alert routing
Not every syslog alert deserves the same response. Security events need security team attention. Application errors need developer attention. Infrastructure warnings need ops team attention. Blasting every alert to a shared Slack channel guarantees that nobody pays attention to anything.
Site24x7's alert management allows routing based on alert characteristics. As a best practice structure routing around three dimensions:
- Severity-based routing ensures critical alerts reach on-call engineers immediately via PagerDuty or Opsgenie integration, while warnings land in Slack channels for review during business hours.
- Source-based routing directs database-related syslog alerts to the DBA team, network device messages to the network operations group, and application-specific events to the relevant development teams. This prevents the not my problem dismissal that plagues shared alerting channels.
- Content-based routing uses pattern matching to identify alert categories. Security-related patterns route to the security team regardless of source system. Performance-related patterns route to the performance engineering group. Compliance-related events route to both operations and the compliance officer.
Connecting Syslog to the bigger picture
Syslog events rarely occur in isolation. An authentication failure spike often coincides with network latency increases. A database connection error surge typically correlates with database CPU saturation. A web server error flood frequently aligns with upstream service degradation.
This is where Site24x7's unified monitoring approach delivers compounding value. Application performance data, and network monitoring within the same platform, correlation happens naturally because syslog monitoring lives alongside server metrics.
When a syslog alert fires, the server monitoring dashboard shows:
- Server CPU, memory, and disk metrics from the same time frame
- Network latency and packet loss measurements
- Related alerts from other monitoring sources
This unified view transforms incident response from sequential investigation into parallel analysis.
From | To |
Is it the server? No. Is it the network? No. Is it the database? Maybe... | The syslog shows connection timeouts, server metrics show normal resource utilization, but network monitoring shows 15% packet loss to the database subnet. So, this is a network issue. |
Common mistakes and how to avoid them
Teams configure alerts for all ERROR level messages and immediately drown in noise. Many applications log errors for conditions that don't require immediate response. Monitor for specific patterns indicating actionable issues, not generic severity levels.
One hundred errors per hour sounds like a reasonable threshold is how alert fatigue begins. Baseline your actual error rates before setting thresholds. Your production systems' normal behaviour is the only valid reference point.
A development server doesn't need the same monitoring severity as production. A batch processing system has different syslog patterns than a customer-facing API. Customize monitoring profiles by system role and criticality.
Syslog monitoring without continuous refinement degrades over time. New applications introduce new message formats. Infrastructure changes alter normal patterns. Schedule quarterly reviews of your monitoring configuration.
You configure syslog monitoring, validate it's working, then three months later realize you've been missing messages because log rotation changed file paths or permissions. Monitor the monitoring.
Are Syslogs relevant even in 2026?
The interdependencies between systems have multiplied. The blast radius of failures has expanded, and the tolerance for downtime has considerably dropped.
Traditional monitoring approaches like polling metrics at intervals, setting static thresholds, and reactively investigating after users complain, simply cannot keep match today's standards.
They're designed for a simpler time when systems were fewer, architectures were monolithic, and customers tolerated occasional outages as the cost of doing business.
Instead of waiting for metrics to cross thresholds, you're analysing the real-time narrative your systems are generating. Instead of inferring problems from symptoms, you're reading explicit descriptions of what's happening. Instead of investigating after impact, you're responding during onset.
Syslogs are talking. Are you listening?
Your systems are already generating the intelligence you need to prevent incidents. Every server, every application, every network device in your infrastructure is continuously writing diagnostic information to syslog. The warnings are there. The error patterns are there. The early indicators of impending failure are there.
The question isn't whether this information exists. It's whether anyone is paying attention.
Your syslog files contain signals that would alert you to developing problems if only something were watching. Authentication anomalies that indicate security probing. Error patterns that reveal application instability. Warning messages that precede hardware failures. Connection issues that forecast service degradation.
Site24x7's syslog monitoring capabilities are ready to deploy today. The Server Monitoring Agent you likely already have installed supports syslog collection out of the box. The pattern matching engine is built for exactly the use cases we have described. The alerting integration connects to whatever incident management tools you're already using.
Get unparalleled observability from Site24x7. Request for a scheduled tailor made demo today.