Visualize blind spots within corporate, cloud, and ISP networks using the Network Route Map
If your data center experienced an outage due to an ISP problem, the first thing you probably do is go to a terminal and execute your nifty command line tools. These tools give you a lot of information, textually. However, troubleshooting network outages aren't always easy, as slow connections or outages may be caused by issues outside your corporate network and parsing all this data is hard. Now, with Site24x7's launch of the Network Route Map, you can visually gauge the network path, latency, and performance details at every node between a source and destination server, allowing you to pinpoint the exact location of a slowdown or outage, and take corrective measures before your customers are affected.

Generating a Network Route Map
When a monitor faces an outage, Site24x7 automatically generates a root cause analysis (RCA) report for that outage. This report offers a plethora of information to help you discover exactly what triggered the downtime. But this report doesn't stop there; it aims to answer questions like what went wrong, how it went wrong, and why it went wrong with the help of data procured from multiple network troubleshooting tools, including location checks, dig analysis, ping, traceroute, and MTR. With the Network Route Map, you can troubleshoot issues faster than ever before.


Establishing a stable connection between your users and app services
Your app's service connectivity is one core aspect that differentiates your business from others. To achieve strong connectivity, you first need to experience the app as your end users would. The Network Route Map harnesses the power of data aggregated from an MTR report to give you a holistic overview of your actual network path from different global locations, so you can see how users around the world experience your app.
Let's say you're using a cloud-based help desk software solution that offers services across the globe. At any point of time, there could be thousands of users waiting to gain access to your service. What if a few hundred of those waiting customers face issues logging into your app? Do you have any detection method in place to notify you of these instances, or will these customers just slip through the cracks? If this issue persists without your knowledge, it could carry catastrophic implications for your business. With the Network Route Map, you can easily track and fix connectivity issues by:
- Learning about outages and connection issues before your end-users: See a visual representation of the connectivity and performance attributes between source and destination nodes with aggregated data from the MTR report. With this information, you can more clearly understand the complete performance of your entire service delivery chain.
- Identifying problems and share data with the right person: Gain deep insight into critical network routes regardless of whether the node is located on-premises, in the cloud, or in a hybrid IT environment. The Network Route Map helps you understand whether the issue resides within your network or somewhere upstream in your ISP's network. You can quickly export the RCA report as a PDF and share it with the primary point of contact via email.
- Visualizing your entire network route end-to-end: Understand your ISP's networks better by tracing all the available network routes that your ICMP packets traverse en route to your destination server.
- Tracing historical data of critical metrics like latency details and packet loss at every hop: Dissect performance bottlenecks in your network by analyzing multiple performance attributes at individual nodes, including IP details, packet loss percentage, and network latency. During an outage, the RCA report aggregates data, including the Network Route Map. You can view historical timeline data of your traffic route for up to the last one year.
Diagnosing issues using the Network Route Map
Let's look at an example of how the network route feature can be leveraged to alleviate network issues and keep network traffic moving. Over the last few days, Site24x7 has constantly alerted you about a service disruption when accessing your help desk app from your Toronto location. Since you couldn't detect any issues on your app stack, there's a good chance the issue is lingering around at a hosting provider site, an ISP, or a router that you're relying on for service delivery. In the past, it was difficult to verify such issues as visibility into the entire network route was limited or nonexistent. But now, with the Network Route Map, you're able to quickly isolate the issue, and pass the information along to the hosting provider's support team for correction.

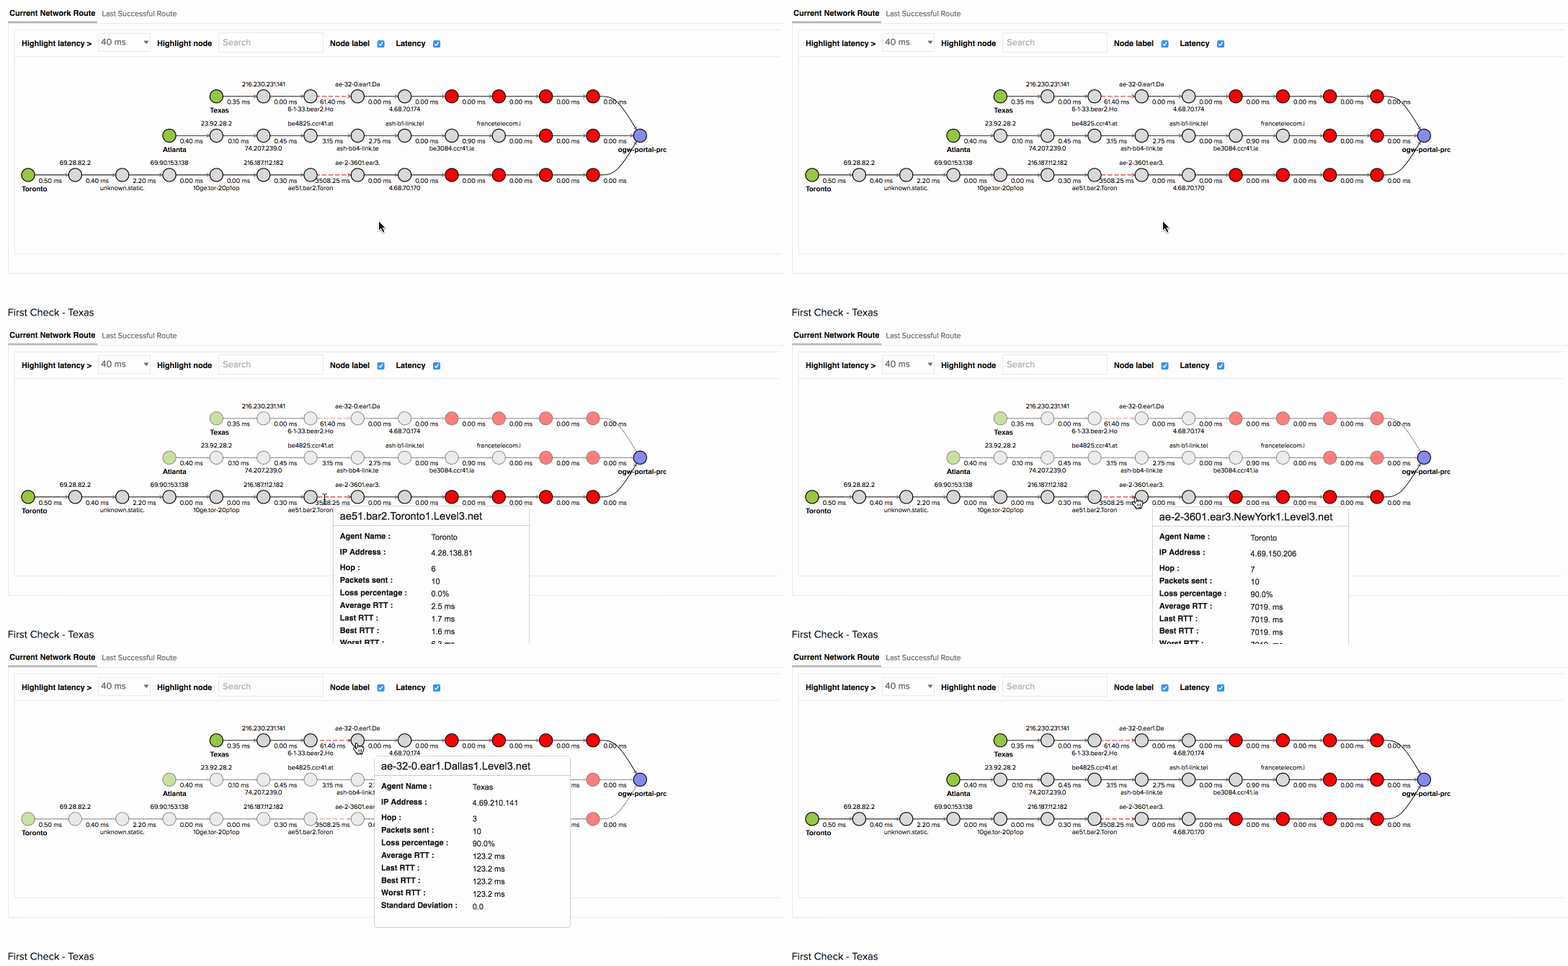
The above image shows how you can identify the specific routers that are dropping packets along the network path. When your app was accessed from the Toronto location, it experienced a 90% packet loss with an average response time of 7019ms at hop 7. Further node details from the map show that the routers configured by the ISP Level 3 communications were causing higher latency than the remaining nodes. Using the Last successful network route tab, your team was able to confirm this and detect the exact point of failure.
Tips for better interpreting Network Route Maps
When diagnosing a problem in your network's connectivity, keep the information below in mind to get the most out of your Network Route Maps:
- Latency and packet loss in a node help you identify poorly configured networking or firewall (IP table) rules that cause the host to drop packets.
- Packet loss data helps you to identify the exact point where your network fails or slows down. However, when you notice an individual hop (anywhere except for the destination) drop packets while subsequent hops don't lose any packets, it doesn't necessarily mean you've found the source of your network trouble; certain routers limit transmission rates, which leads to skewed results in your MTR data. Rest assured, in this specific instance, there isn't anything to worry about.
- Latency is always quantified from the source, and not between hops. It'll always be longer than the previous hop because every subsequent hop is farther from the source than the preceding one. Latency increases in a linear fashion, with minor increases when hops are nearby and significant increases when hops are farther apart.
- A significant spike in latency values at a hop on an intercontinental connection is usually considered normal.
- Last, average, best, and worst round trip times (RTTs) are all measured in milliseconds. In most cases, the average RTT should be the focus of your attention during troubleshooting.
- View the standard deviation of the latencies to each host; the higher the standard deviation, the greater the difference between measurements of latency.
Conclusion
Armed with the Network Route Map, you'll be able to easily discover networking issues and find out exactly what's slowing down your connections. So why wait? Start using Site24x7's Network Route Map feature and see for yourself how it helps mitigate any issues that exist in your service delivery chain.