Monitor JavaScript errors using Site24x7
JavaScript errors can be critical and can affect the end-user experience. It's important to analyze for JavaScript error before end users are affected. Monitoring JavaScript errors helps ensure that users experience seamless web application performance.
What are JavaScript errors?
Most internet users have encountered JavaScript errors at some point. This occurs when a script on a webpage contains an error or fails to execute correctly.
Additionally, the growing number of browser extensions and adware makes handling JavaScript errors more challenging. Adding to this
complexity, not every error can be addressed during the development stage, which is why it's crucial to have a monitoring tool that highlights
errors as they occur in the production stage.
How to fix JavaScript errors with monitoring?
To fix JavaScript errors using a monitoring tool:
- Identify errors in real time: Use a monitoring tool with real-user monitoring (RUM) capabilities to capture JavaScript errors as they occur in your application.
- Understand the error context: Monitoring can provide additional context, like user session details, browser environment, and specific code lines, helping to pinpoint the error's root cause effectively.
- Leverage source maps: If your JavaScript code is minified for production, upload source map files to make stack traces readable. This allows you to trace errors back to the original source code for faster debugging.
- Set alerts and automate Resolution: Configure rule-based alerts to notify your team when specific errors occur. Advanced tools integrate AI to detect anomalies and suggest fixes proactively.
JavaScript errors can be critical and can affect the end user experience. It's important to analyze all such errors and fix them before the end users are affected.
How to monitor JavaScript errors using Site24x7
Site24x7's real user monitoring helps you pinpoint any JavaScript code errors on your webpages. Any JavaScript errors encountered while accessing your web application are automatically displayed in the JavaScript tab of your Web RUM client. You will also gain deep insights into the error type, message, and URL allowing you to take prompt action and improve your webpage performance.
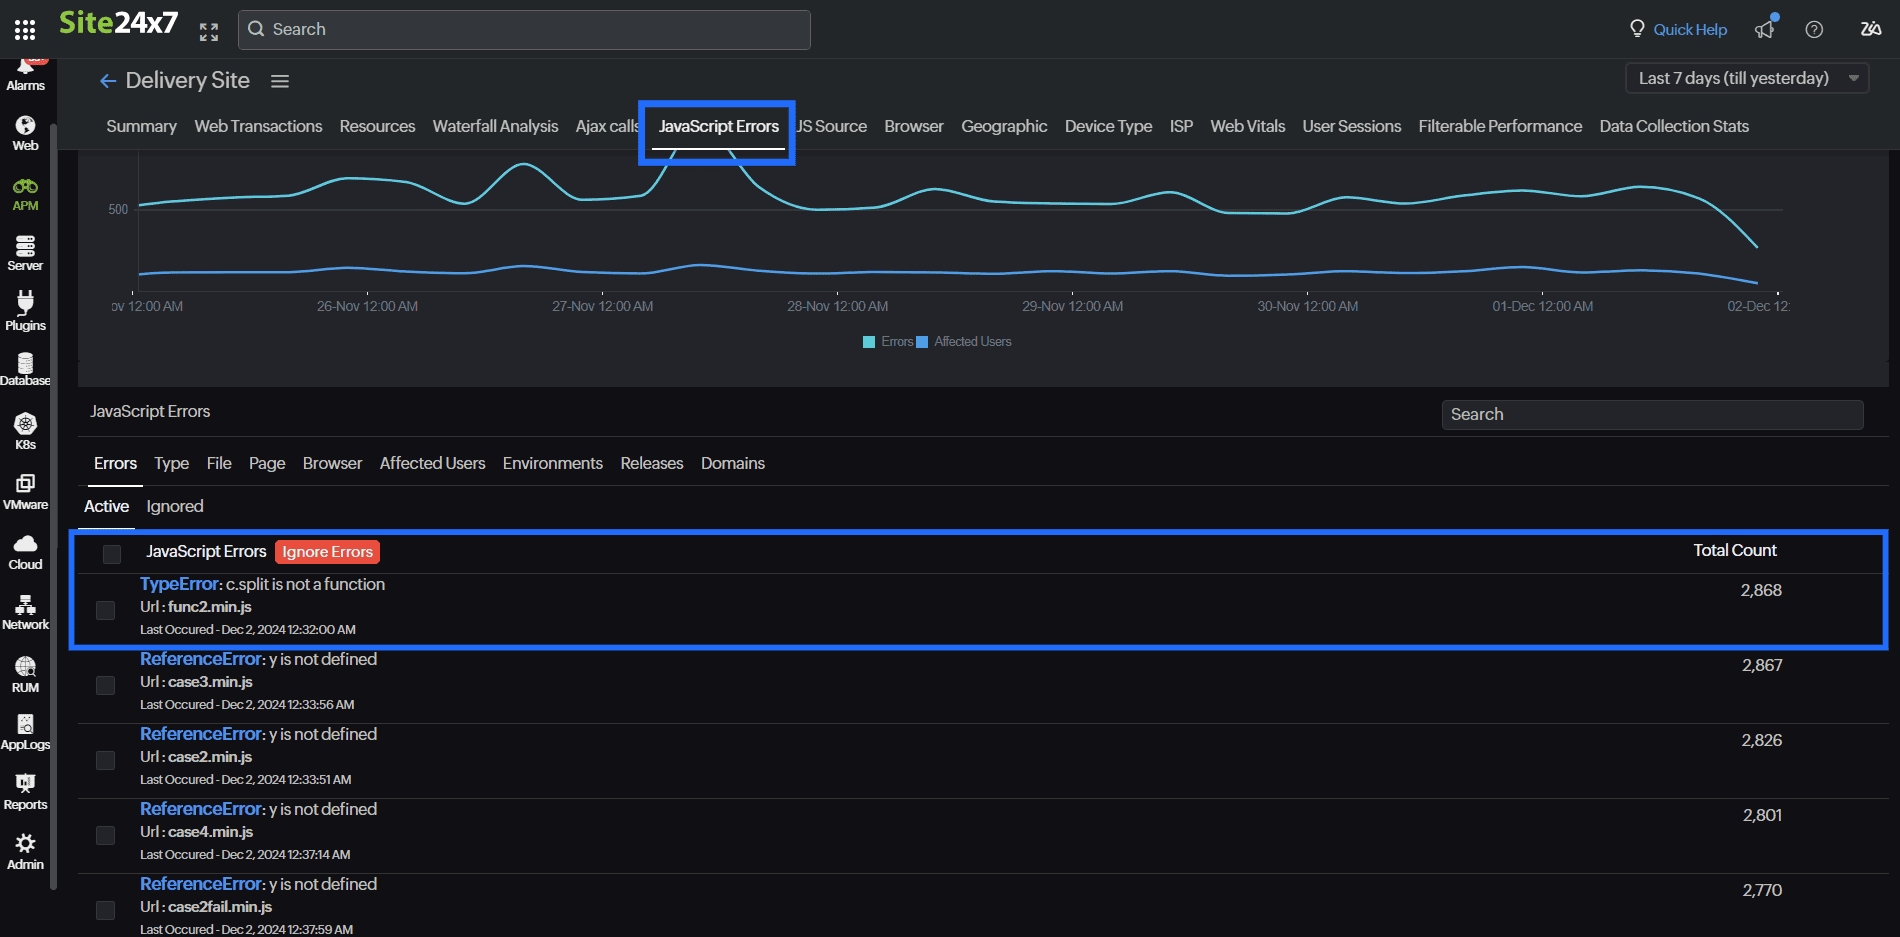
Let's explore JavaScript error monitoring in action. In the image below, you can see that a 'TypeError' has occurred frequently. Let's investigate this error further.


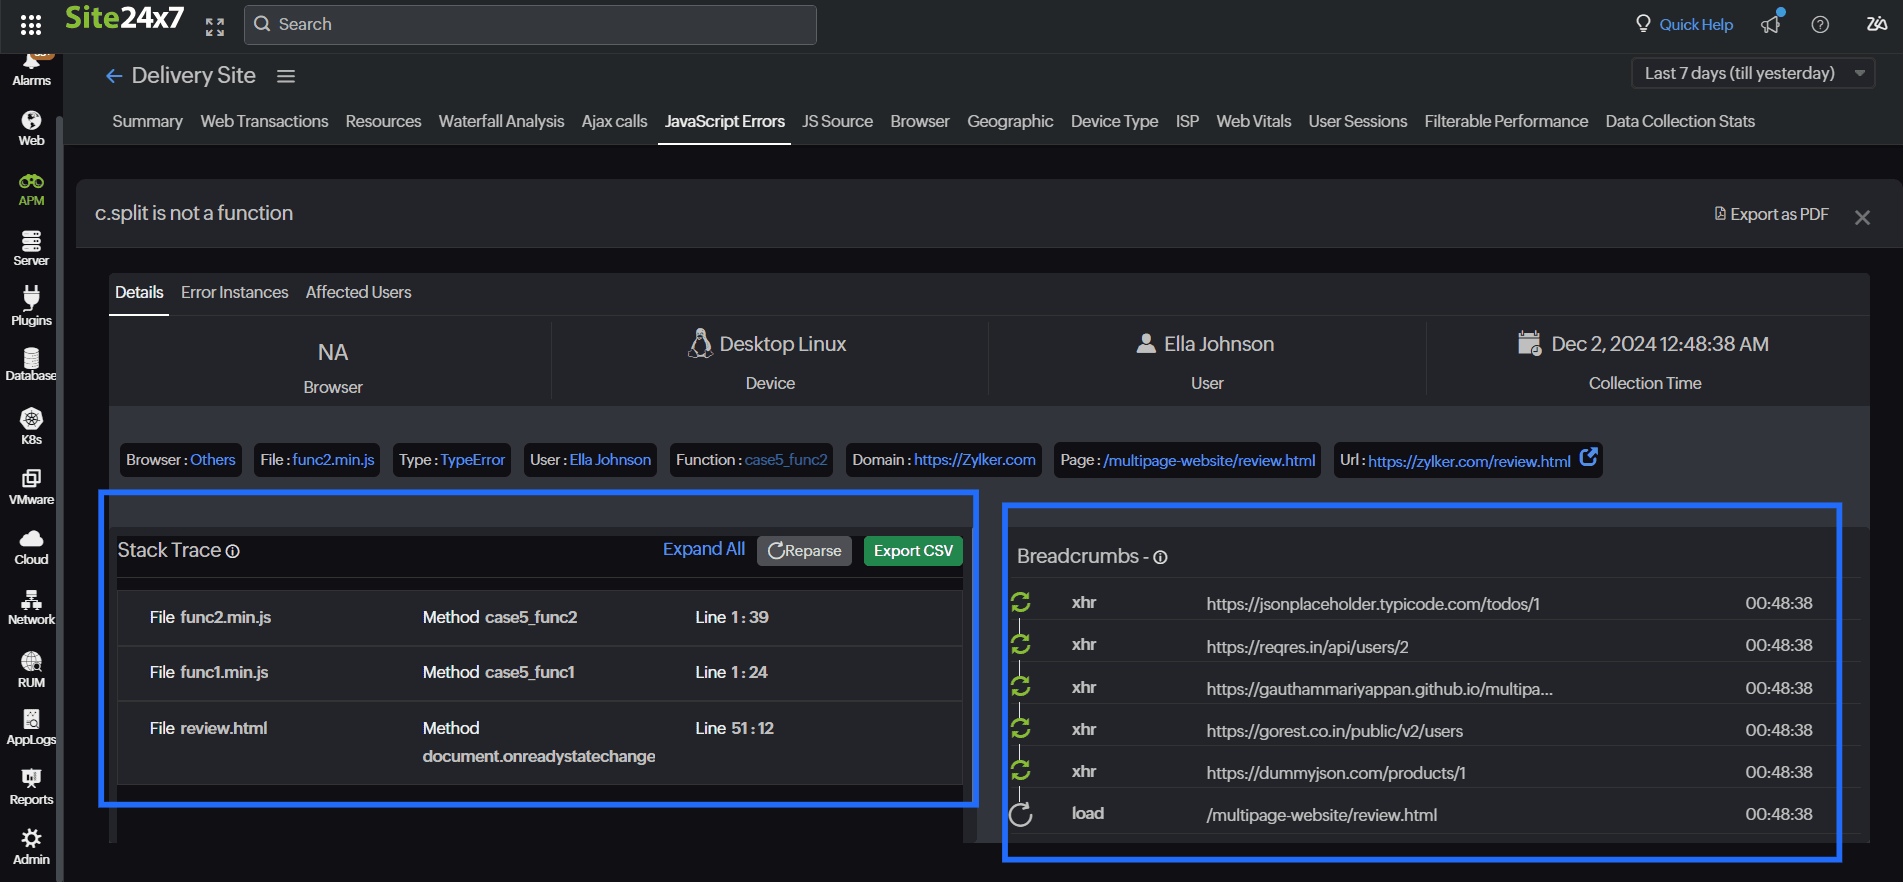
When you select the error, a popup screen opens, providing a detailed view of the issue. It displays information such as the location in the code where the error occurred, the exact time it happened, and the number of occurrences.
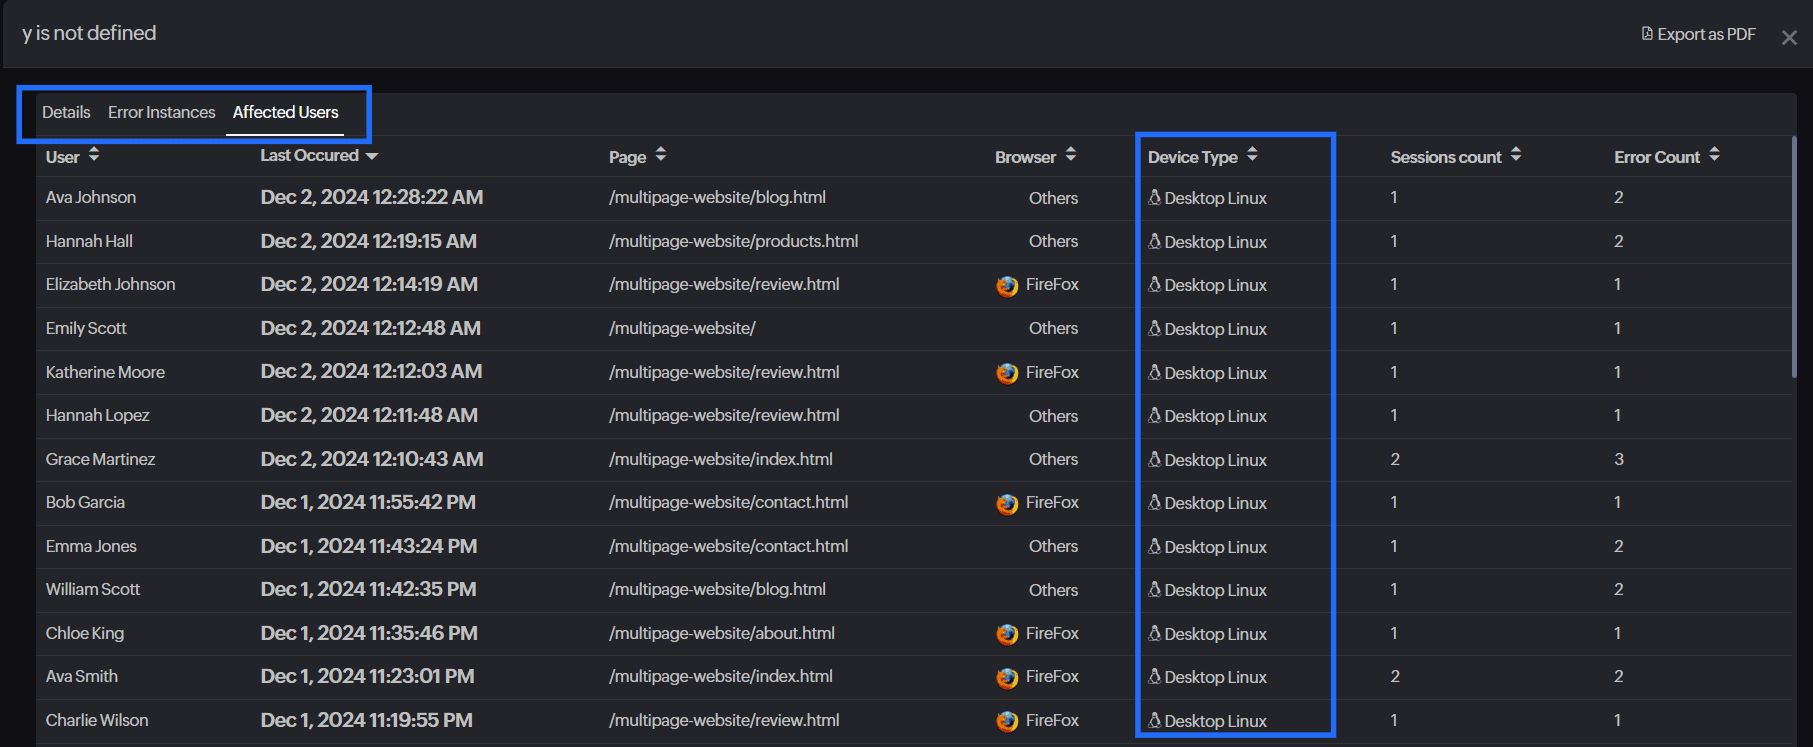
We can further investigate the error by looking at 'Error Instances' and 'Affected Users'. In this case, the error is observed only on Linux devices, indicating that the issue is device-specific. Thus by identifying the specific issues, you can take targeted actions to resolve errors efficiently. This approach helps ensure a seamless user experience across all platforms.

Ready to monitor your web applications in real time? Add Site24x7 RUM to your IT monitoring and troubleshooting arsenal. Sign-up for a free Site24x7 trial account!
Comments (0)