How OpenTelemetry can enhance observability in distributed systems: Practical examples
Observability has become one of the fundamental elements of performance and reliability as modern applications move toward cloud-native architectures, microservices, and multi-cloud. Traditional monitoring techniques often fall short in such dynamic, distributed environments. That’s where OpenTelemetry (OTel) , an open-source observability framework comes into picture. It provides unified standards for collecting, processing, and exporting telemetry data (metrics, logs, and traces), enabling teams to achieve a deeper, correlated understanding of system behavior across services.
This blog explores how OpenTelemetry enhances observability in distributed systems and how Site24x7’s APM integrates seamlessly with OTel to deliver unified insights and proactive remediation. Let’s dive in.

Understanding observability in distributed systems
In distributed applications comprised of numerous microservices, containers, and serverless components, issues rarely occur in isolation. Observability is the ability to infer the internal state of a system from its external outputs: logs, metrics, and traces. Each provides a critical perspective:
- Metrics quantify how a service is performing (e.g., latency, throughput, error rate).
- Logs offer granular event details for debugging or auditing.
- Traces show end-to-end transaction paths across multiple services.
To achieve unified observability, these signals must be correlated , allowing teams to pinpoint root causes and measure performance from a single platform.
The role of OpenTelemetry in modern observability
OpenTelemetry acts as a vendor-neutral specification that standardizes how metrics, traces, and logs are generated, collected, and exported. It provides:
- Instrumentation libraries for most major programming languages (like Java, Go, Python, .NET, Node.js).
- Collectors that aggregate and process telemetry from multiple sources.
- Exporters that forward data to preferred backends such as Site24x7.
This common framework ensures consistent telemetry no matter where or how your services run.
OpenTelemetry architecture overview
An OpenTelemetry pipeline consists of three layers:
- Instrumentation layer : Your application code instrumented with OTel SDKs or auto-instrumentation agents.
- Collector layer : A central or distributed service that receives telemetry, processes it (filtering, batching, or transforming), and exports it. This process could be simplified by using tools like Site24x7 that helps with both—data collection and visualization.
- Observability backend : Observability tools like Site24x7, which visualizes data, correlates metrics and traces, and triggers alerts and automations.
This modular design allows flexibility and minimizes vendor lock-in.

Practical benefits of OpenTelemetry
OpenTelemetry provides measurable value in distributed observability:
- Unified data model : Standardization ensures telemetry consistency across teams and frameworks.
- Cross-platform support : Works seamlessly across hybrid environments such as Kubernetes, on-premises, or cloud-native services.
- Cost efficiency : Collect only what you need. Trace sampling, metric filtering, and transformation help control data volumes.
- Vendor neutrality : Avoid repeated rnstrumentation when changing monitoring vendors.
- Scalable collection : The OpenTelemetry Collector offers powerful batching, buffering, and routing capabilities that scale with production workloads.
Common OpenTelemetry use cases in distributed systems
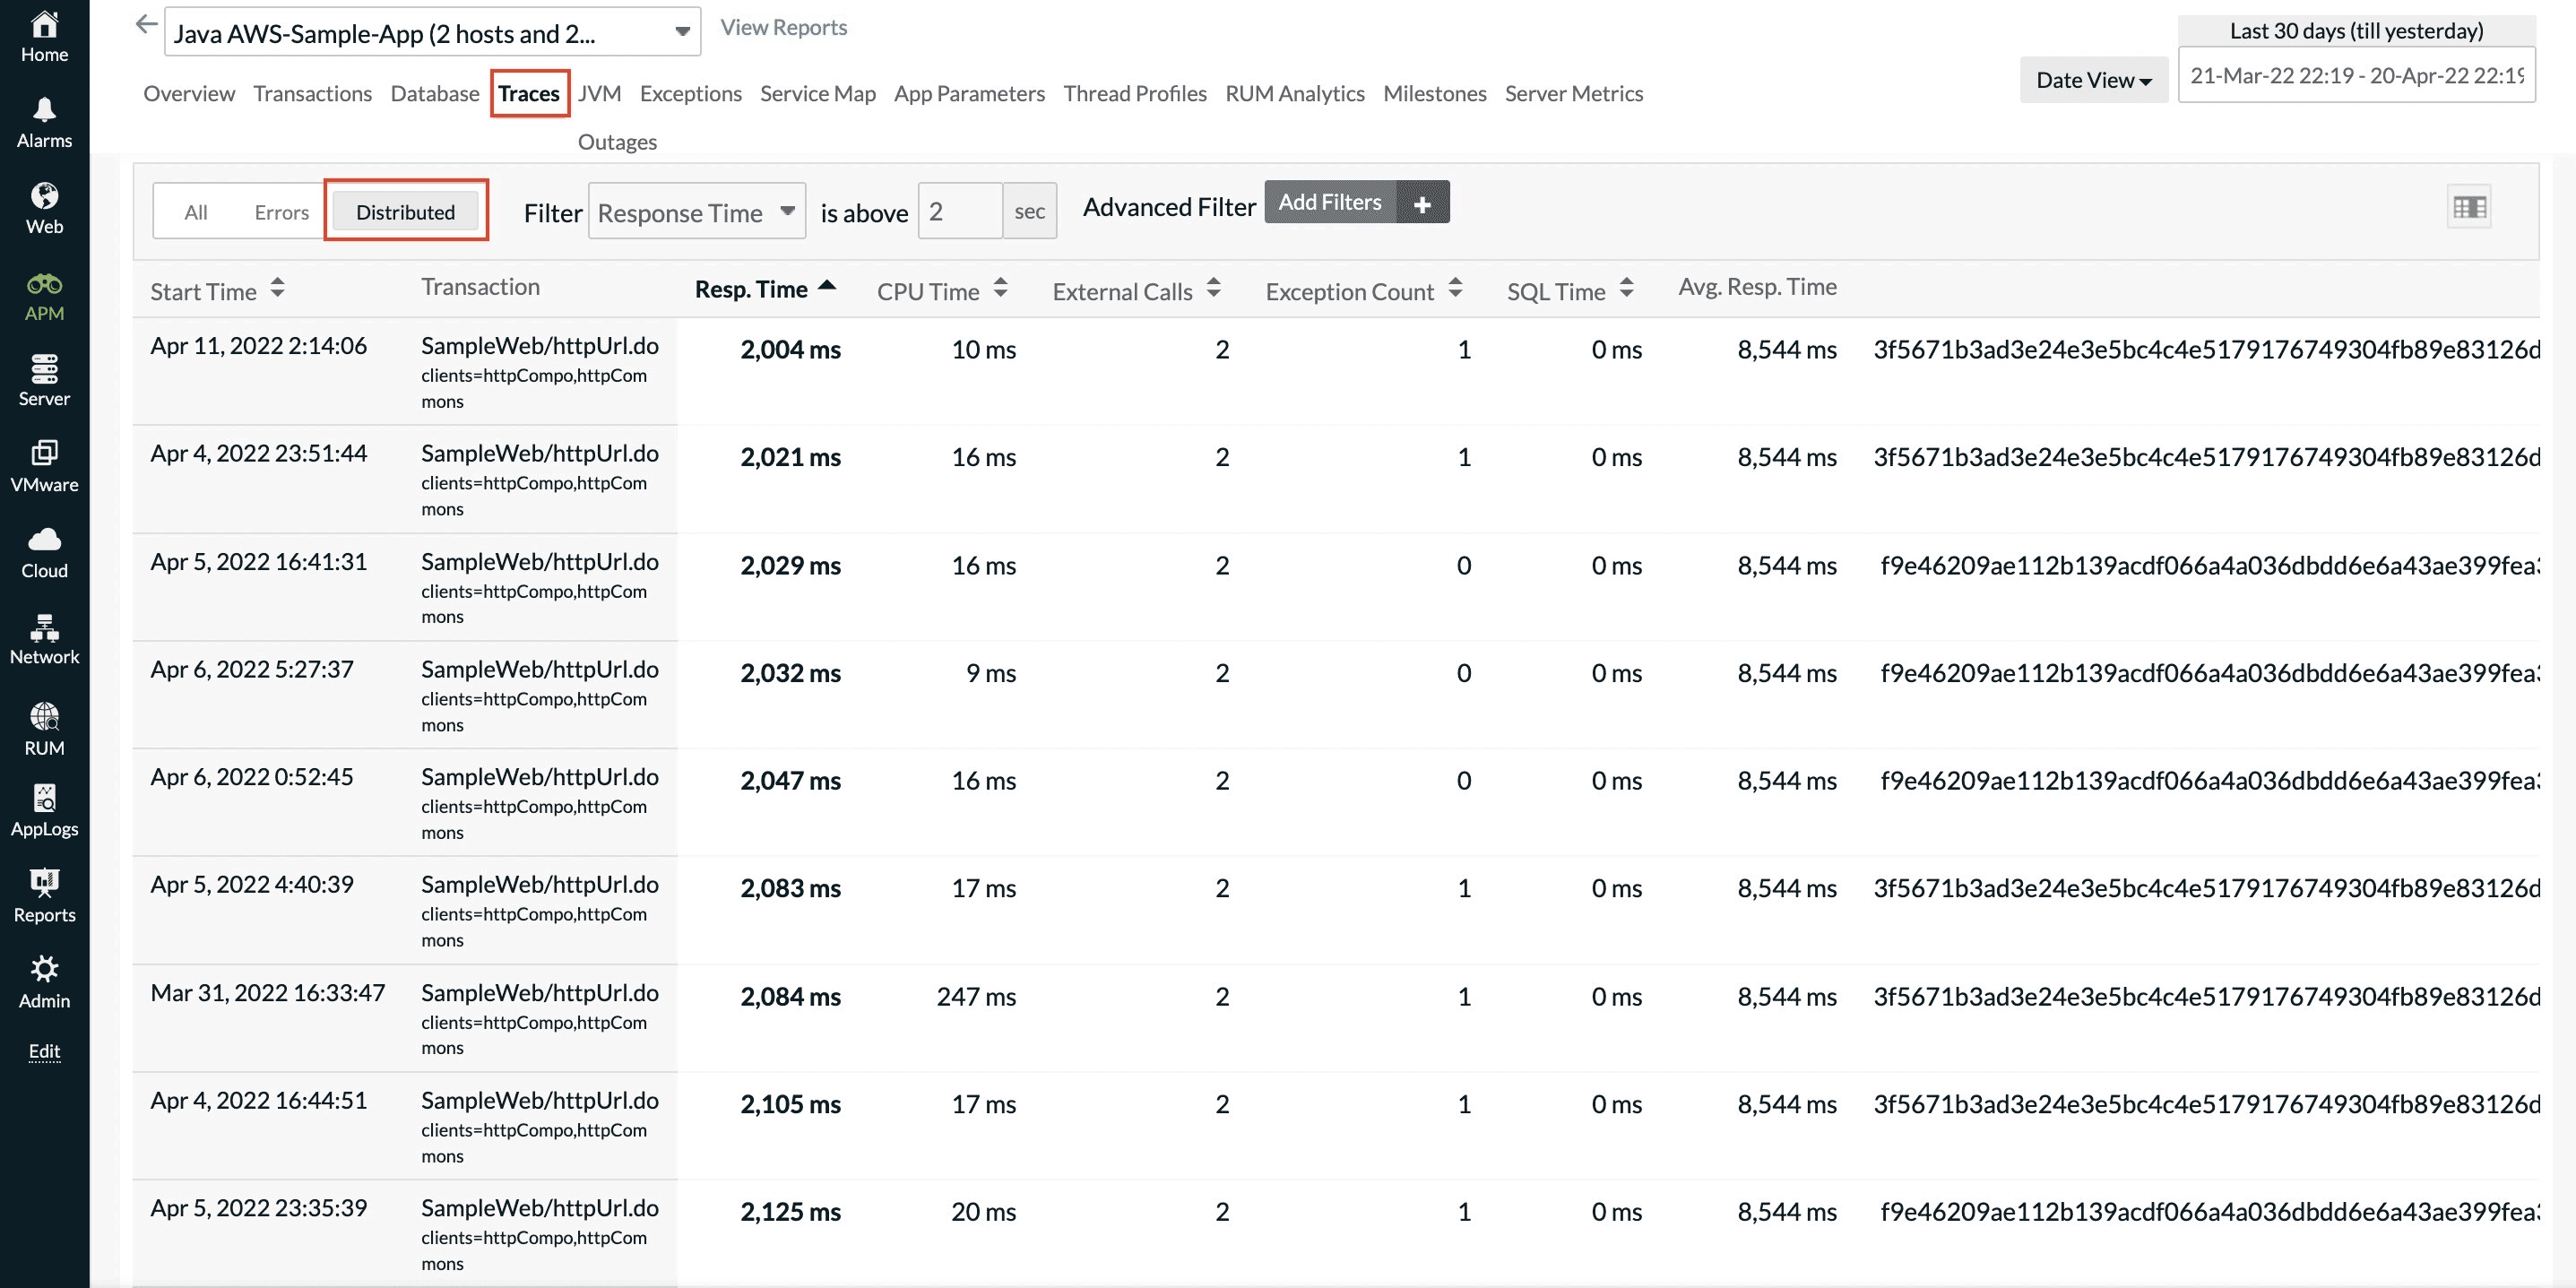
1. Identifying performance bottlenecks in microservices
In a system with many microservices, locating bottlenecks can be a complex task. By instrumenting each service with OpenTelemetry and tracing requests as they propagate, DevOps teams gain visibility into latency at each span.
Example: If your e-commerce checkout takes longer than usual, a Site24x7 APM dashboard integrated with OTel traces reveals that the payment microservice is causing high transaction latency. With one click, you can identify the exact database query responsible for it.
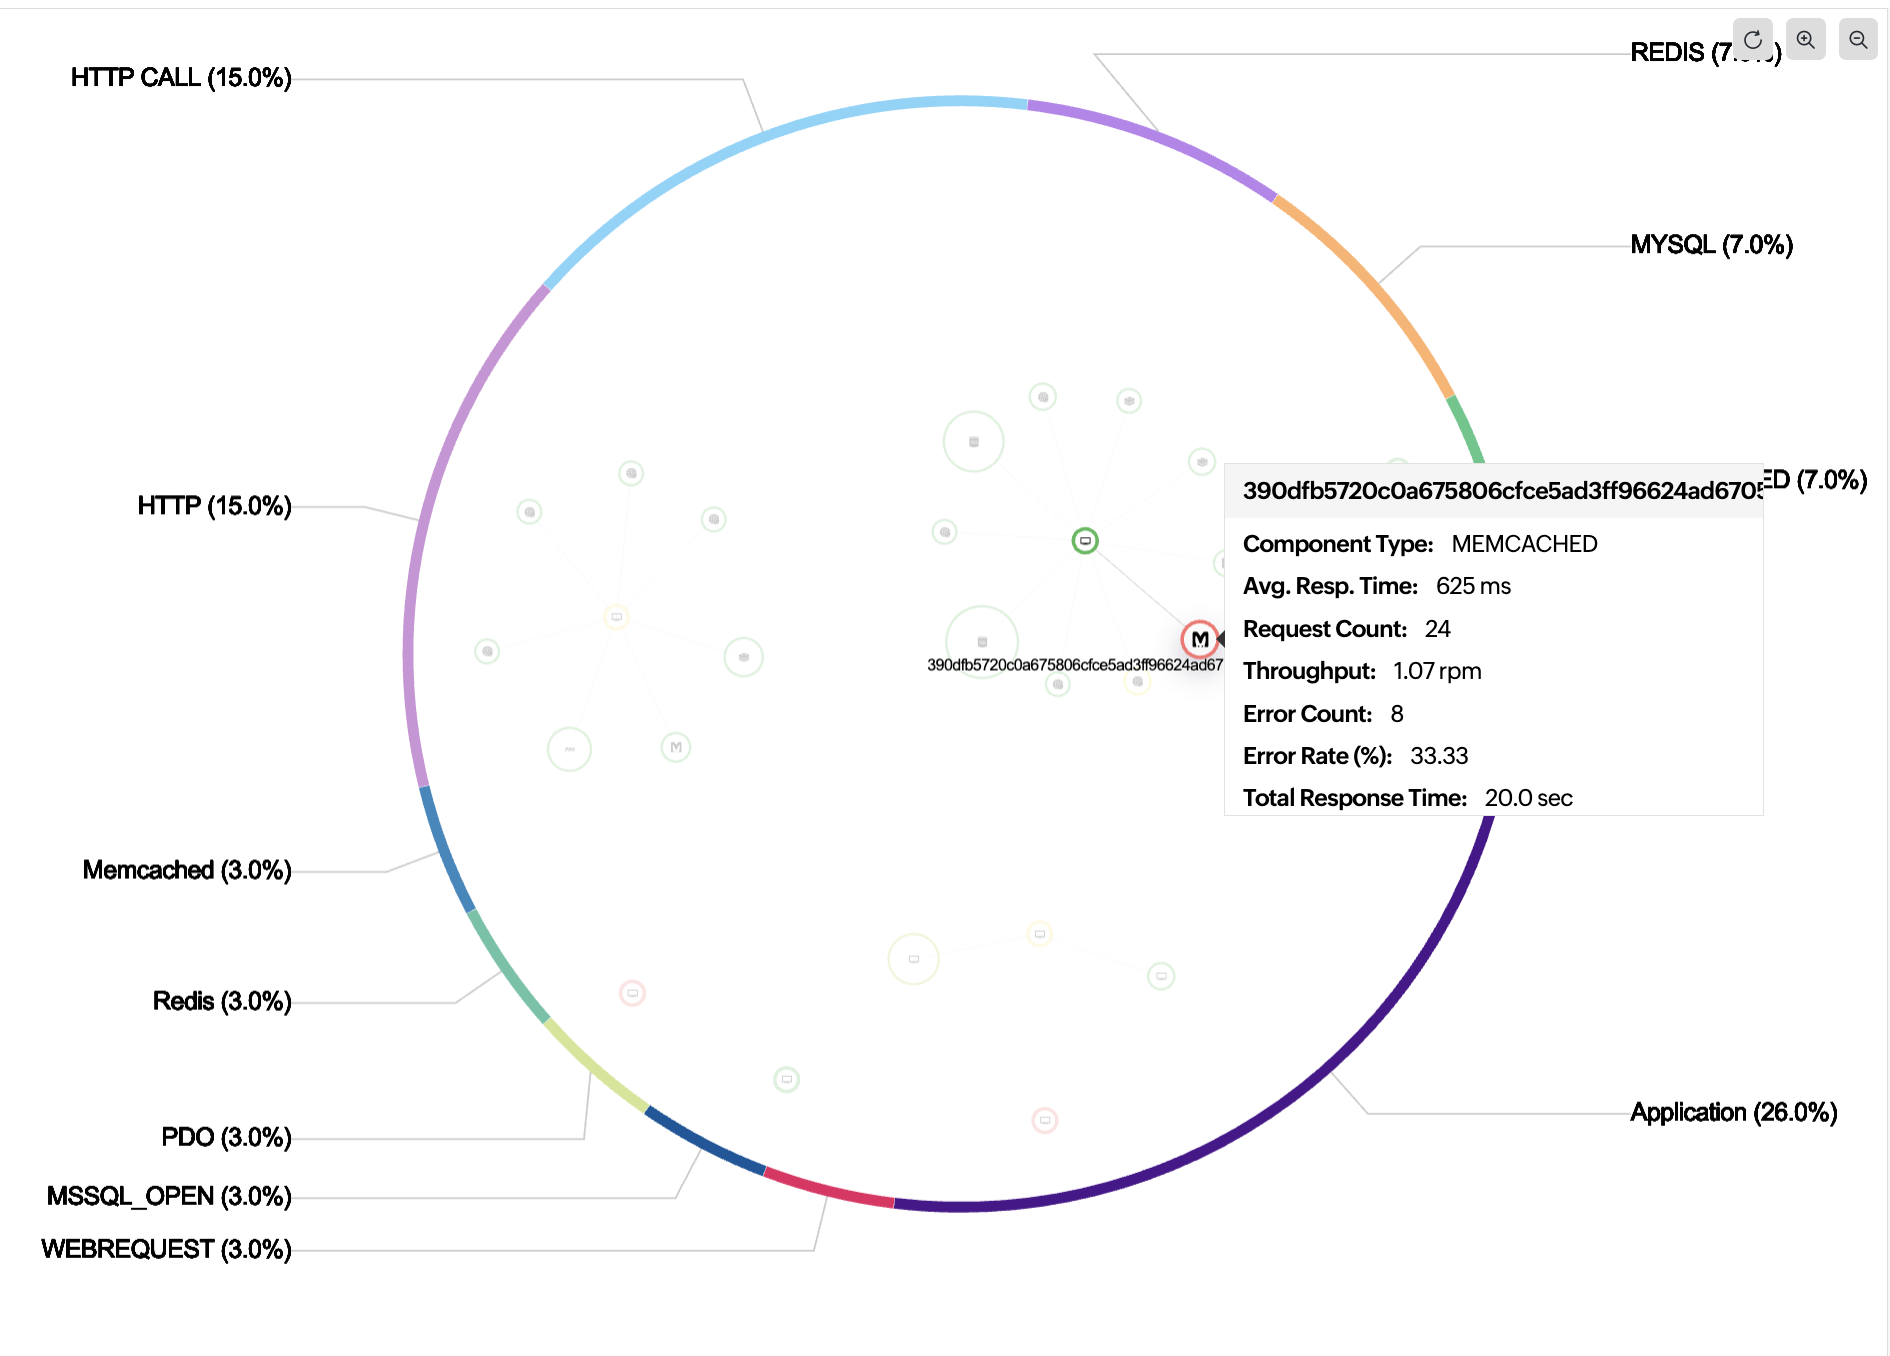
2. Diagnosing cascading failures
Failures in distributed systems often cascade. OpenTelemetry lets you trace error propagation through dependent services.With Site24x7 ingesting those traces, you can visualize the root cause, map the trajectory of failures, and implement circuit breakers in strategic spots to prevent recurrence.
3. Resource consumption diagnostics
Memory leaks or slow resource reclamation can remain invisible to traditional metrics. By attaching custom span events to OTel traces, you can correlate memory usage with specific function calls. Site24x7 visualizations show rising memory trends alongside function-level spans, helping engineers isolate inefficiencies quickly.

4. Trace-to-metric conversion
With OpenTelemetry’s span metrics processor, you can automatically aggregate traces into meaningful metrics like latency histograms, request counts, and error rates. Site24x7’s unified dashboards then display these derived KPIs, combining the granularity of tracing with the efficiency of metrics.
From Instrumentation to insights with Site24x7 + OpenTelemetry
Site24x7’s OpenTelemetry integration transforms observability into actionable insights. It provides a OpenTelemetry-compatible backend for ingesting, processing, and visualizing telemetry signals. Here’s how it works in practice:
- Instrument your applications using native OpenTelemetry SDKs or auto-instrumentation agents.
- Export data (spans, metrics, logs ) to Site24x7’s hosted OpenTelemetry Collector using the OTLP protocol.
- Transform and enrich data with Site24x7’s processing pipeline for context correlation and intelligent aggregation.
- Visualize and act in Site24x7’s intuitive UI—view distributed traces , correlate anomalies, configure proactive alerts, and initiate automated remediation.
This integration bridges the gap between raw telemetry and operational insight , from instrumentation to action, all within one ecosystem.
Real-world observability scenarios: OpenTelemetry in action
Scenario 1: Debugging latency in Kubernetes services
A fintech company running multiple Go-based microservices across Kubernetes noticed intermittent checkout delays. By enabling OpenTelemetry and exporting data to Site24x7 APM, engineers visualized latency breakdowns across pods. They discovered that 80% of delays originated from a single misconfigured database connection pool, which was undetectable before OTel tracing.
Scenario 2: Correlating logs, metrics, and traces
A SaaS platform experiencing API timeouts used OTel to correlate logs with trace contexts (TraceID, SpanID). With Site24x7’s correlation engine, the team linked increased 500-level errors to a specific memory-intensive operation, confirmed through trace spans and logs collected across services. This end-to-end view reduced mean time to resolution (MTTR) by 60%.
Scenario 3: Cost attribution and optimization
By tagging traces with metadata (e.g., team_name or customer_id), an organization attributed cloud resource usage to specific development teams. Site24x7 dashboards visualized cost-impacting transactions, helping teams fine-tune workloads and reduce compute costs by 25%.
The synergy between OpenTelemetry and APM
Rather than replacing APM , OpenTelemetry enhances it. OTel provides standardized data collection, while APM tools like Site24x7 deliver the analytics, visualization, and alerting a modern SRE team needs.
Layer | OpenTelemetry's Role | Site24x7 APM's Role |
Data collection | Unified, vendor-neutral telemetry collection | Ingests raw OTel data for processing |
Data transformation | Filtering, sampling, enrichment via Collector | Correlates and aggregates telemetry |
Analysis & visualization | Provides context-rich traces and metrics | Delivers dashboards, anomalies, and alerts |
Proactive operations | Exports consistent signals across environments | Automates alerting and remediation |
Together, they create a comprehensive observability framework, from instrumented code to actionable intelligence.
Best practices for using OpenTelemetry in production
- Employ distributed collectors : Use both agent and gateway modes for high scalability.
- Set up intelligent sampling : Avoid collecting excessive trace data; sample only what’s valuable.
- Use context propagation : Ensure TraceIDs and SpanIDs flow through every service.
- Correlate logs and traces : Embed trace context into log records for cross-layer debugging.
- Automate deployment : Integrate collectors into CI/CD pipelines to ensure observability from day one.
- Leverage Site24x7 dashboards : Visualize trace latency histograms, error percentages, and dependency maps in real time.
Why choose Site24x7’s OpenTelemetry integration
Here are five key reasons to choose Site24x7’s OpenTelemetry Integration :
- No collector management overhead : Site24x7 hosts and manages the OpenTelemetry Collector for you, so you can just configure your apps to export telemetry directly—no extra infrastructure or collector maintenance required.
- Unified observability across multi-vendor environments : Gain centralized visibility and correlate data from across different tools and vendors, breaking data silos and avoiding vendor lock-in for flexible, scalable telemetry pipelines.
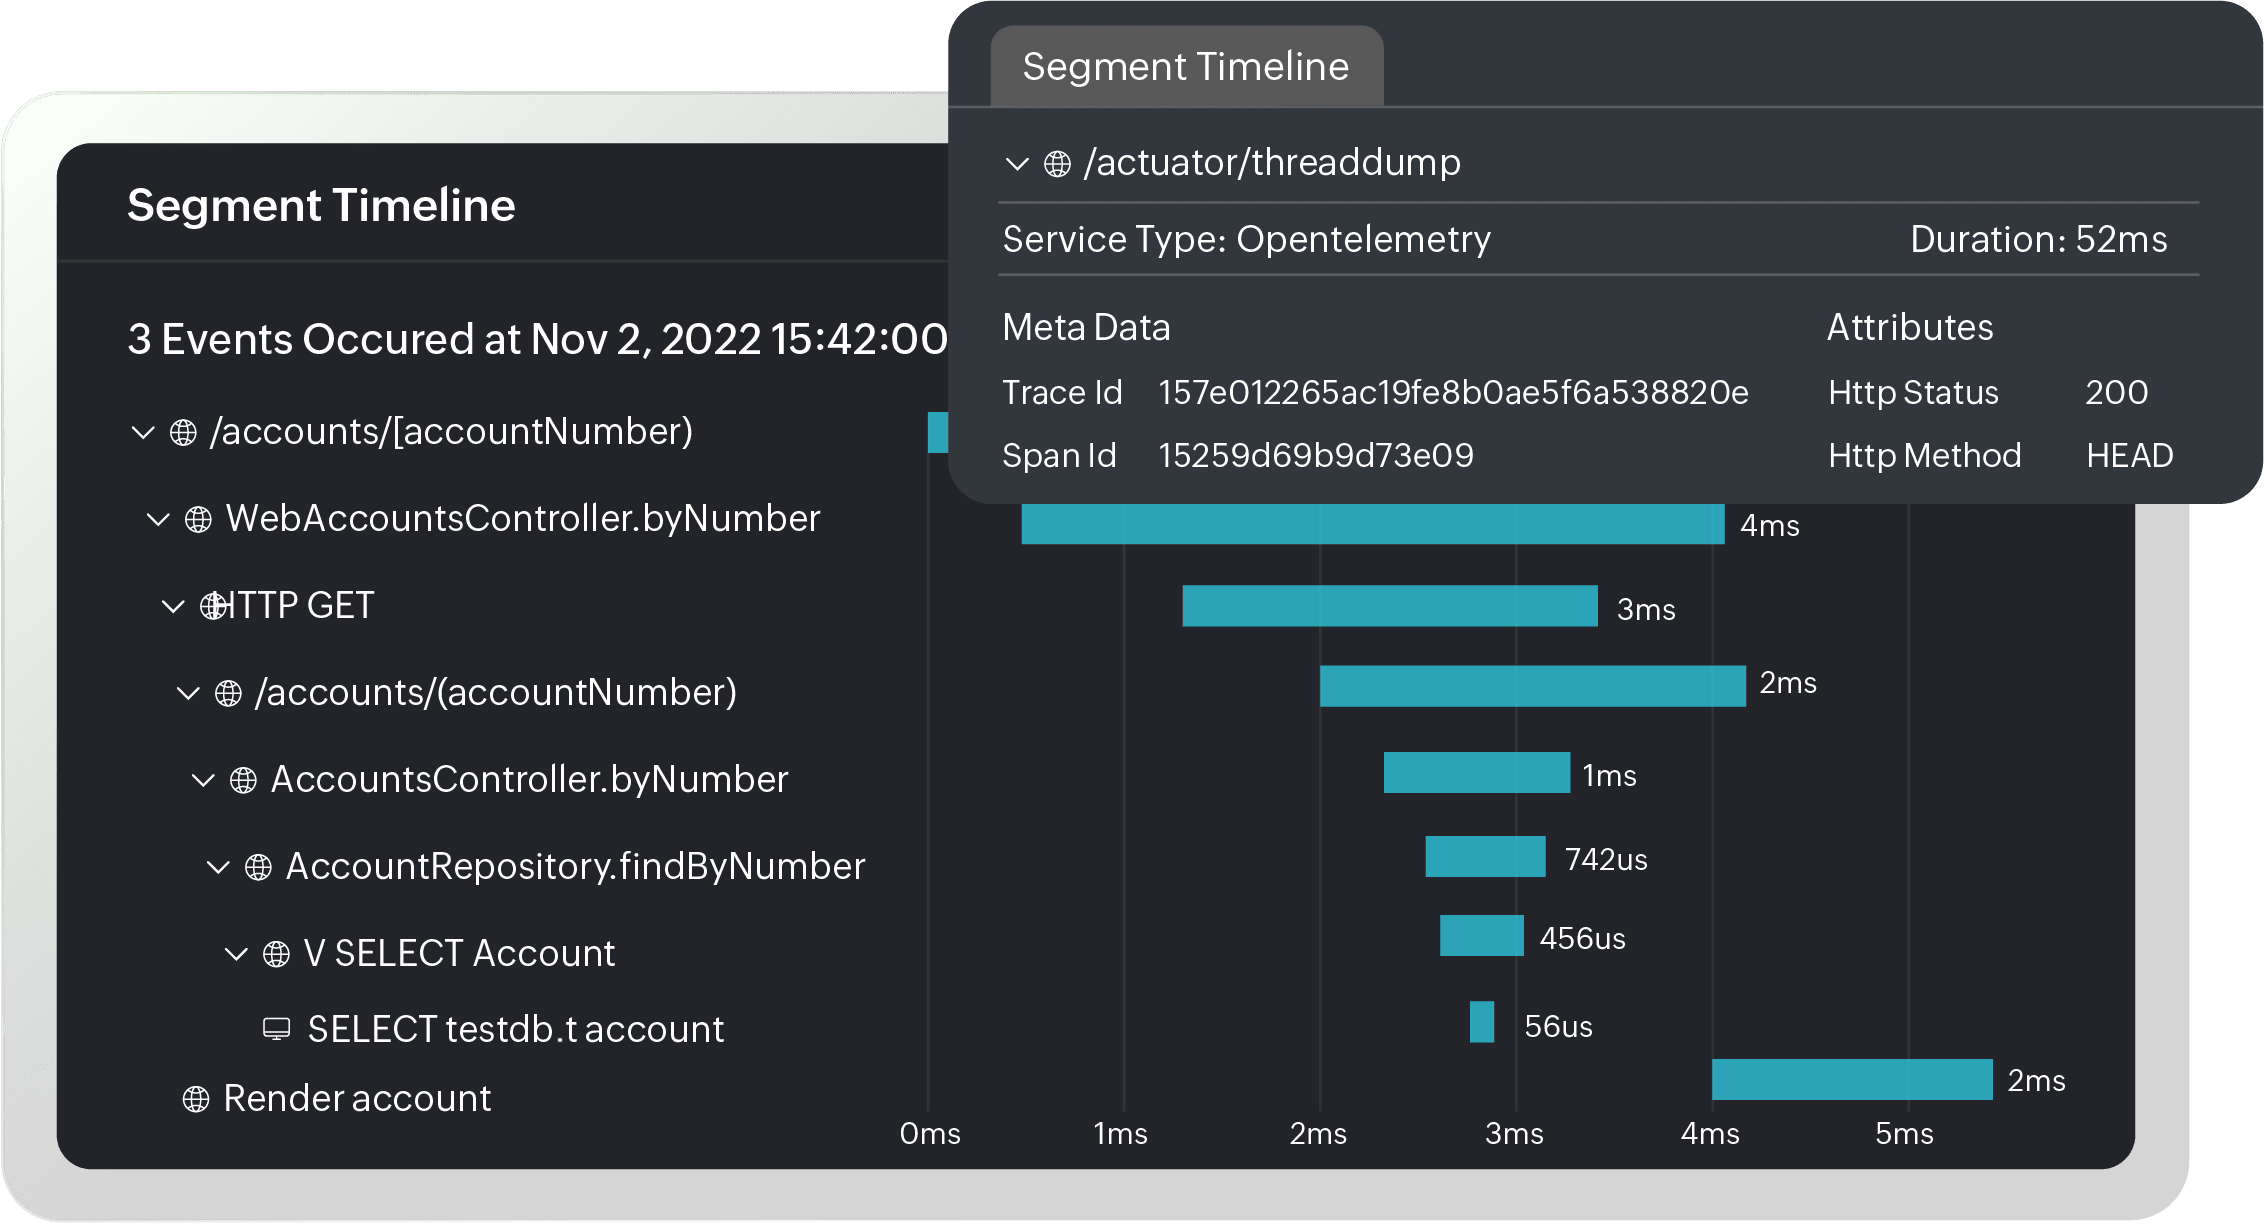
- Granular transaction and span-level insights : Access detailed, transaction-level and span-level metrics, including waterfall and trace drill-down views, full exception traceability, and top error breakdowns for deep troubleshooting.
- Proactive remediation and intelligent alerting : Leverage Site24x7’s automation templates for auto-remediation, customize incident routing, and integrate with ITSM tools for seamless alerting and resolution workflows.
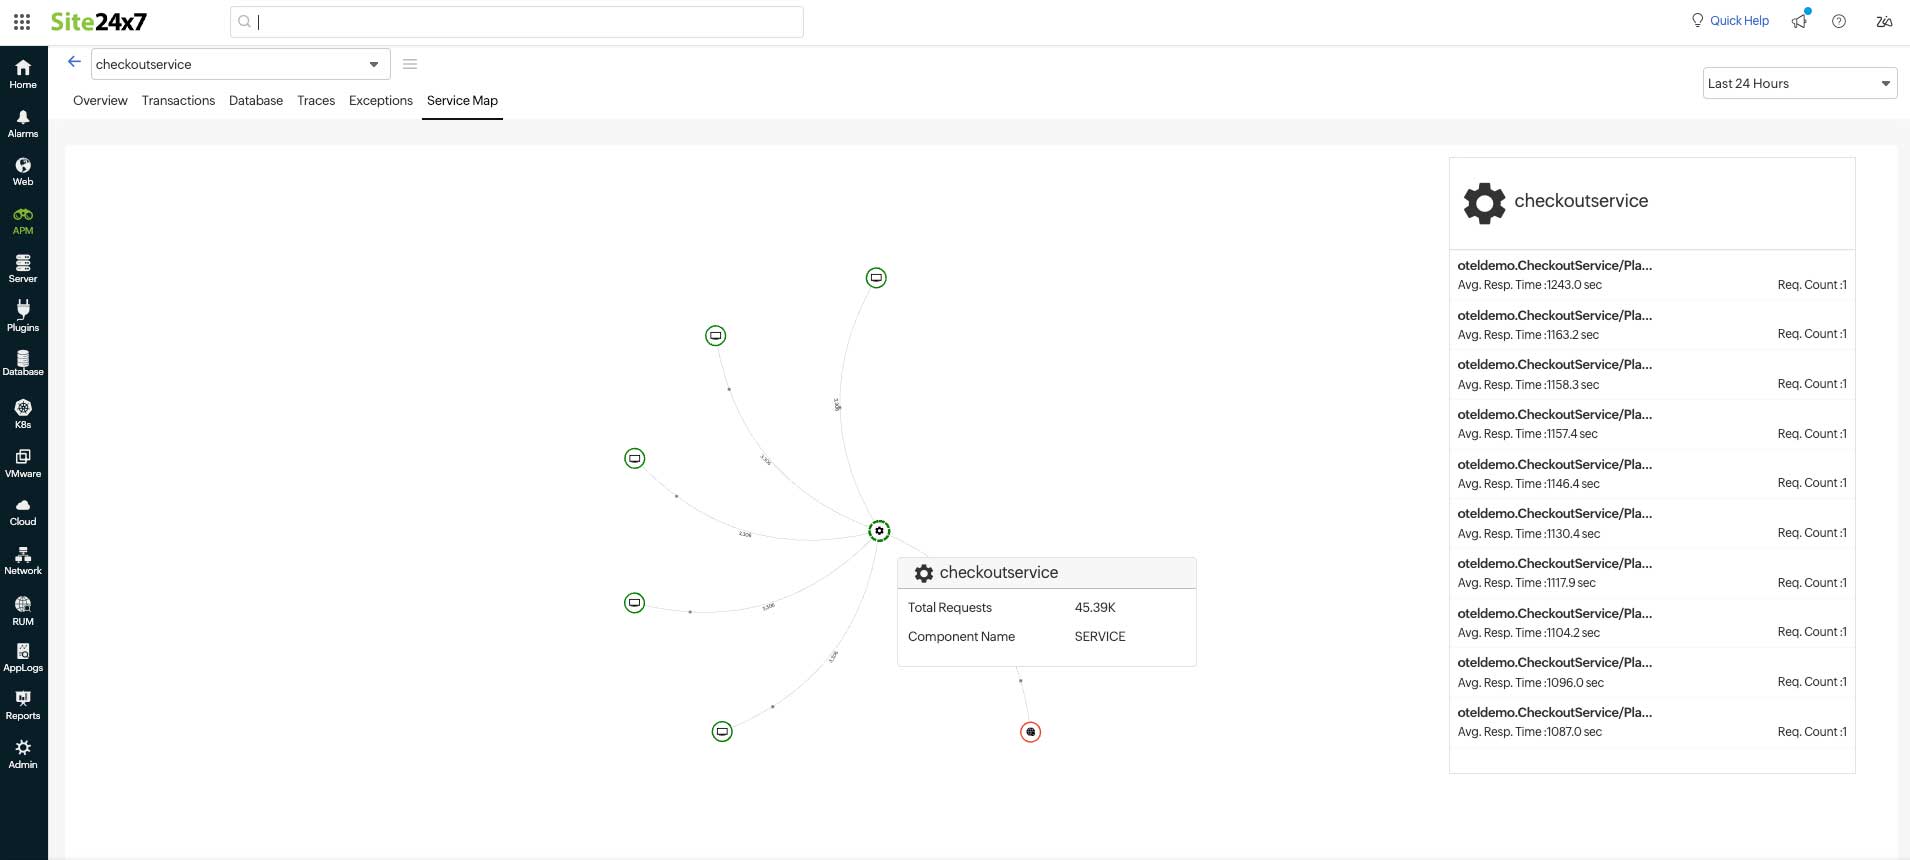
- All-in-one visualization and fast action : Transform OpenTelemetry data into actionable insights in a unified dashboard, visualize traces and dependencies via topology maps , and automate detection and recovery to reduce mean time to resolution.
Getting started: From setup to monitoring
- Install the OTel SDK for your language.
- Add Instrumentation Libraries specific to your frameworks (e.g., Spring Boot, Express.js).
- Deploy the OpenTelemetry Collector (optional).
- Configure Exporters using OTLP for Site24x7’s collector endpoint.
- Validate in Site24x7 –Once metrics and traces start appearing, create custom dashboards and alerts.
With just a few configurations, your application’s telemetry flows directly into Site24x7’s real-time observability dashboards.
The Future of OpenTelemetry-driven observability
As an open standard backed by CNCF , OpenTelemetry continues to evolve with broader language support, enhanced metrics pipelines, and even eBPF-based data collection for zero-code instrumentation. For Site24x7 users, this evolution means more seamless integration and deeper insights into application behavior.
The combination of OpenTelemetry’s open ecosystem and Site24x7’s intelligent APM capabilities ensures that observability becomes an integral than reactive part of your software delivery life cycle.
Ensure resilience in distributed systems
OpenTelemetry isn’t just another monitoring framework, it’s a transformative enabler for cloud-native observability. By standardizing telemetry data across services, languages, and environments, it empowers teams to understand complex systems like never before. When combined with Site24x7's APM , it delivers unparalleled insight, efficiency, and reliability.
From comprehensive trace visualizations to real-time performance analytics, the Site24x7 + OpenTelemetry integration gives engineering and DevOps teams the observability foundation needed to innovate confidently and operate resiliently in the modern distributed world.