Diagnosing and resolving the 500 internal server error with Apache and Tomcat logs
The dreaded 500 internal server error is a common challenge for web administrators, often signaling a disruption in server operations. Diagnosing the root cause requires in-depth visibility into both web server and application behavior. In this blog, we’ll explore how log management tools simplify the diagnosis and resolution of 500 errors by leveraging insights from both Apache and Tomcat logs.
Understanding Apache access logs and Tomcat logs
To diagnose 500 errors effectively, it’s essential to understand the role of each log type:
Apache access logs
Apache access logs record all incoming requests to the web server. They provide information such as the:
- Remote host: The client’s IP address
- Date and time: When the request was made
- Request details: The type (GET or POST), URL, and protocol used
- Status code: The HTTP response code (e.g., 500 for internal server errors)
- User agent: Information about the client’s browser or application
Why they matter
These logs help you identify if multiple 500 errors originated from the same client, URL, or request type. However, they don’t explain why the errors occurred.
Tomcat logs
Since Apache often acts as a reverse proxy for Tomcat, the root cause of a 500 error usually lies in Tomcat logs, which include:
- Catalina.out (a standard Tomcat log): Captures startup messages, application errors, and server issues
- Tomcat access logs: Similar to Apache logs but specific to Tomcat-handled requests
- Application-specific logs: Captures errors from deployed applications, including Java exceptions
Why they matter
While Apache logs confirm the occurrence of a 500 error, Tomcat application logs reveal the underlying cause, such as Java exceptions, database connection failures, or misconfigurations.
Diagnosing 500 errors with a log management tool
A log management tool streamlines error diagnosis by aggregating logs from multiple sources, enabling faster root cause analysis. Here's how it helps:
1. Centralized log collection
Log management tools like Site24x7 automatically collect Apache access logs from their default paths. This eliminates the need for manual log gathering and ensures all logs are available on a single dashboard.
2. Real-time error detection
Instead of manually searching for logs, you can use a log management tool to automatically detect and highlight 500 errors. It allows you to:
- Filter logs by the status code (e.g., HTTP 500 errors).
- Identify frequent error-triggering URLs or clients.
- Spot trends in failed requests over time.
For example, if multiple 500 errors originate from the same URL, Apache logs will show the failing request, while Tomcat logs will indicate the underlying Java exception.
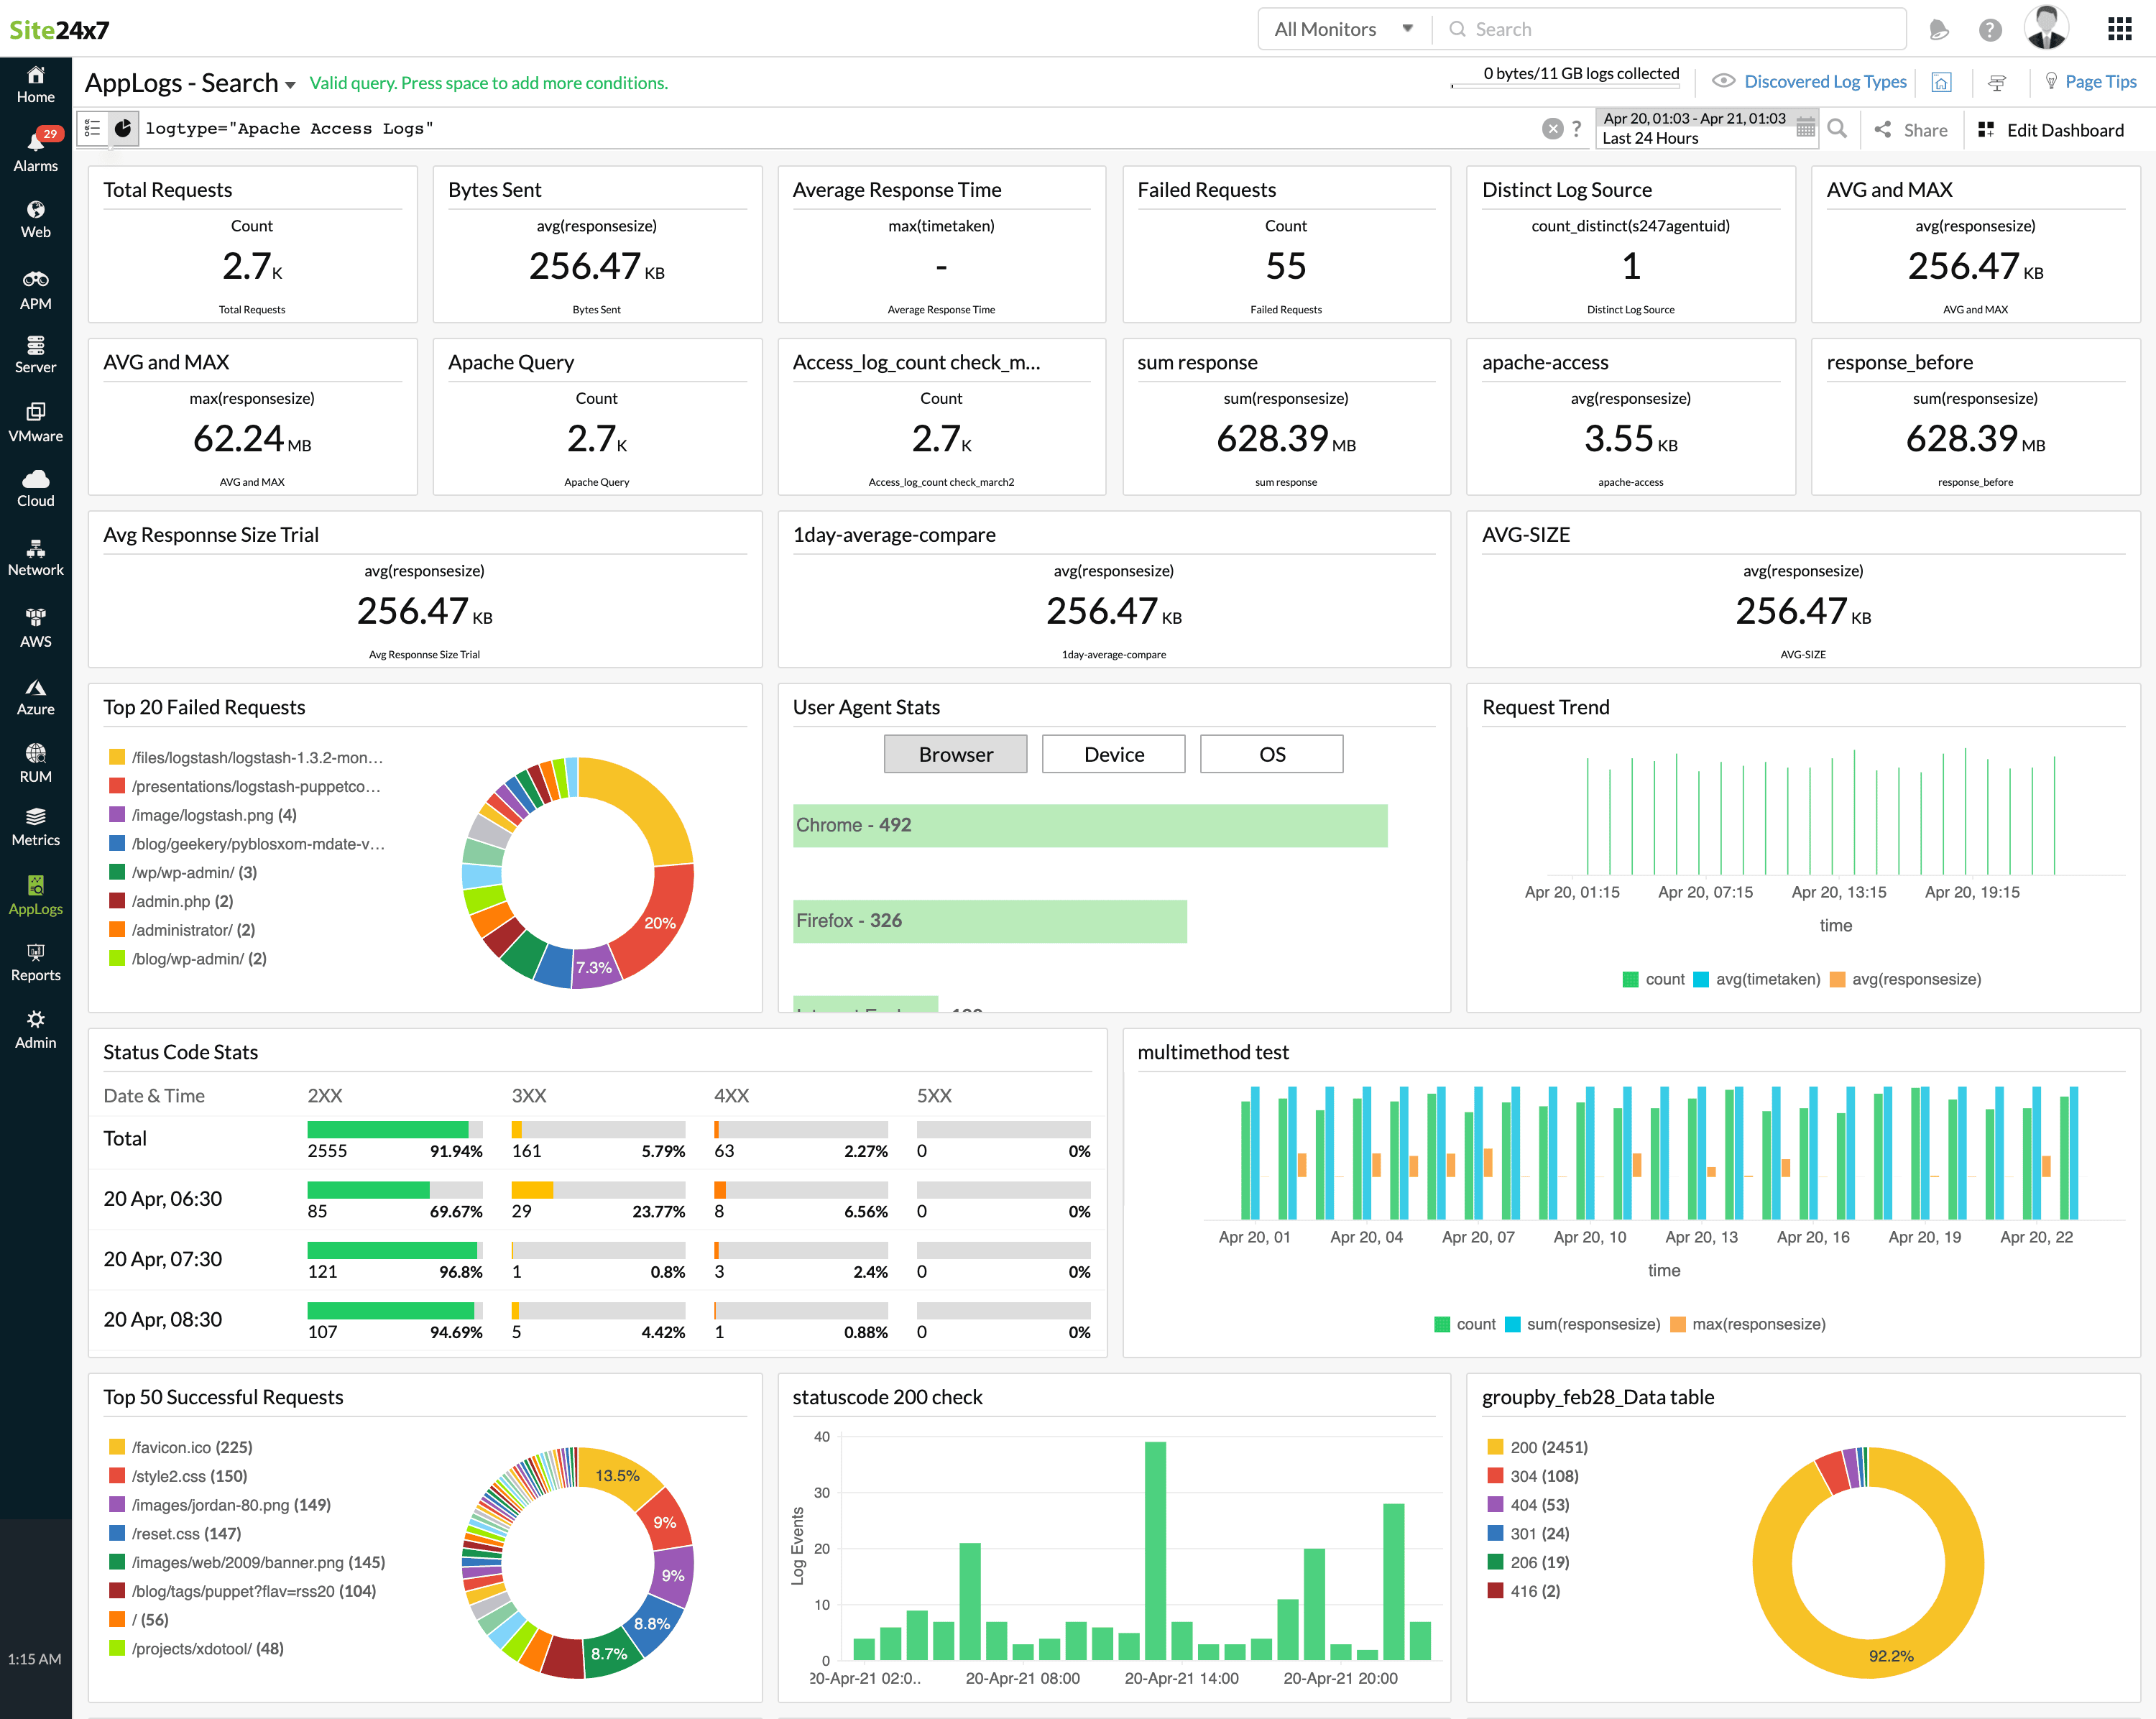
3. Prebuilt dashboards and widgets
Log management tools provide ready-made dashboards for visualizing key metrics:
- The top URLs triggering 500 errors
- Status code trends and response time anomalies
These dashboards offer a bird’s-eye view of server health, helping you detect and resolve issues faster.
4. Advanced searches and filters
Use search queries to isolate problematic log entries. For instance:
- Find all requests with more time taken.
- Identify user agents responsible for repeated failures, such as bots.
- Highlight spikes in 500 errors during a specific timeframe.
5. Alerts for proactive resolution
Set up real-time alerts for spikes in 500 errors or specific log patterns. This helps you prevent extended downtime by detecting errors before they escalate.
6. Enhanced visibility with correlation
Log management tools correlate access logs with performance metrics like the CPU load, memory usage, and network bandwidth. This correlation can reveal if server resource exhaustion is contributing to 500 errors.
Resolving 500 errors with actionable insights
Once you’ve diagnosed the root cause of 500 errors using a log management tool, you can take steps to resolve them:
- Fix application-level bugs: Address errors in the Java code, database queries, or third-party API integrations.
- Set up continuous monitoring: Use real-time alerts and dashboards to help prevent recurring errors.
Streamline troubleshooting with log management
A log management tool simplifies troubleshooting by aggregating logs, detecting errors, and providing real-time insights. With Site24x7’s log management, IT teams can quickly identify, analyze, and resolve 500 errors, ensuring a more stable, efficient web environment. Optimize your server performance today with smarter log monitoring for faster issue resolution and minimal downtime.
Comments (0)