Database monitoring for beginners
That's why tracking your databases gives you the visibility into how your databases are performing under the hood.
This guide is for anyone new to the world of database monitoring—developers, operations engineers, or even curious team leads—looking to understand what it is, why it matters, and how to get started.
What is database monitoring?
Database monitoring is the practice of continuously observing the performance, availability, and health of your database systems. It involves collecting and analyzing metrics like query performance, CPU usage, disk I/O, connection counts, and error rates so you can detect issues, troubleshoot problems, and make informed decisions.
Monitoring is more than just watching metrics; it's understanding the behavior of your database. It helps you answer questions like:
Why is a query suddenly slower than usual?
Is my memory consumption creeping up?
Why should you monitor your databases?
The slowest and most complex part of your application stack is often your database. Here's what effective database monitoring helps you achieve:
- Controlled downtime: Identify any performance degradation or connection issue before these have a major impact on your database.
- Enhanced user experience: When your queries are faster and your databases are optimized, it means smoother and more responsive apps.
- Optimized resources: Track memory, CPU, and I/O usage to ensure efficient allocation and avoid overprovisioning.
- Quicker troubleshooting with root cause analysis: Go from symptom (slow checkout) to cause (a query is locking the table).
- Support scaling decisions: Know when it's time to tune indexes, upgrade instances, or refactor queries.
Key metrics to monitor
Focus on these core categories:
1. Query performance
- Slow queries
- Query throughput
- Query latency
2. Resource usage
- CPU and memory usage
- Disk I/O
3. Connections
- Active connections
- Connection spikes
4. Errors and locks
- Deadlocks or timeouts
- Failed queries or transactions
Let's get you started with database monitoring
Here's a simplified five-step process to help you ease into database monitoring:
1. Choosing the right monitoring tool
Pick tools that are compatible with your database type, whether MySQL, PostgreSQL, SQL Server, etc., and include built-in dashboards, alerting, and integrations with your existing ecosystem.
2. Start with the basics, beginning with the system
Observe performance with CPU, memory, disk I/O, and connection metrics before diving into query-level insights. Build familiarity step-by-step.
3. Probe into your database and get insight into the queries that need attention
Gain visibility into the queries that are problematic and take too much time to execute.
4. Set meaningful alerts
Avoid alert fatigue by starting with critical thresholds—like CPU above 90% or query response time above one second.
5. Drill deeper into slow queries
After getting comfortable with performance analysis, analyze slow query logs. This is where real optimization happens.
6. Monitor trends, not just spikes
Observe patterns over time and investigate any anomalies, even small ones, as they can indicate larger underlying issues. Never ignore even the smallest deviations from standard health.
6. Optimizing with IT automation
Why wait for an outage? Optimize your database before any major impact. Automate tasks so that everything runs smoother consistently.
Practical database monitoring
You may run a single-instance MySQL database or manage a fleet of PostgreSQL replicas across regions. But the core principles remain the same: visibility, alerting, and optimization.
Site24x7 helps you achieve these principles and makes database monitoring accessible—even if you’re just getting started.
Site24x7 for basic and advanced database monitoring
When you rely on MySQL, PostgreSQL, Oracle, SQL Server, or cloud-managed services like Amazon RDS and Azure SQL for your operations, Site24x7 gives you deep visibility without the complexity.
- Out-of-the-box support for popular databases: Monitor relational and NoSQL databases with prebuilt configurations, no manual setup required.
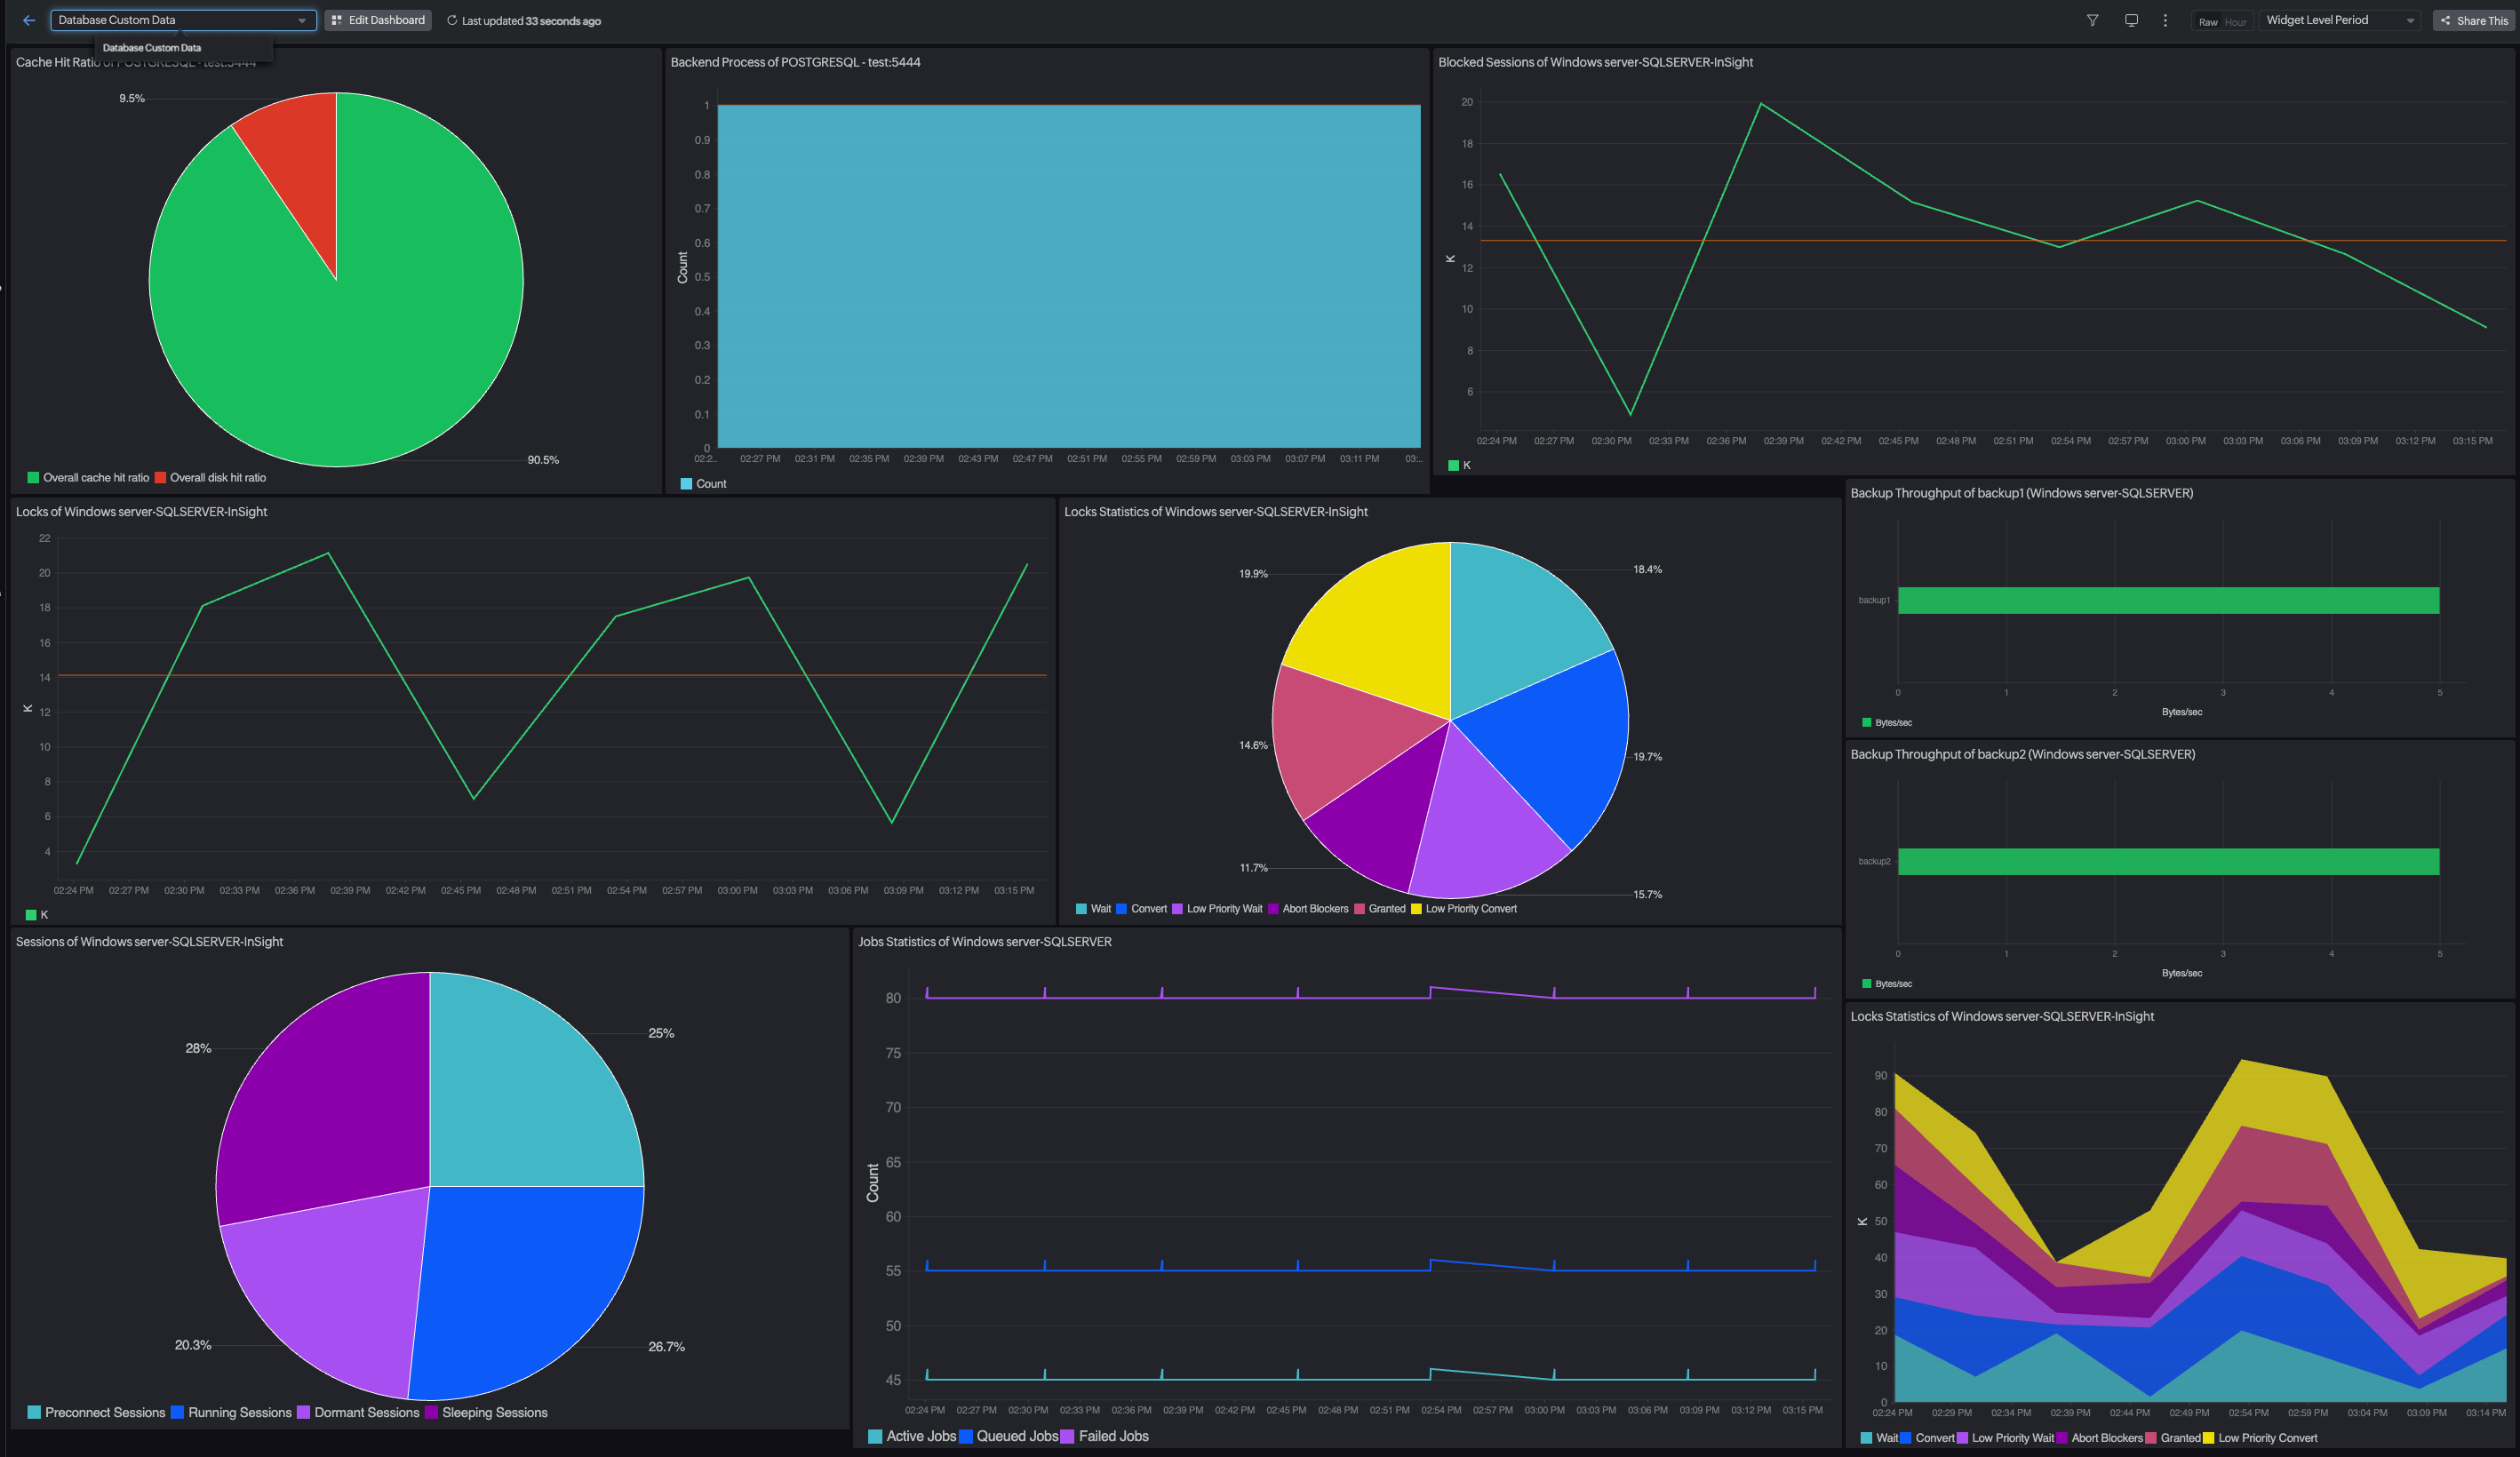
- Real-time performance insights: Track slow queries, connection spikes, lock events, and I/O bottlenecks with live metrics and visual dashboards.
- Built-in query analytics: Dive deep into query execution time, frequency, and resource consumption to pinpoint what’s slowing you down.
- Smart alerts and anomaly detection: Get notified before issues escalate with adaptive thresholds that reduce alert noise.
- Unified monitoring experience: View your databases alongside your infrastructure, applications, and cloud services with an all-in-one platform.
Whether you're debugging a sudden spike in CPU usage or analyzing long-term trends in query latency, Site24x7 gives you clarity and confidence to take action.
Make monitoring a habit
Database monitoring isn't a one-time setup—it's an ongoing discipline. The more visibility you build into your systems, the more confidently you can scale, optimize, and innovate. And as you grow in your monitoring journey, you'll find that what once seemed like noise—metrics, logs, traces—starts to tell a clear story.
As you become more comfortable with database monitoring, consider expanding your focus to include security aspects. Identify potential security breaches with the early warning systems, like failed login attempts, unusual access patterns, and unauthorized data modifications. While not always considered part of basic performance monitoring, integrating security checks is a crucial step in protecting your valuable data.
Ready for the next step?
Start monitoring your databases with Site24x7 and gain instant visibility into what matters most.