Why Monitoring Your Application's Performance is the Key to Business Success
Update:~Visualize Web Transactions end to end, with performance metrics of all components starting from URLs to SQL queries with Site24x7 APM Insight
Application down-time can be nightmarish
Consider you are the owner of an~e-business~portal and due to the slow response time of a search request, a customer decides to move to a competitor's website. That's certainly painful. Just imagine the amount of revenue and goodwill you lose.~Outages~always~have a negative impact on the company.~ The best strategy~to counter downtime is to proactively monitor the performance of~your applications and ensure 100% uptime, always. Read along to find out some of the key stats that you might want to monitor.
What would you want to monitor?
Some of the key metrics that you would like to keep a tab on to maintain application uptime are:
- Application Response Time
- Apdex Score
- Throughput
Application Response Time:
This would give you the exact picture of the response time taken by each application.~This metric would help in identifying slow applications and isolate bottle necks quickly.~An increase in the response time of an application could also be an indication of future issues that may crop up anytime.~Thus, it is~important~to monitor~the~metrics~related to Application Response Time~constantly for optimum~application~performance.
Apdex Scores:
Application Performance Index (Apdex) gives you the statistics from a user experience perspective.~It is an open standard to measure~ user satisfaction regarding a web application. It is a metric that provides a single score ranging between 0-1 (0 = no users satisfied, 1 = all users satisfied), giving business application owners an insight into the measure of their customer happiness and satisfaction levels.
The data collected over a period of time are converted into a simple index based on the application responsiveness. Application responsiveness is categorized into three~zones based on the~Apdex~score:
-
Satisfied: This represents the time value (T seconds) below which users are not impeded by application response time. Depicts the user is fully productive.
-
Tolerating: This represents response time greater than T (precisely, T to 4T), where the user notices performance lag but continues the process, which depicts the response is tolerated by the user.
- Frustrated: This represents response time F, greater than 4T which is unacceptable, and users may abandon the process, which depicts the user is frustrated.
The value T can be defined by the application owners. The Apdex Score is calculated using the following formula:
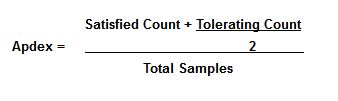
The score of 1~shows~all the users are satisfied with the application performance, whereas a score of 0 shows~all the users are~dissatisfied.~Score of 0.5 shows all the users are tolerating the application performance. As the application responsiveness varies, the score ranges from 0-1.
Tracking~these~metrics~continuously~would also give you a holistic feel of the user experience on the performance of your multiple applications.
 ~
~
Throughput:
The amount of data moved successfully from one place to another in a given time period is~also a critical factor and has to be constantly monitored. This gives you a holistic picture of how your App Server is performing and how it can be rationalized.
The ideal monitoring solution would give you a clear picture on the statistics of all these important metrics and also keep track of slow database calls, database usage, overall performance of the database~and other vital parameters.~Another key statistic that you might want to monitor would be the individual~ traces invoked by a single web request for deep dive monitoring, just to see how the various methods have performed for a holistic application performance monitoring experience. And, if your monitoring system can do all of this from the cloud, then nothing like it. You get complete flexibility and freedom to monitor on the go. Leave a comment below to add to the list of metrics that you feel are critical to monitor for maintaining optimum application performance.