
Everything you need to monitor Java application performance
Track response times and distributed traces across services
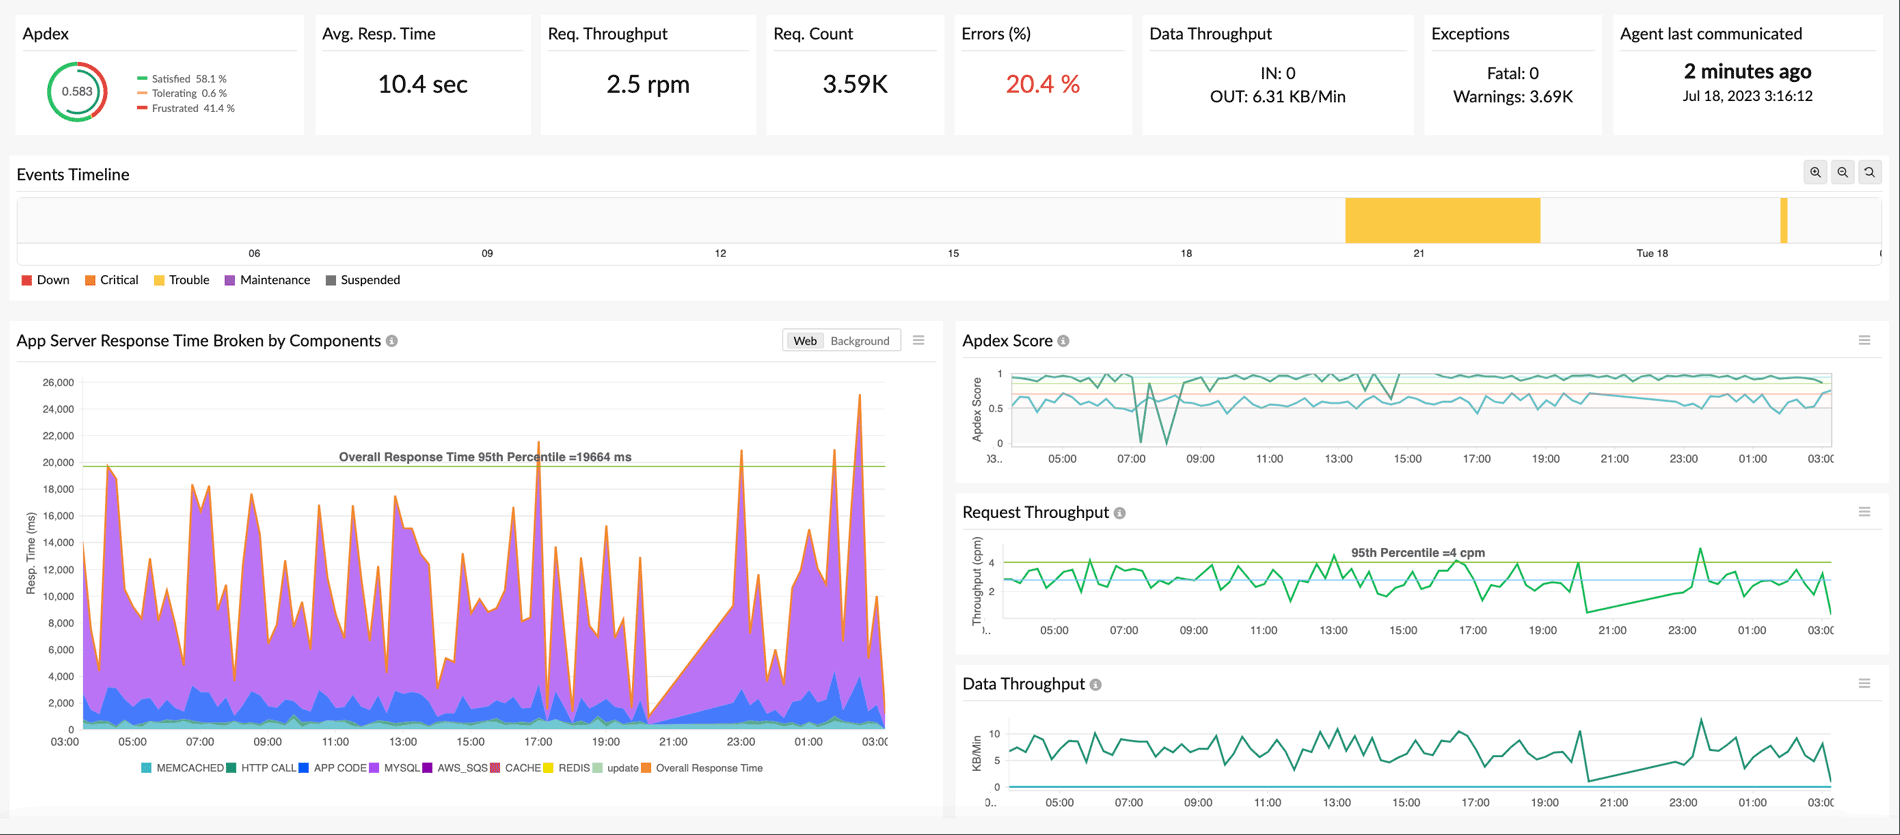
Capture every web transaction flowing through your Java application and break it down into individual method calls, database queries, and external HTTP requests. APM Insight records P95 and P99 latency percentiles, throughput (requests per second), and error rates so you can spot regressions the moment they appear.
For microservices architectures, distributed tracing follows a single request as it hops between services, queues, and databases. Each trace displays a hierarchical tree of invocations so you can see exactly which service or method introduced the delay. View SQL queries alongside their stack traces to identify the exact lines of code triggering slow responses.

Evaluate database queries and external dependencies
Slow database queries are one of the most common reasons Java applications underperform. APM Insight automatically captures every SQL and NoSQL call your application makes and ranks them by execution time, frequency, and error count. When you shift workloads to cache layers like Memcached or Redis, the agent tracks those calls too, giving you a clear before-and-after picture.
- Identify the most frequently accessed database tables and the busiest connection pools.
- Surface expensive or redundant SQL queries that inflate overall response times.
- Correlate database latency with application response time on a single timeline.
- Monitor downstream REST APIs and third-party service calls to isolate external slowdowns.
Whether your Java application relies on MySQL, PostgreSQL, Oracle, MongoDB, or Cassandra, APM Insight delivers the query-level visibility you need to resolve bottlenecks faster.

Monitor JVM metrics and prevent memory leaks
Java application performance monitoring starts at the JVM level. Site24x7 tracks JVM CPU usage, heap and non-heap memory utilization, garbage collection counts and pause durations, loaded class counts, and active thread pools. Continuous monitoring of these metrics helps you catch slow memory leaks — caused by lingering object references or unclosed resources — before they escalate into a fatal OutOfMemoryError in production.
The built-in memory leak detection feature automatically flags abnormal heap growth trends, while AI-powered baselining learns your application's normal behavior over time. Alerts fire only when genuine anomalies occur, reducing noise and letting your team focus on real incidents. You can also monitor JMX metrics for deeper visibility into custom MBeans exposed by your application or framework.

Trace asynchronous requests and custom components
Modern Java applications use background threads, scheduled tasks, and message queues extensively. APM Insight tracks asynchronous request flows end to end, even when a single user action spawns multiple threads or deferred tasks. Because async response times often differ from the parent transaction duration, standard profilers miss the full picture — Site24x7 connects each async span back to its originating trace automatically.
Need visibility into proprietary business logic? Use context-based monitoring to group related transactions, or add custom instrumentation via Java annotations and the APM Insight API. This lets you measure the performance of specific features, modules, or background jobs without altering your application's core code.
How Site24x7 compares to open-source Java monitoring tools
Choosing the right Java application performance monitoring approach depends on your team's size, infrastructure complexity, and operational maturity:
- Profilers like JProfiler and VisualVM: Excellent for local deep-dives during development, but the overhead they add makes them impractical for continuous production monitoring.
- Open-source stacks (Prometheus + Grafana, SigNoz): Good for JVM and JMX metrics collection, yet they require significant effort to configure distributed tracing, OpenTelemetry pipelines, and alerting rules.
- Site24x7 APM Insight: Installs in minutes with a single JVM argument, supports Docker and Kubernetes out of the box, and provides distributed tracing, AI-powered anomaly detection, and integrated alerting without the maintenance burden of assembling a custom observability stack.

Connect back-end traces to front-end experience with auto RUM injection
- Deploy the APM Insight Java agent across AWS Elastic Beanstalk, Azure Web Apps, Docker containers, and Kubernetes pods using environment variables or init containers — no restart scripts needed.
- Enable automatic Real User Monitoring (RUM) injection to correlate server-side traces with actual browser load times, JavaScript errors, and user interactions on the front end.
- Combine APM Insight with Site24x7 Server Monitoring to overlay CPU, memory, and disk I/O from the host infrastructure directly alongside your application traces.
- Use Ansible roles for bulk agent installation across large Java server fleets, reducing setup time from hours to minutes.

Get intelligent alerts and reduce mean time to resolution
Static thresholds generate noise. Site24x7 uses AI-driven baselining to learn what normal performance looks like for each of your Java applications and alerts you only when behavior deviates significantly. This reduces false positives and ensures your on-call team responds to genuine incidents.
- Set threshold-based or anomaly-based alerts on response time, error rate, throughput, and JVM metrics.
- Receive notifications via email, SMS, Slack, Microsoft Teams, PagerDuty, and other integrations.
- Use service maps to visually trace the blast radius of a failure across dependent services and databases.
- Combine APM data with log management to correlate error spikes with specific log entries for faster root cause analysis.
Supported application servers and frameworks


Frequently asked questions about Java application performance monitoring
1. What is Java monitoring?
Java application performance monitoring is the practice of continuously observing the health, speed, and reliability of applications running on the Java Virtual Machine. It involves collecting metrics such as response times, error rates, JVM heap usage, garbage collection activity, and thread states across application servers like Apache Tomcat, Spring Boot, JBoss, GlassFish, and WildFly. The goal is to detect code-level errors, thread bottlenecks, and slow external service calls early so teams can resolve them before end users are affected.
2. Why is Java performance monitoring important?
Without performance monitoring, issues like memory leaks, slow database queries, or thread deadlocks can silently degrade user experience and lead to outages. Java performance monitoring matters because:
- JVM-level insight: Track CPU usage, heap and non-heap memory allocation, and garbage collection pauses to prevent
OutOfMemoryErrorcrashes before they happen. - Latency tracking: Measure P95 and P99 response times in production to catch regressions that averages would hide.
- Distributed tracing: Follow individual requests across microservices to pinpoint the exact service or method causing slowdowns.
- Dependency mapping: Use service maps to see how databases, caches, and third-party APIs affect your application's overall response time.
3. How does a Java application monitoring tool work?
A Java APM tool works by attaching a lightweight Java agent to your application's JVM using a single -javaagent startup argument. The agent instruments bytecode at runtime — intercepting method entries and exits, JDBC calls, HTTP requests, and message queue operations — to capture execution times, error details, and call relationships without requiring any source code changes.
The collected data (metrics, traces, and errors) is transmitted over HTTPS to the monitoring platform, where it is aggregated, baselined, and visualized. Unlike local profilers that add significant overhead, production-grade APM agents are optimized for minimal CPU and memory impact, typically under 2–3% overhead, making them safe for always-on monitoring.
4. What are the benefits of using a dedicated Java monitoring tool?
A dedicated Java APM tool goes beyond what log files or basic health checks can reveal. Key benefits include:
- Thread-level visibility: See active, blocked, and waiting threads alongside garbage collection timing and heap allocations in real time.
- Code-level diagnostics: Identify the slowest methods in a transaction without attaching a profiler or modifying source code.
- Faster incident response: AI-powered anomaly detection and automated alerting reduce mean time to resolution (MTTR) by surfacing problems before users report them.
- Future-proof instrumentation: Support for OpenTelemetry and JMX ensures compatibility with evolving observability standards and custom metric exporters.
5. Why should you choose Site24x7 as your Java performance monitoring tool?
Site24x7 APM Insight combines application-level traces, JVM metrics, server infrastructure monitoring, and Real User Monitoring (RUM) in a single platform — eliminating the need to stitch together separate tools. Supported on Java 8 and above, the agent installs in minutes across standard application servers, Docker containers, and Kubernetes pods. With built-in distributed tracing, AI-assisted anomaly detection, and integrations with notification channels like Slack, PagerDuty, and Microsoft Teams, engineering teams get the context they need to diagnose and resolve Java performance issues from one dashboard.