SLO metrics
Interpret SLO results
The service-level objective (SLO) metrics provide real-time insights into your service performance, error budget consumption, and compliance with the defined SLO targets. This dashboard helps IT admins track service reliability and proactively manage the performance of a service.
The performance summary is classified with these tabs:
- Summary
- Log Report
- Inventory
- Breach History
Summary
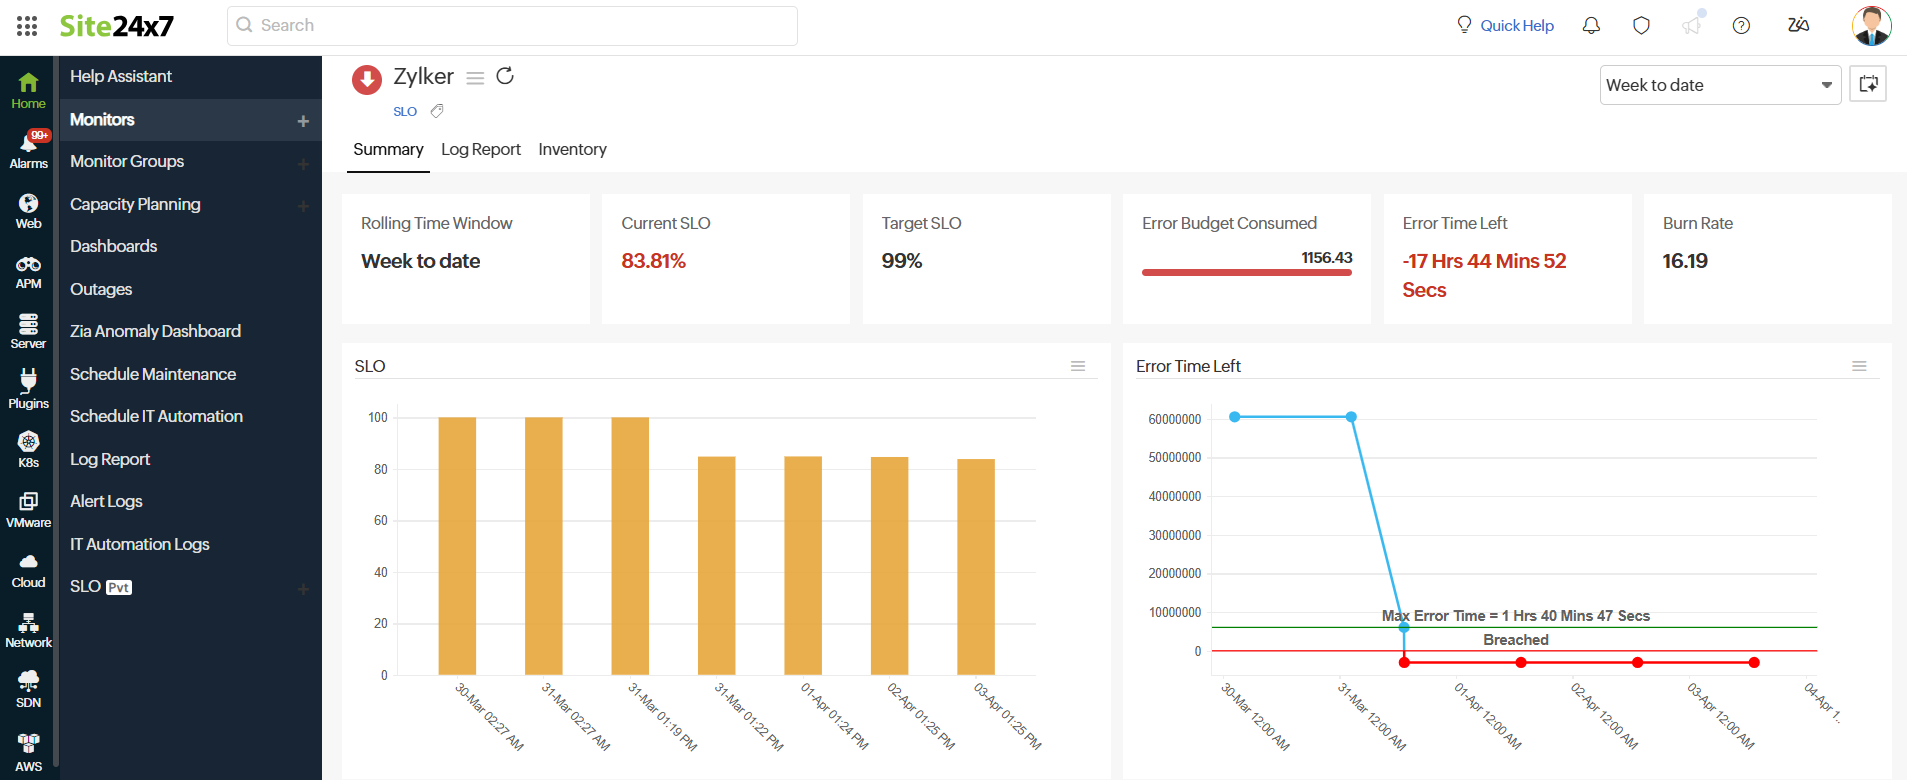
The summary tab lists all SLO metrics. Here are the list of metrics available on the SLO summary page:
| Metrics | Description |
| Rolling Time Window | The continuous period over which the SLO performance is measured. |
| Current SLO | The real-time percentage of successful service availability or reliability of SLO. |
| Target SLO | The predefined reliability goal that the service must meet. |
| Error Budget Consumed | The percentage of allowable downtime that has been used. |
| Error Time Left | The remaining allowable downtime before breaching the SLO. |
| Burn Rate | The speed at which the error budget is being consumed. |
Graphical representation
The summary tab also displays the graphical representations of the key metrics. They are classified as
- SLO
- Error Time Left
- Error Budget Consumed
- Burn Rate
- Service-level indicator (SLI)
-
SLO graph (Bar chart)
This graph displays the SLO performance over time, representing the SLO percentage (0-100%), with timestamps based on the frequency interval.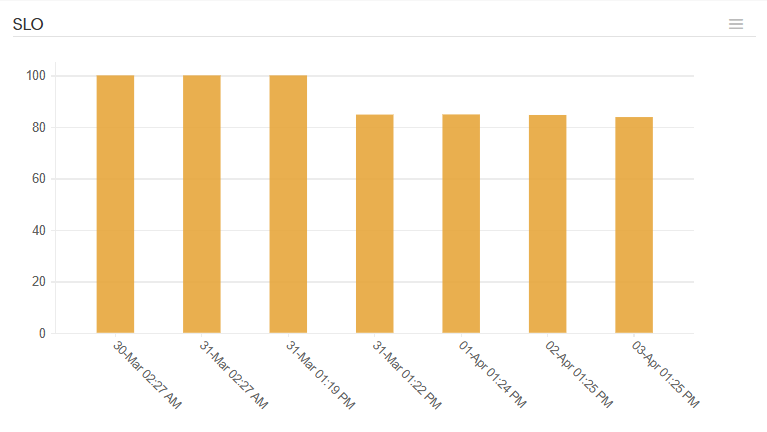
Each bar represents the SLO status at a given frequency, showing consistency or fluctuations in meeting the target.
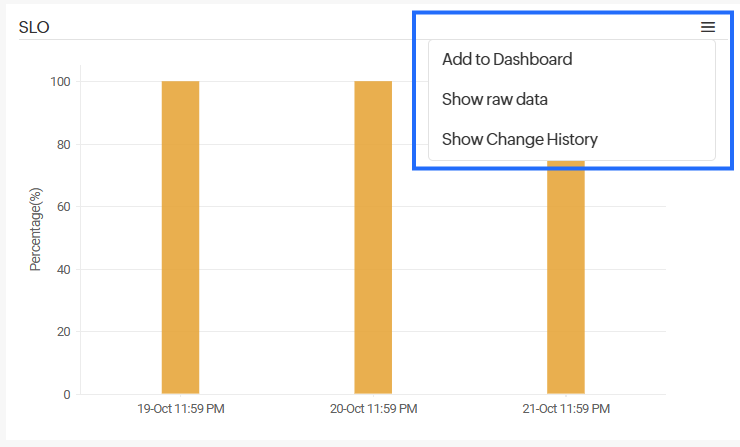
To gain deeper insights and manage your SLO bar chart, click the hamburger icon (☰) to access additional chart options. From here, you can:
- Add to Dashboard: Pin this SLO widget to your existing Custom Dashboard for quick visibility and continuous tracking.
- Show Raw Data: View the detailed underlying data points for calculating SLO performance.
- Display Modification History: Examine the history of modifications made to the SLO and SLI configurations.
-
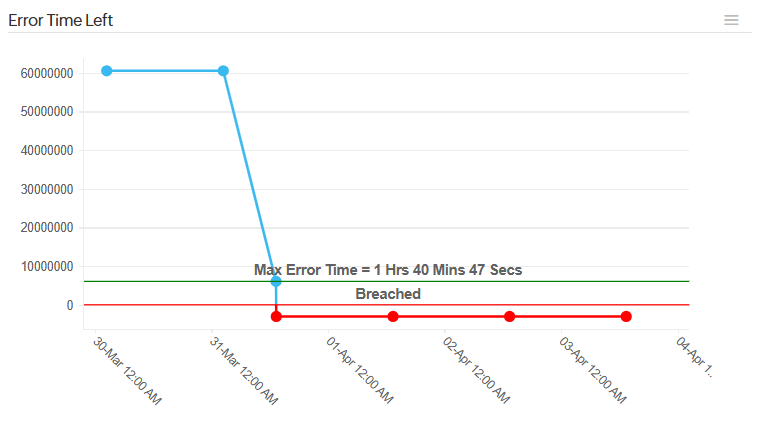
Error Time Left
This graph visualizes the remaining error time over the selected period.
A decreasing trend indicates the service is consuming its error budget and is at risk of breaching the SLO.
Click the hamburger icon (☰) and choose the Add to Dashboard option. This action will pin the SLO widget to your existing Custom Dashboard for easy visibility and ongoing tracking.
-
Error Budget Consumed
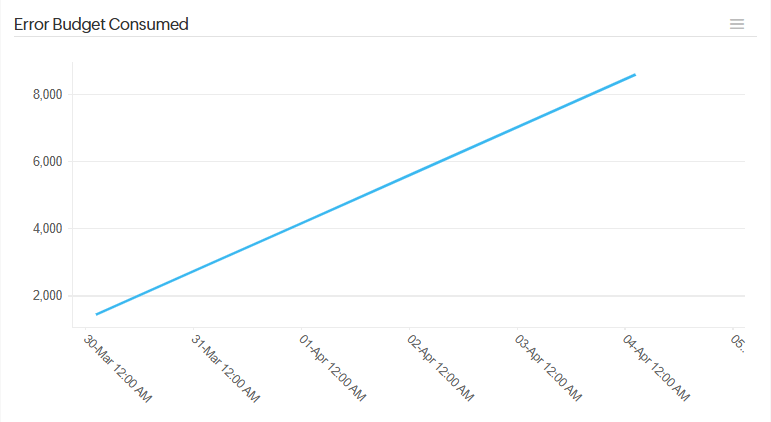
This graph represents the error budget, which is the acceptable level of failure or downtime before an SLO breach occurs.
A rising trend indicates service disruptions are occurring, consuming the error budget.
Click the hamburger icon (☰) and choose the Add to Dashboard option. This action will pin the SLO widget to your existing Custom Dashboard for easy visibility and ongoing tracking.
 Note
NoteA flat line at 0 means we haven't started consuming the error budget.
-
Burn Rate graph
This graph represents the Burn Rate that shows how quickly the error budget is being used over time. A flat line at 0 means the service is stable with no error budget consumption.
A value of the Burn Rate above 1 indicates that the service is encountering failures and consuming the budget.
Interpreting the Burn Rate:- Burn Rate = 1: No errors have been recorded, and the service is meeting the SLO.
- Gradual increase: Minor, occasional errors are occurring but might not be critical.
- Sudden spikes: Service issues are consuming the error budget rapidly, increasing the risk of an SLO breach.
Click the hamburger icon (☰) and choose the Add to Dashboard option. This action will pin the SLO widget to your existing Custom Dashboard for easy visibility and ongoing tracking.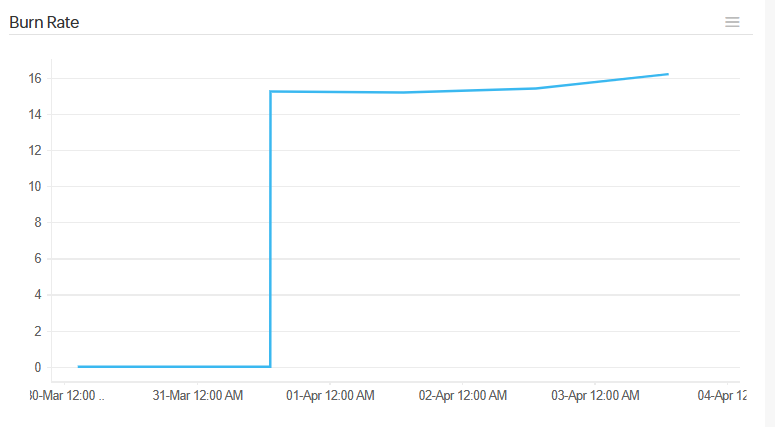
-
SLI graphs
The graph for each SLI that is configured for SLO will be displayed as a graph based on the method of evaluation.
Method of evaluation- Count-based
- Time-based
- Time Slice-based
- Count-based: This method measures the SLO based on the total number of occurrences of a particular event. Consider an API with an SLO of 99.9% success rate; the count-based evaluation will check the number of successful API requests against the total requests within the evaluation period.
If 1,000 requests are made to the API and 999 succeed, the success rate is 99.9%, meaning the SLO is met. If errors exceed 0.1% of the total count, then the SLO is breached. - Time-based: This method evaluates the SLO based on the total time the service was in a good or bad state. Consider a website, www.example.com, which has an uptime SLO of 99.9% uptime. This is assessed based on how long the site remained available. The total time for the website to be up in 30 days is 43,200 minutes. If the SLO is 99.9%, then the service must be up for 43,157 minutes, and the allowable downtime is 43 minutes. If the downtime per month exceeds 43 minutes, then the SLO is breached.
- Time Slice-based: This method assesses SLO compliance by breaking down the evaluation into smaller time intervals known as slices, rather than looking at the entire period at once. For instance, consider a website with an uptime SLO of 99.9% for every hour. In this case, the website must achieve at least 99% uptime during each one-hour slice to meet the SLO, meaning it must be operational for the entire hour.
To access additional options for the chart, click on the hamburger icon (☰). Based on your needs, you can choose from these three options: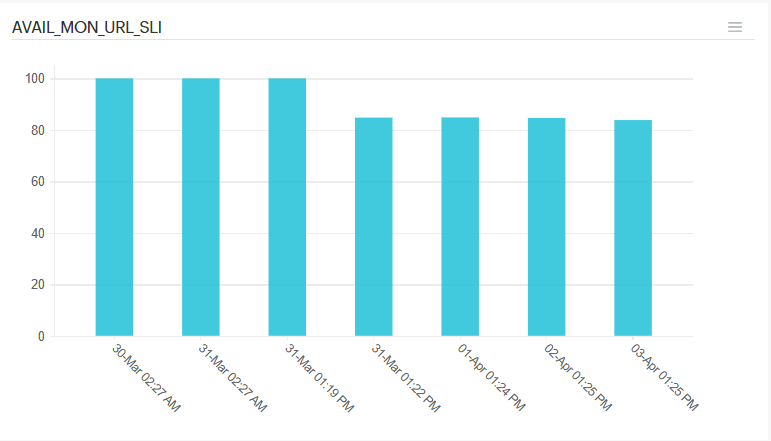
- Edit SLI Name: Allows you to modify the SLI name.
- Add to Dashboard: Pin this SLO widget to your existing Custom Dashboard for quick visibility and continuous tracking.
- View Modification History: Examine the history of modifications made to the SLO and SLI configurations.
-
SLI Report
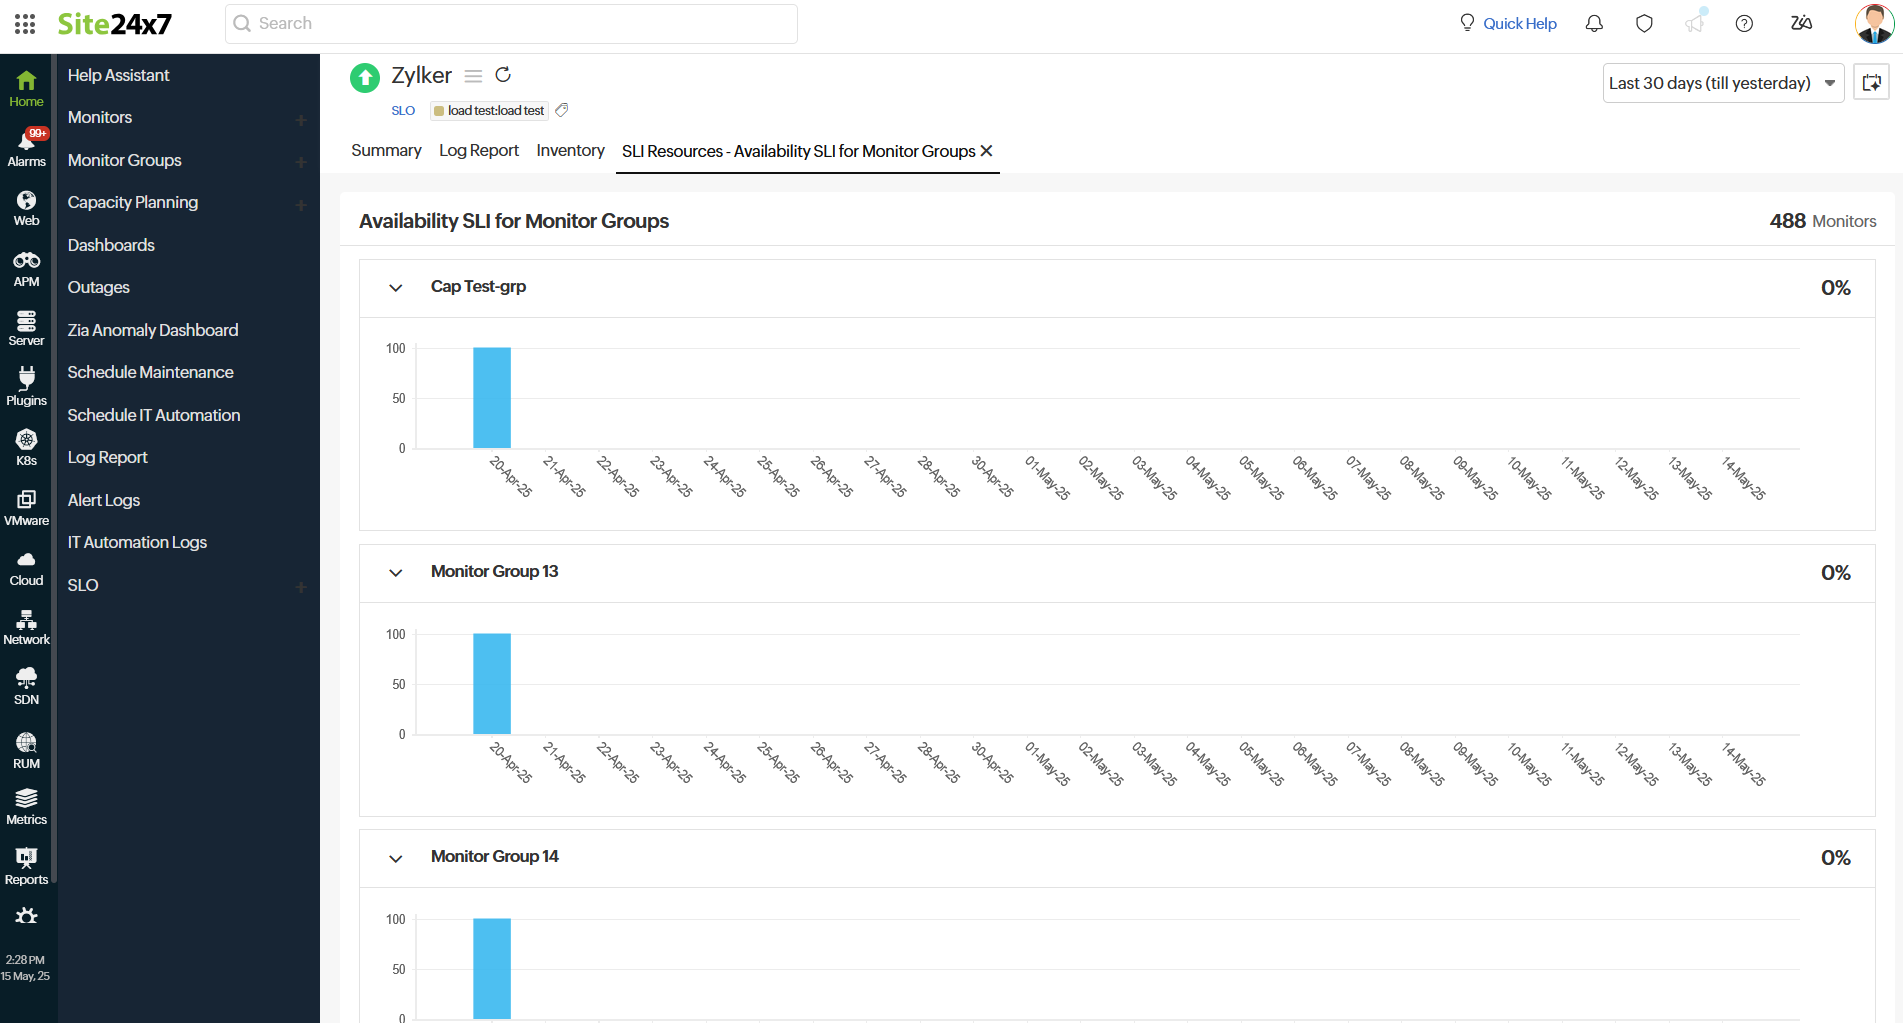
Clicking the graph icon for a specific SLI will open the SLI report. The report features a time-based graph of the SLI for all related monitors and shows the total number of monitors associated with the SLI.
Log Report
With our integrated log records for SLO monitors, you gain in-depth knowledge about the various log details for the SLO monitor configured over a custom period. You can also filter the log based on availability.
Various data—including Collection Time, Status, Error Budget Consumed (%), Error Time Left, Burn Rate, and SLO Compliance (%)—are captured here. You can also filter and export the columns of the log report in CSV format using the table button and click the Download CSV button.
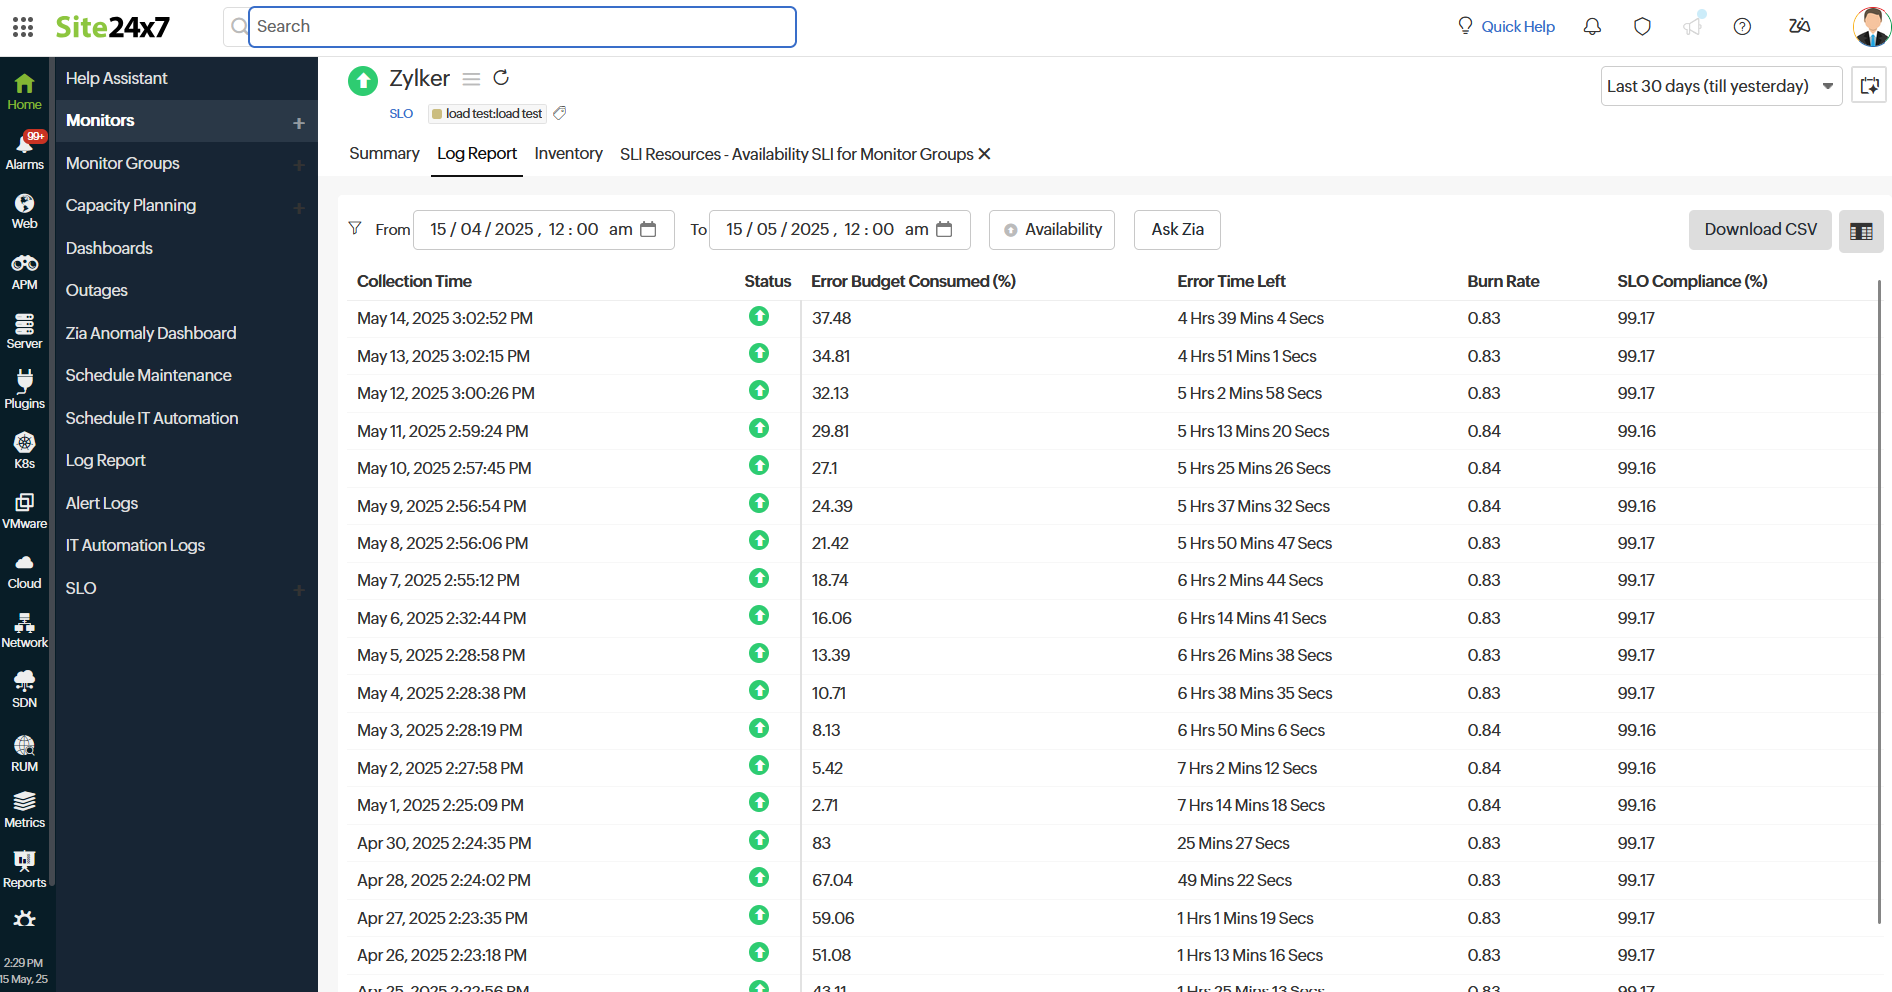
Ask Zia is an AI-powered analytics assistant that helps you retrieve insights and generate reports using natural language queries.
Inventory
The Inventory section captures the monitor information, including the Monitor Licensing Category, Check Frequency, Threshold and Availability Profile, Notification Profile, User Alert Group, Monitor Creation Time, and Last Modified Time.
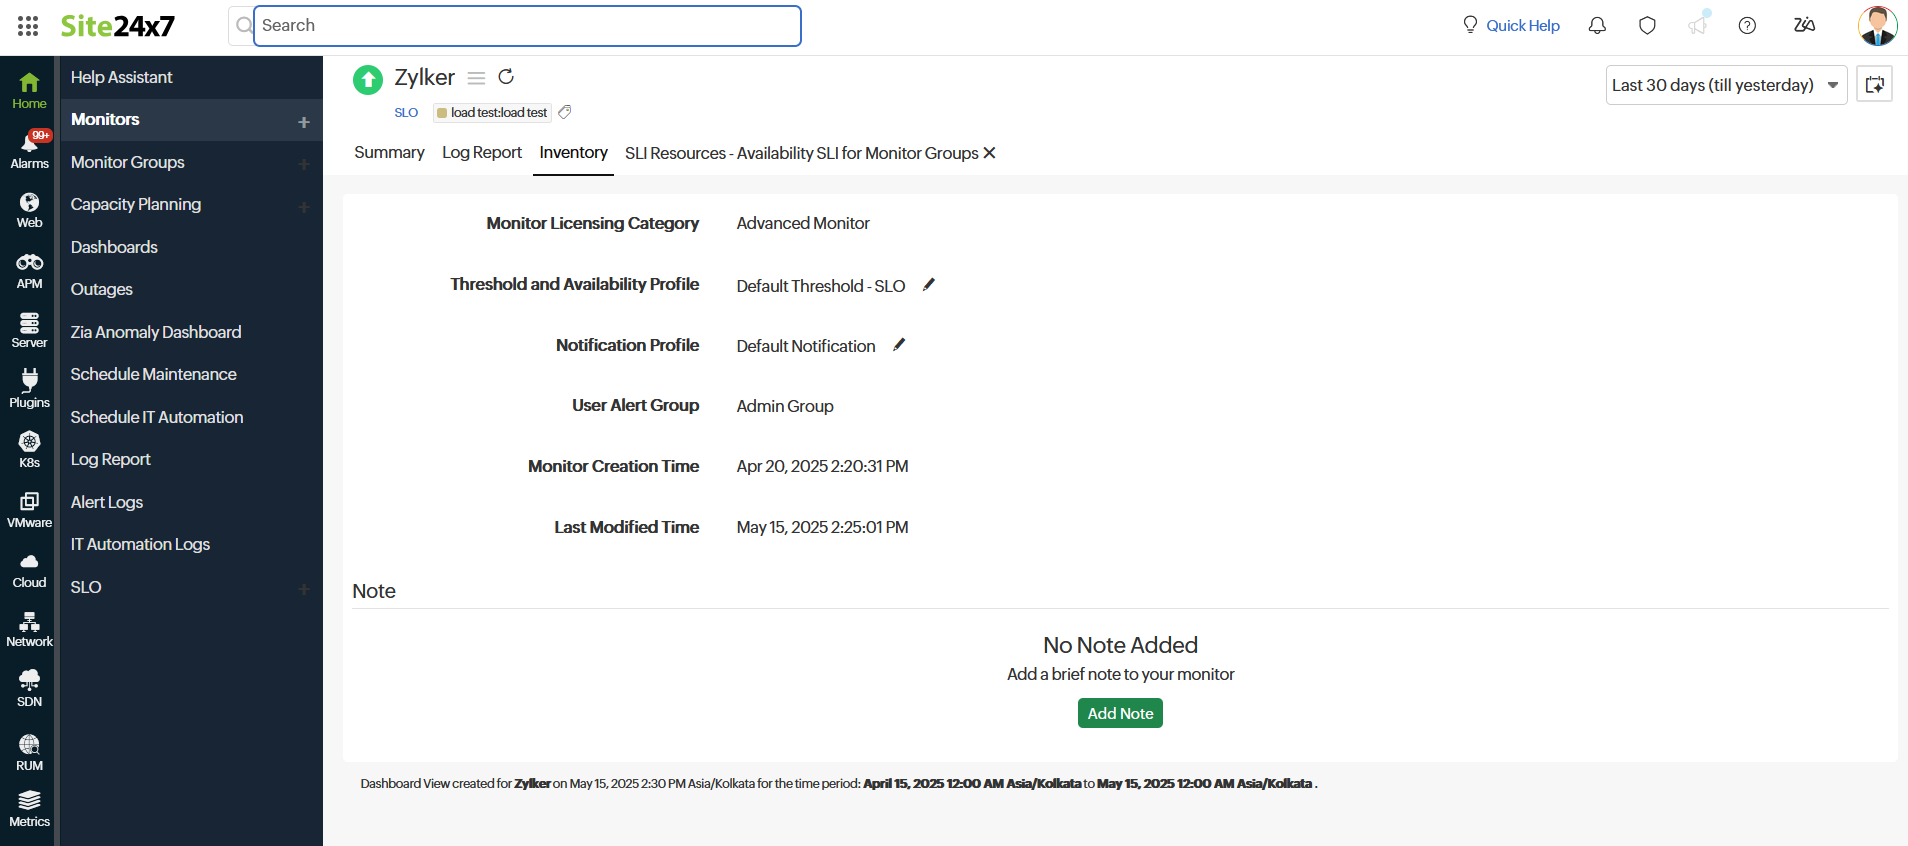
By clicking the Incident Chat button, you start conversations with our bot based on the SLO monitor. You can also add a note for the SLO monitor by clicking on the Add Note button.
Breach History
This section logs all past SLO failures, recording the exact time, duration, and reason for each breach, which helps you quickly identify and address performance issues.
| Metrics | Description |
| Start Time to End Time | Indicates the time period during which the SLO breach occurred. |
| Duration | Shows the total time the breach persisted. |
| Reason | Explains the primary cause or contributing factor behind the SLO breach. |
| Latest Comment | Displays the most recent note or update added for the specific breach incident. |

