Base Database Service monitoring
The Base Database Service within Oracle Cloud Infrastructure (OCI) is a managed database that enables you to deploy Oracle databases with full control over the database environment. It supports both single-instance databases and multi-tenant container databases, which can host multiple pluggable databases (PDBs). This flexible architecture is ideal for enterprise workloads that require isolation, scalability, and simplified database management.
Site24x7 currently supports monitoring for DB Systems associated with the Oracle Base Database service group.
Overview
Site24x7 offers seamless integration with Base Database Service, allowing you to monitor your autonomous or managed database instances effectively. Once integrated, Site24x7 automatically discovers and creates the following child monitors in addition to the Base Database monitor:
- Database: Tracks the Base Database Service instance, whether it is a standalone database or a container database. It captures critical metrics such as CPU utilization, memory usage, IOPS, storage, and uptime. Health status and operational insights are also provided, ensuring the overall database environment runs smoothly.
- Pluggable Database: Provides visibility into individual PDBs hosted within a container database. It tracks metrics like session count, storage usage, open mode (read-only or read-write), and availability. This granularity is essential for diagnosing issues at the PDB level and optimizing application performance.
This comprehensive monitoring setup provides deep visibility into the health, performance, and availability of your database infrastructure.
Use case
Consider a financial services company that runs critical applications on Oracle Base Databases hosted in OCI. During peak transaction hours, the application team notices performance degradation but lacks visibility into the root cause.
With Site24x7's integration for Base Database Service monitoring, the operations team gets real-time insights into CPU spikes, session growth, and IOPS metrics for each database instance and PDB. By analyzing the correlated data from the Database and Pluggable Database child monitors, they quickly identify that a specific PDB is experiencing unusually high session activity, causing resource contention at the container data base (CDB) level.
The alert logs and forecast reports further help them validate that this issue has been building over time. Using this insight, the team redistributes the workload and scales the affected node, restoring application performance. This proactive monitoring approach prevents service disruptions, ensures SLA compliance, and improves customer satisfaction.
Benefits of Site24x7's Base Database Service integration
Site24x7's integration with Base Database Service enables you to:
- Monitor all layers of your Base Database Service deployment, from the base instance to pluggable units.
- Efficiently manage PBDs in a containerized environment.
- Analyze historical performance trends and forecast future resource needs to support proactive capacity planning and cost optimization.
- Receive alerts when a potential threat is detected and take prompt action to address them.
Setup and configuration
- Site24x7 uses cross-tenancy access to monitor your resources using Site24x7's tenancy user. Log in to your Site24x7 account and create a specific policy to allow Site24x7 to view your resources without affecting your security.
- On the Integrate OCI Monitor page, select Base Database from the Services to be discovered list.
Policies and permissions
Ensure that the associated OCI policy has the following statements:
Allow group <your-group-name> to read the database-family in compartment <your-compartment-name>
Allow group <your-group-name> to inspect the database-family in compartment <your-compartment-name>
Ensure that Site24x7 receives the following permissions to monitor your Base Database Service instance:
- ListDbSystems - DB_SYSTEM_INSPECT
- GetDbSystem - DB_SYSTEM_INSPECT
- ListDbHomes - DB_HOME_INSPECT
- ListDatabases - DATABASE_INSPECT
- GetDatabase - DATABASE_INSPECT
- ListPluggableDatabases - PLUGGABLE_DATABASE_INSPECT
- getPluggableDatabase - PLUGGABLE_DATABASE_INSPECT
Polling frequency
Site24x7 queries OCI service-level APIs according to the set polling frequency (from once a minute to once a day) to collect metrics from a Base Database monitor.
Supported metrics
The supported metrics for a Base Database monitor are provided below.
Base Database
Supported metrics for the DB System in the oci_database_cluster namespace
| Metric name | Description | Statistic | Unit |
|---|---|---|---|
| ASM Diskgroup Utilization | Percentage of usable space used in a Disk Group. | Maximum | Percentage |
| Filesystem Utilization | Percentage of utilization of the provisioned file system. | Mean | Percentage |
| CPU Utilization | Percentage of CPU utilization. | Mean | Percentage |
| Memory Utilization | Percentage of memory available for starting new applications without swapping. | Mean | Percentage |
| Swap Utilization | Percentage of utilization of total swap space. | Mean | Percentage |
| Load Average | System load average over five minutes. | Mean | Count |
| Node Status | Indicates whether the host is reachable in RAC environments. | Mean | Count |
| OCPU Allocated | The number of OCPUs allocated. | Mean | Count |
Database
For Database child monitors, if the Database Management option is enabled, you can monitor the health, capacity, and performance of your Base Database Service using metrics from the oracle_oci_database namespace.
Basic management metrics supported for the Database monitor
| Metric name | Description | Statistic | Unit |
|---|---|---|---|
| Monitoring Status | The monitoring status of the resource. | Mean | Count |
| OCPU Allocated | The actual number of OCPUs allocated by the service during the selected interval. | Maximum | Count |
Full management metrics supported for the Database monitor
| Metric name | Description | Statistic | Unit |
|---|---|---|---|
| Allocated Storage Utilization By Tablespace | The percentage of space used by the tablespace, out of allocated space. | Mean | Percentage |
| CPU Time | The average rate of accumulation of CPU time by foreground sessions in the database instance over the time interval. | Mean | Seconds per second |
| DB Time | The average rate of accumulation of database time (CPU + Wait) by foreground sessions in the database instance over the time interval. | Mean | Seconds per second |
| FRA Space Limit | The flash recovery area space limit. | Maximum | GB |
| FRA Utilization | The flash recovery area utilization. | Mean | Percentage |
| IOPS | The average number of IO operations per second. | Mean | Operations per second |
| IO Throughput | The average throughput in MB per second. | Mean | MB per second |
| Logical Blocks Read | The average number of blocks read from SGA/Memory (buffer cache) per second. | Mean | Reads per second |
| Max Tablespace Size | The maximum possible tablespace size. For CDBs, this metric provides data for root container tablespaces. | Maximum | GB |
| Memory Usage | The total size of the memory pool. | Mean | MB |
| Monitoring User Password Expiration | The number of days left before the monitoring user password expires. | Last | Count |
| Non Reclaimable FRA | The non-reclaimable fast recovery area. | Mean | Percentage |
| Parses By Type | The number of hard or soft parses per second. | Mean | Parses per second |
| Processes | The number of database processes. | Maximum | Count |
| Process Limit Utilization | The process limit utilization. | Mean | Percentage |
| Reclaimable FRA | The reclaimable fast recovery area. | Mean | Percentage |
| Reclaimable FRA Space | The flash recovery area reclaimable space. | Mean | GB |
| Redo Generation Rate | The redo generation rate on the primary database. | Mean | MB per second |
| Redo Size | The average amount of redo generated. | Mean | MB per second |
| Session Limit Utilization | The session limit utilization. | Mean | Percentage |
| Sessions | The number of sessions in the database. | Mean | Count |
| Transactions By Status | The number of committed or rolled back transactions per second. | Mean | Transactions per second |
| Usable FRA | The usable fast recovery area. | Mean | Percentage |
Metrics for the DB System in the oci_database namespace
| Metric name | Description | Statistic | Unit |
|---|---|---|---|
| CPU Utilization | CPU utilization expressed as a percentage, aggregated across all consumer groups. The utilization percentage is reported with respect to the number of CPUs the database is allowed to use, which is two times the number of OCPUs. | Mean | Percentage |
| Storage Utilization | The percentage of provisioned storage capacity currently in use. Represents the total allocated space for all tablespaces. | Mean | Percentage |
| DB Block Changes | The average number of blocks changed per second. | Mean | Changes per second |
| Execute Count | The number of user and recursive calls that executed SQL statements during the selected interval. | Sum | Count |
| Current Logons | The number of successful logons during the selected interval. | Mean | Count |
| Transaction Count | The combined number of user commits and user rollbacks during the selected interval. | Sum | Count |
| User Calls | The combined number of logons, parses, and execute calls during the selected interval. | Sum | Count |
| Parse Count | The number of hard and soft parses during the selected interval. | Mean | Count |
| Storage Space Used | Total amount of storage space used by the database at the collection time. | Maximum | GB |
| Storage Space Allocated | Total amount of storage space allocated to the database at the collection time. | Maximum | GB |
| Storage Space Used By Tablespace | Total amount of storage space used by the tablespace at the collection time. In case of a container database, this metric provides root container tablespaces. | Maximum | GB |
| Allocated Storage Space By Tablespace | Total amount of storage space allocated to the tablespace at the collection time. In case of a container database, this metric provides root container tablespaces. | Maximum | GB |
| Storage Space Utilization By Tablespace | The percentage of storage space utilized by the tablespace at the collection time. In case of a container database, this metric provides root container tablespaces. | Maximum | Percentage |
Pluggable Database
Metrics for a Pluggable Database monitor are available only if the Database Management option is enabled for the PDB.
Basic management metrics supported for Pluggable Database monitor
| Metric name | Description | Statistic | Unit |
|---|---|---|---|
| Block Changes | The average number of blocks changed per second. | Mean | Changes per second |
| CPU Utilization | The CPU utilization expressed as a percentage, aggregated across all consumer groups. | Mean | Percentage |
| Current Logons | The number of successful logons during the selected interval. | Sum | Count |
| Execute Count | The number of user and recursive calls that executed SQL statements during the selected interval. | Sum | Count |
| Monitoring Status | The monitoring status of the resource. | Mean | NA |
| OCPU Allocated | The actual number of OCPUs allocated by the service during the selected interval. | Count | Count |
| Parse Count | The number of hard and soft parses during the selected interval. | Sum | Count |
| Storage Allocated | The total amount of storage space allocated to the database at collection time. | Maximum | GB |
| Storage Allocated By Tablespace | The total amount of storage space allocated to the tablespace at collection time. | Maximum | GB |
| Storage Used | The total storage used by the database at collection time, including the space used by tablespaces, flash recovery area, control files, and log files. | Maximum | GB |
| Storage Used By Tablespace | The total amount of storage space used by the tablespace at collection time. | Maximum | GB |
| Storage Utilization | The percentage of provisioned storage capacity currently in use. | Mean | Percentage |
| Storage Utilization By Tablespace | The percentage of storage space utilized by the tablespace at the collection time. | Mean | Percentage |
| Transaction Count | The combined number of user commits and user rollbacks during the selected interval. | Sum | Count |
| User Calls | The combined number of logons, parses, and execute calls during the selected interval. | Sum | Count |
Full management metrics supported for Pluggable Database monitor
| Metric name | Description | Statistic | Unit |
|---|---|---|---|
| Allocated Storage Utilization By Tablespace | The percentage of space used by the tablespace out of allocated space. | Mean | Percentage |
| CPU Time | The average rate of accumulation of CPU time by foreground sessions in the database instance over the time interval. | Mean | Seconds per second |
| DB Time | The average rate of accumulation of database time (CPU + Wait) by foreground sessions in the database instance over the time interval. | Mean | Seconds per second |
| IOPS | The average number of IO operations per second. | Mean | Operations per second |
| IO Throughput | The average throughput in MB per second. | Mean | MB per second |
| Logical Blocks Read | The average number of blocks read from SGA/Memory (buffer cache) per second. | Mean | Reads per second |
| Max Tablespace Size | The maximum possible tablespace size. | Maximum | GB |
| Memory Usage | The total size of the memory pool. | Mean | MB |
| Monitoring User Password Expiration | The number of days left before the monitoring user password expires. | Last | Count |
| Parses By Type | The number of hard or soft parses per second. | Mean | Parses per second |
| Redo Size | The average amount of redo generated. | Mean | MB per second |
| Sessions | The number of sessions in the database. | Mean | Count |
| Transactions By Status | The number of committed or rolled back transactions per second. | Mean | Transactions per second |
| Unusable Indexes | The number of unusable indexes in the database schema. | Maximum | Count |
| Wait Time | The average rate of accumulation of non-idle wait time by foreground sessions in the database instance over the time interval. | Mean | Seconds per second |
Threshold configuration
To configure thresholds for a Base Database monitor:
- Log in to Site24x7 and navigate to Admin > Configuration Profiles > Threshold and Availability.
- Click Add Threshold Profile.
- Select Base Database from the Monitor Type drop-down menu and provide an appropriate name in the Display Name field.
- The supported metrics are displayed in the Threshold Configuration section. You can set threshold values for all the metrics mentioned above.
- Click Save.
Status propagation in OCI Base Database monitors
Site24x7’s OCI Base Database integration supports status propagation across database components.
When status propagation is enabled:
- Alerts for child monitors such as Databases and Pluggable Databases are disabled by default.
- Status change alerts from child monitors are suppressed unless you set Skip Alert to No in the Edit Threshold page.
- A single alert is triggered from the parent Base Database monitor.
This reduces alert noise across database layers.
Alerts are automatically disabled for child monitors that support status propagation.
For example, if a pluggable database encounters an issue, the parent Base Database monitor raises a single alert indicating a database problem.
Forecast
Estimate future values of all the above supported metrics with the Forecast feature. Predict future points of the performance metrics (i.e., measurement of resource usage) based on historical observations and make informed decisions.
Licensing
Each Base Database, Database, and Pluggable Database monitor utilizes one basic monitor license.
Viewing Base Database data
To monitor your Base Database Service environment, log in to your Site24x7 account and navigate to Cloud > OCI > Base Database.
Monitor data
Base Database
The monitor data for the Base Database monitor is given below.
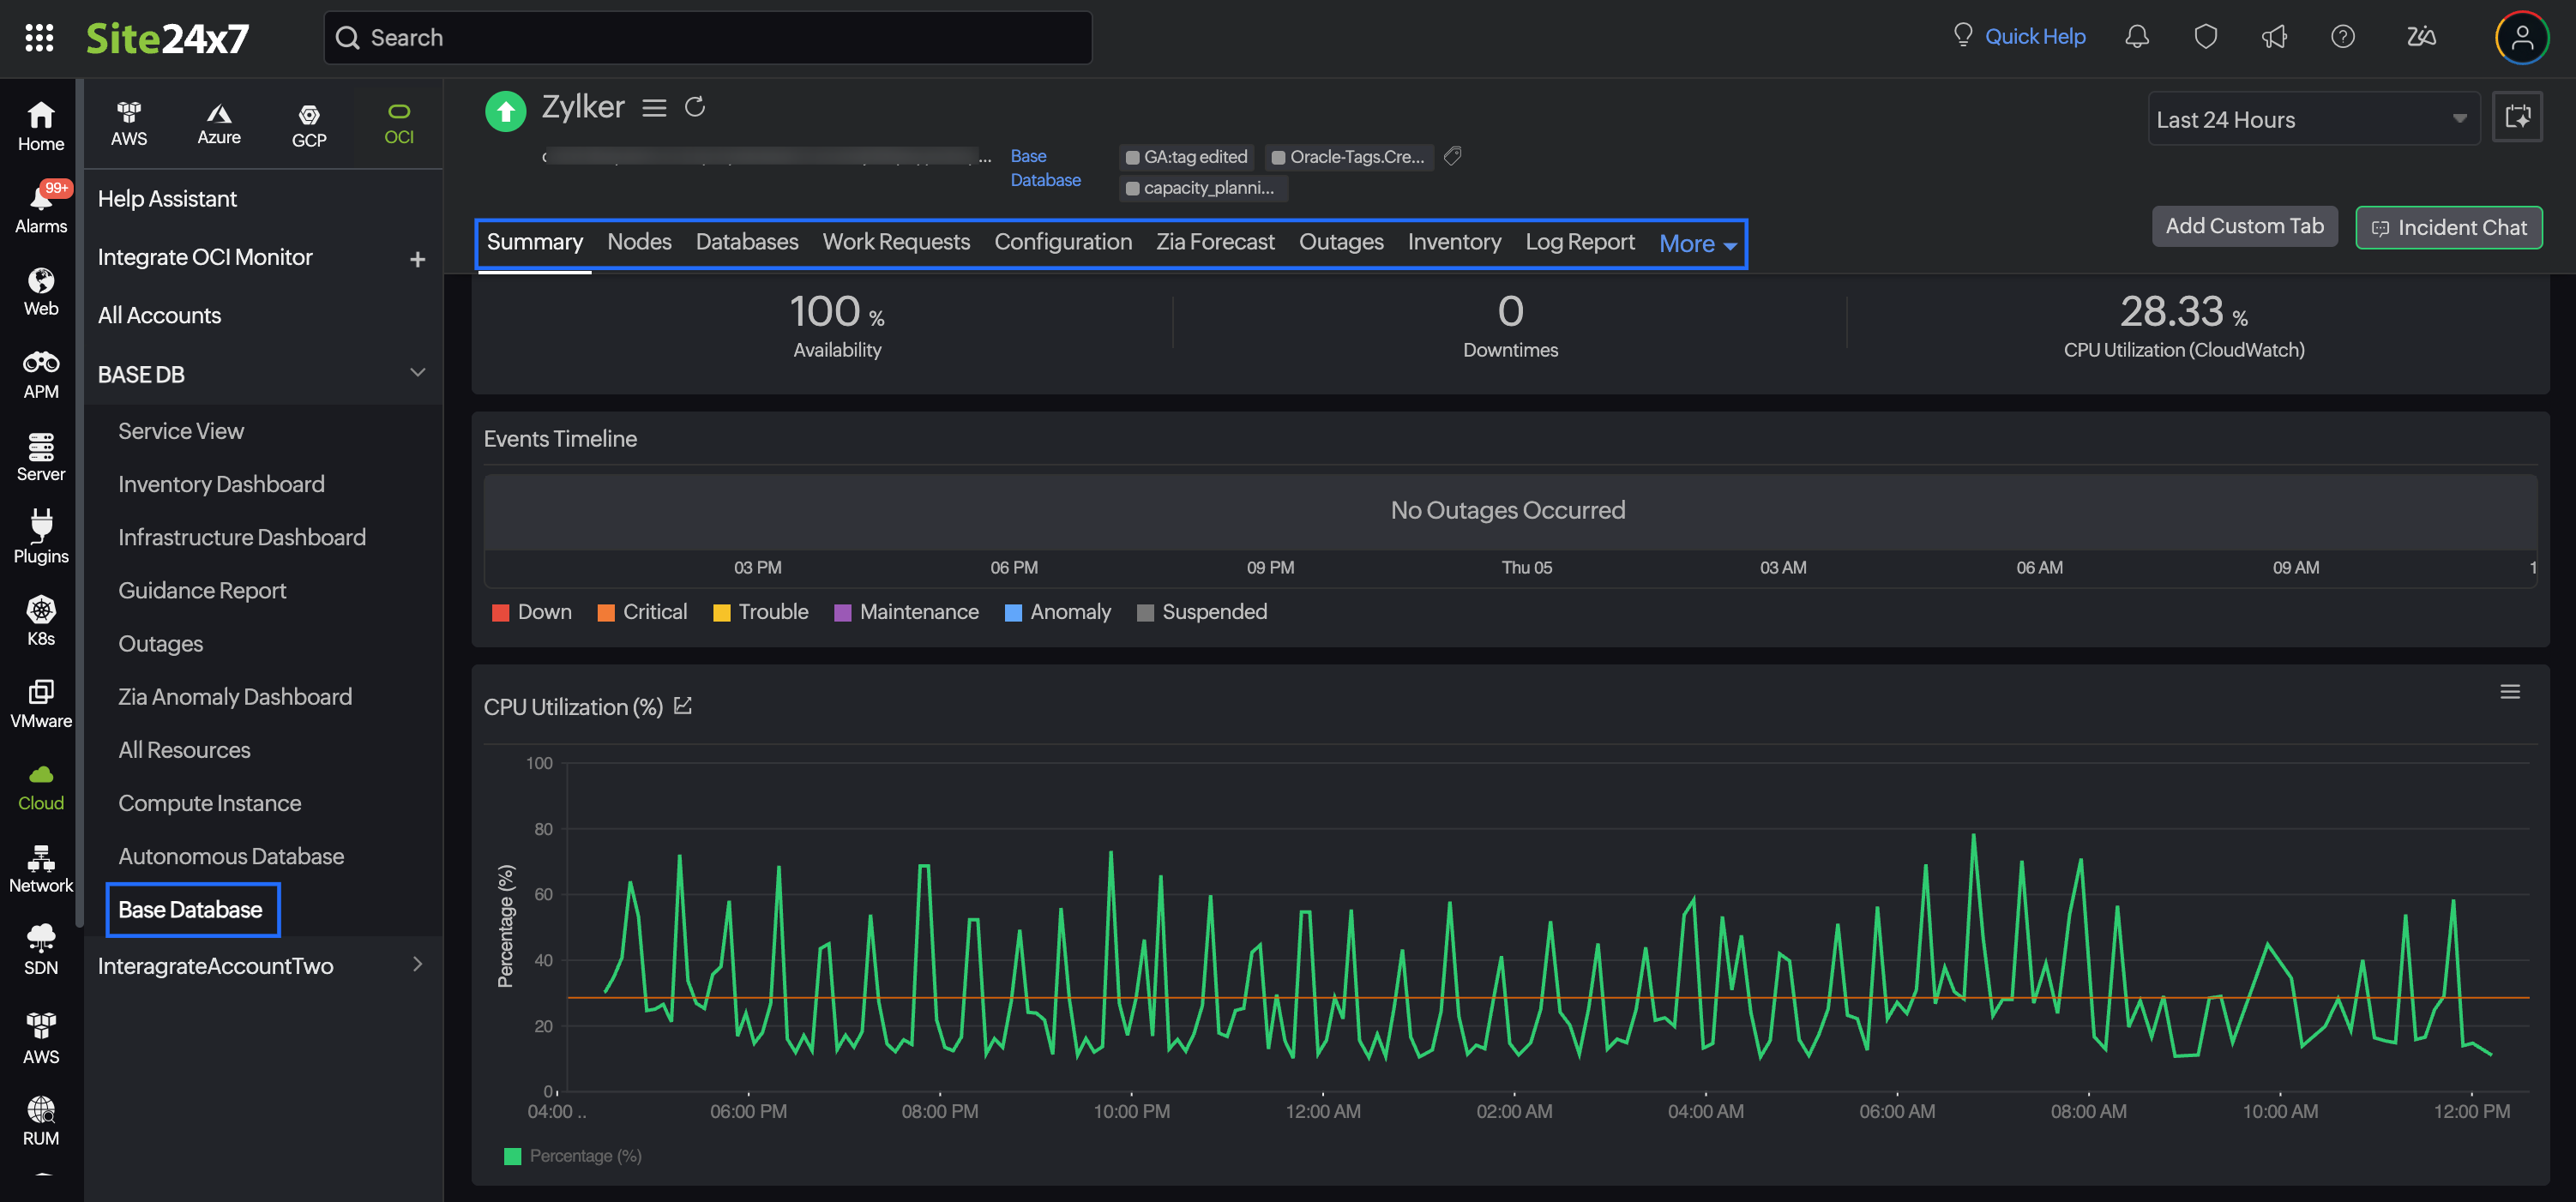
Summary
The Summary tab provides an overview of the events timeline and metrics in the form of charts.
Nodes
The Nodes tab lists all the nodes associated with the Base Database monitor. You can view the node name, current availability status, public and private IP addresses, and fault domain to understand availability zone placement for redundancy.
Databases
The Databases tab displays a list of all Database child monitors. To view the Base Database monitor details, click the desired monitor name hyperlink. You can drill down into individual databases to see performance metrics such as session counts, open modes, memory usage, and availability.
Work Requests
The Work Requests tab shows all recent maintenance or administrative actions (e.g., scaling, backup, patching) initiated on your Base Database Service. This is crucial for tracking configuration changes and understanding performance fluctuations related to maintenance activities.
Configuration
From the Configuration tab, view the basic configuration details about your Base Database monitor, such as Created Time, Lifecycle State, and Availability Domain.
Zia Forecast
From the Zia Forecast tab, get a forecast chart that displays future points of a performance metric (measurement of resource usage) based on historical time series data. Thirty days of historical data is used to predict what your metric usage will be in the next thirty days.
Outages
The Outages tab provides details on an outage's start time, end time, duration, and comments (if any).
Inventory
From the Inventory tab, obtain details like Base Database ID, Region, and Monitor Licensing Category. Set and view the Threshold and Availability Profile and the Notification Profile according to the user in this tab.
Log Report
The Log Report tab offers a consolidated report of the Base Database monitor's log status, which can be downloaded as a CSV file.
Alert Logs
The Alert Logs tab displays a list of all alert events triggered for the Base Database monitor, including threshold breaches, downtime alerts, and recovery notifications with timestamps and severity levels.
Database
The monitor data for the Database monitor is given below.
Summary
The Summary tab provides an overview of the events timeline and metrics in the form of charts.
Pluggable Database
The Pluggable Database tab displays a list of all Pluggable Database child monitors. To view the PDB monitor details, click the desired monitor name hyperlink. You can drill down into individual databases to see performance metrics such as session counts, open modes, memory usage, and availability.
Work Requests
The Work Requests tab shows all recent maintenance or administrative actions (e.g., scaling, backup, patching) initiated on the Database monitors. This is crucial for tracking configuration changes and understanding performance fluctuations related to maintenance activities. Click the desired Operations hyperlink to view the log messages.
Configuration
From the Configuration tab, view the basic configuration details about your Database monitor, such as Lifecycle State, Database Name, and Database Version.
Outages
The Outages tab provides details on an outage's start time, end time, duration, and comments (if any).
Inventory
From the Inventory tab, obtain details like Database ID, Region, and Monitor Licensing Category. Set and view the Threshold and Availability Profile and the Notification Profile according to the user in this tab.
Log Report
The Log Report tab offers a consolidated report of the Database monitor's log status, which can be downloaded as a CSV file.
Alert Logs
The Alert Logs tab displays a list of all alert events triggered for the Base Database monitor, including threshold breaches, downtime alerts, and recovery notifications with timestamps and severity levels.
Pluggable Database
The monitor data for the Pluggable Database monitor is given below.
Summary
The Summary tab provides an overview of the events timeline and metrics in the form of charts.
Work Requests
The Work Requests tab shows all recent maintenance or administrative actions (e.g., scaling, backup, patching) initiated on the PDB monitors. This is crucial for tracking configuration changes and understanding performance fluctuations related to maintenance activities. Click the desired Operations hyperlink to view the log messages.
Configuration Details
From the Configuration Details tab, view the basic configuration details about your PDB monitor, such as Display Name, Lifecycle State, OCID, and Created Time.
Zia Forecast
From the Zia Forecast tab, get a forecast chart that displays future points of a performance metric (measurement of resource usage) based on historical time series data. Thirty days of historical data is used to predict what your metric usage will be in the next thirty days.
Outages
The Outages tab provides details on an outage's start time, end time, duration, and comments (if any).
Inventory
From the Inventory tab, obtain details like Database ID, Region, and Monitor Licensing Category. Set and view the Threshold and Availability Profile and the Notification Profile according to the user in this tab.
Log Report
The Log Report tab offers a consolidated report of the PDB monitor's log status, which can be downloaded as a CSV file.
Alert Logs
The Alert Logs tab displays a list of all alert events triggered for the PDB monitor, including threshold breaches, downtime alerts, and recovery notifications with timestamps and severity levels.