Azure Load Balancer Monitoring Integration
Azure Load Balancer scales your applications and offers high-availability, low-latency, high-throughput services. You can scale up to millions of flows for all TCP and UDP applications using Azure Load Balancer.
You can now monitor your load balancer, get precise analytics, set thresholds, automate operations, and stay on top of outages with Site24x7's integration.
Setup and configuration
You can add Azure Load Balancer while adding a new monitor or you can add it to an existing Azure monitor. Follow these steps to add the service.
Supported metrics
| Metric name | Description | Statistic | Unit |
|---|---|---|---|
| Allocated SNAT Ports | Total number of Source Network Address Translation (SNAT) ports allocated within the time period | Average | Count |
| Byte Count | Total number of bytes transmitted within the time period | Average | Count |
| Health Probe Status | Average load balancer health probe status per time duration | Average | Count |
| Packet Count | Total number of packets transmitted within the time period | Average | Count |
| SYN Count | Total number of synchronize (SYN) packets transmitted within the time period | Average | Count |
| SNAT Connection Count | Total number of new SNAT connections created within the time period | Average | Count |
| Used SNAT Ports | Total number of SNAT ports used within the time period | Average | Count |
| Data Path Availability | Average load balancer data path availability per time duration | Average | Count |
Azure Uptime monitoring
Site24x7’s Azure Uptime monitoring enables proactive tracking of your Azure resources’ availability and uptime, along with their configuration and inventory details. Note that uptime monitoring will disable performance metric data collection.
Threshold configuration
Global configuration
- Go to the Admin section on the left navigation pane.
- Select Configuration Profiles from the left pane and choose Threshold and Availability (+) from the drop-down menu. Click Add Threshold Profile from the top right corner.
- Choose Azure Disk as the monitor type.
You can also set the threshold values for all the metrics mentioned above.
Monitor-level configuration
- Go to Cloud > Azure and select Azure Disk from the drop-down menu.
- Choose a resource for which you would like to set a threshold and then click the hamburger icon
 on the top. Choose the Edit option, which will direct you to the Edit Azure Load Balancer Monitor page.
You can set the threshold values for the metrics by selecting the Threshold and Availability option. You can also configure IT automation at the attribute level.
Default threshold for disk optimization
Site24x7 alerts you based on a set of default thresholds. These default thresholds ensure that your load balancer is not overutilized, thus maintaining optimal storage and performance. This also helps in reducing costs by getting alerts for unusual changes. The default thresholds are as follows:
Metrics threshold:
- Allocated SNAT Ports
- Used SNAT Ports
- Byte Count
- Packet Count
- SYN Count
- SNAT Connection Count
- Data Path Availability
- Health Probe Status
Additional attributes threshold
- Alert if a resource in the Backend Pool goes down
- Alert if an instance in the Load Balancing Rule fails
- Unhealthy Hosts
- Healthy Hosts
- Total Hosts
- Healthy Host Percentage
IT Automation
You can configure Site24x7's IT Automation to auto-resolve performance degradation issues.
How to configure IT Automation for a monitor
Configuration Rules
Configure parameters like Threshold Profile, Notification Profile, Tags, and Monitor Group for multiple monitors with Site24x7's Configuration Rules.
How to add a Configuration Rule
Site24x7's Azure Load Balancer monitoring interface
Get an overview of the availability and usage status of your Azure Load Balancer.
Summary:
The Summary tab will help you view the Byte Count, Packet Count, Allowed SNAT Ports, and SYN Count-related information. With this information, you can monitor traffic patterns and identify bottlenecks.
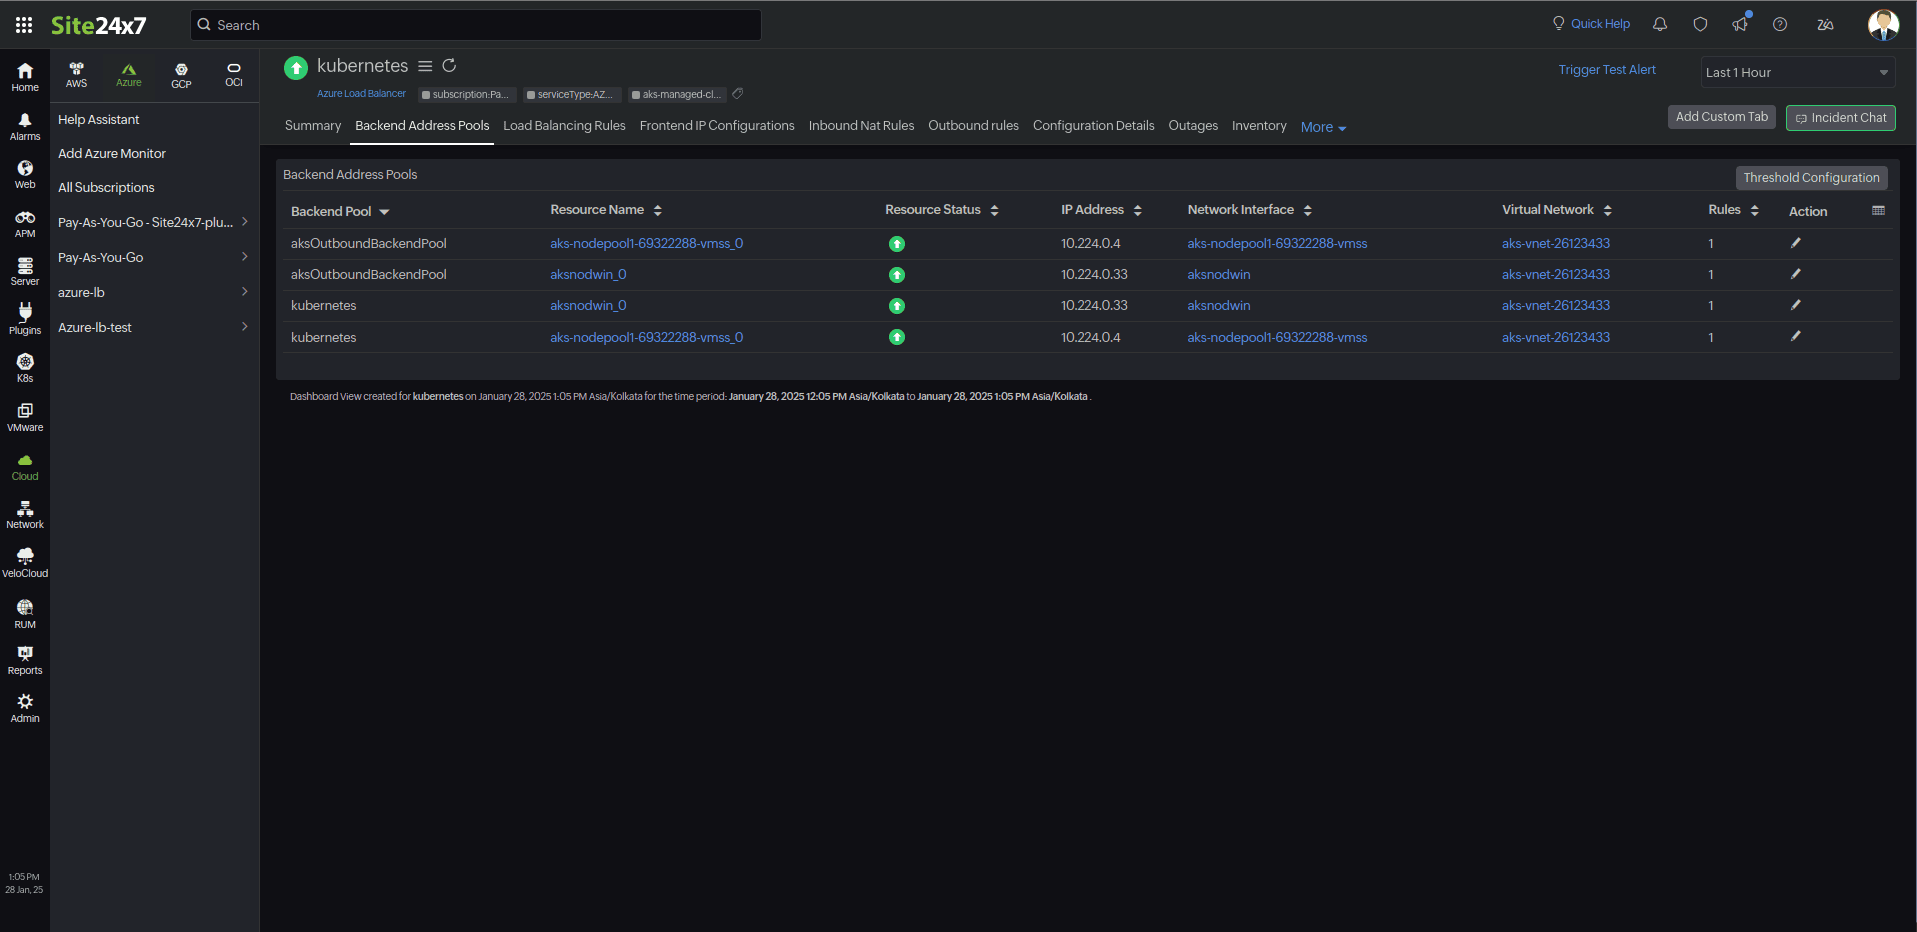
Backend Address Pools:
This tab has the list of the backend pools along with the statuses of the resources, Network Interfaces, and Virtual Networks, which are all mapped to their respective monitor views, IP addresses, and rules-related details. With this information, you can verify the backend connectivity and troubleshoot resource mapping issues.
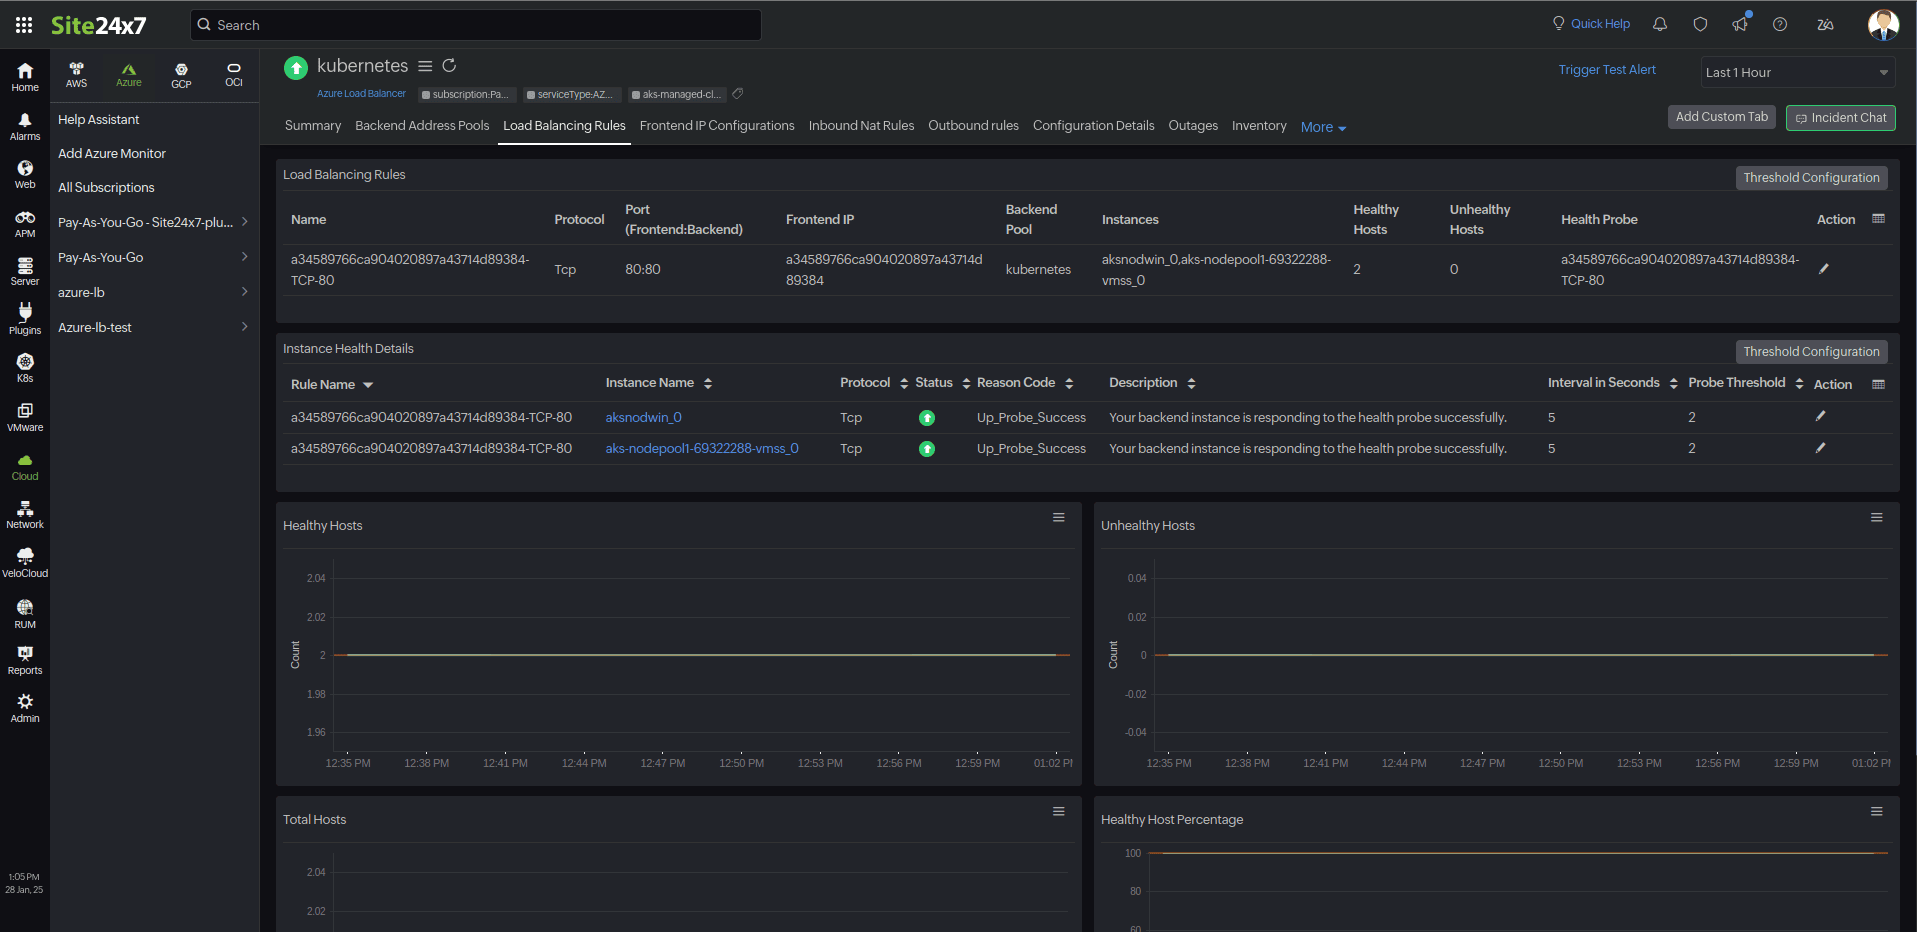
Load Balancing Rules:
This tab provides the list of load balancing rules and their instances, along with their statuses (healthy/unhealthy). You can also view the reason for the instance failure and related details to take corrective actions such as redistributing traffic or scaling resources.
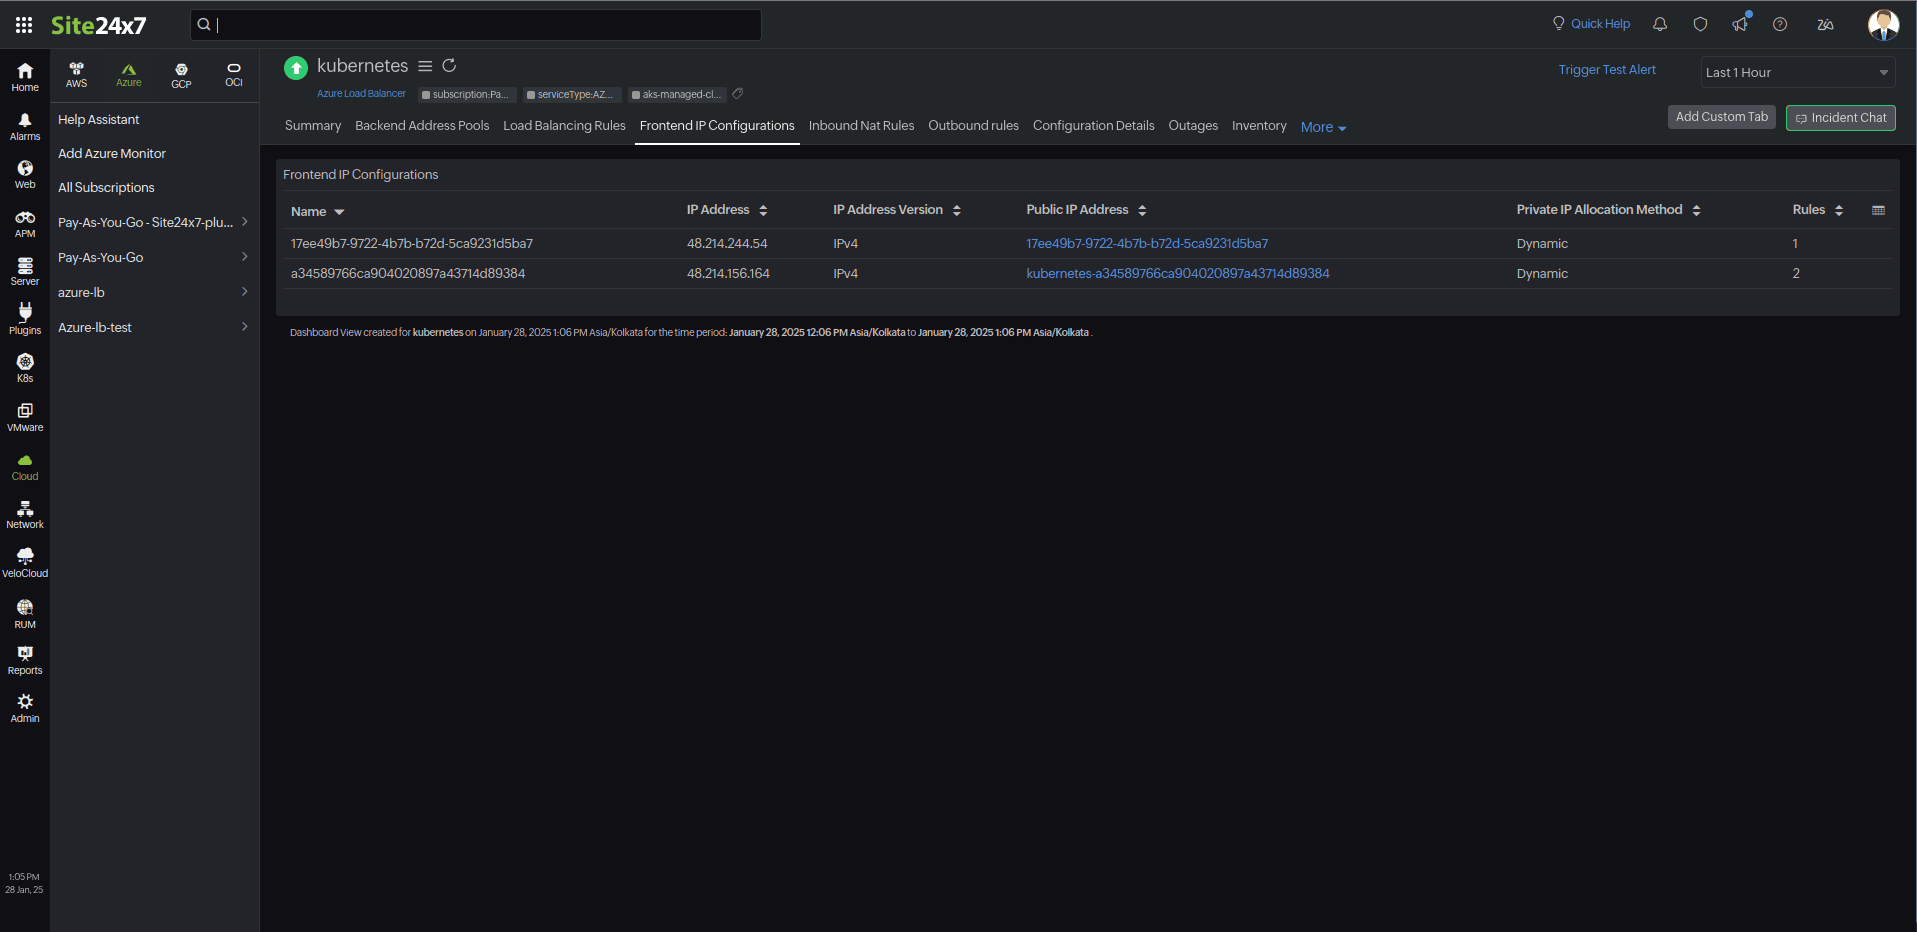
Frontend IP Configurations:
This tab contains the list of IP configurations and their IP addresses, which are mapped for monitoring.
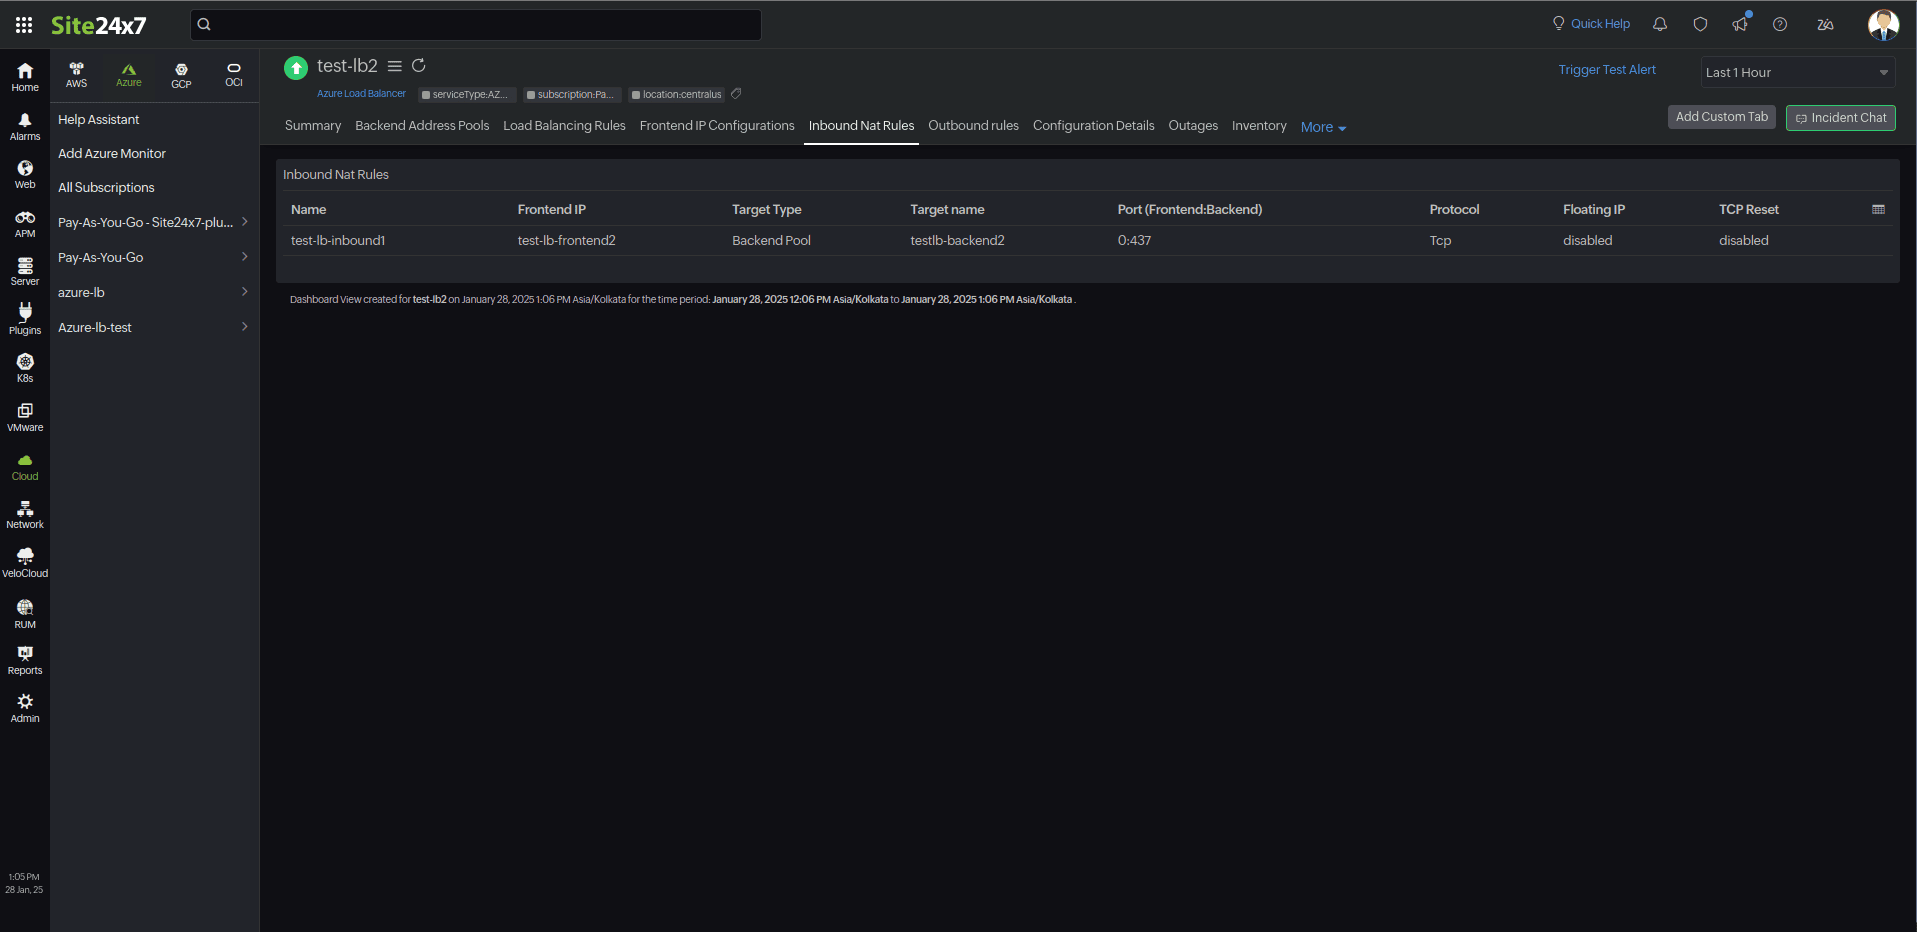
Inbound NAT Rules:
You can view the details of the IP configuration and the Target details of the rule and ensure that inbound traffic rules are configured correctly for Target resources.
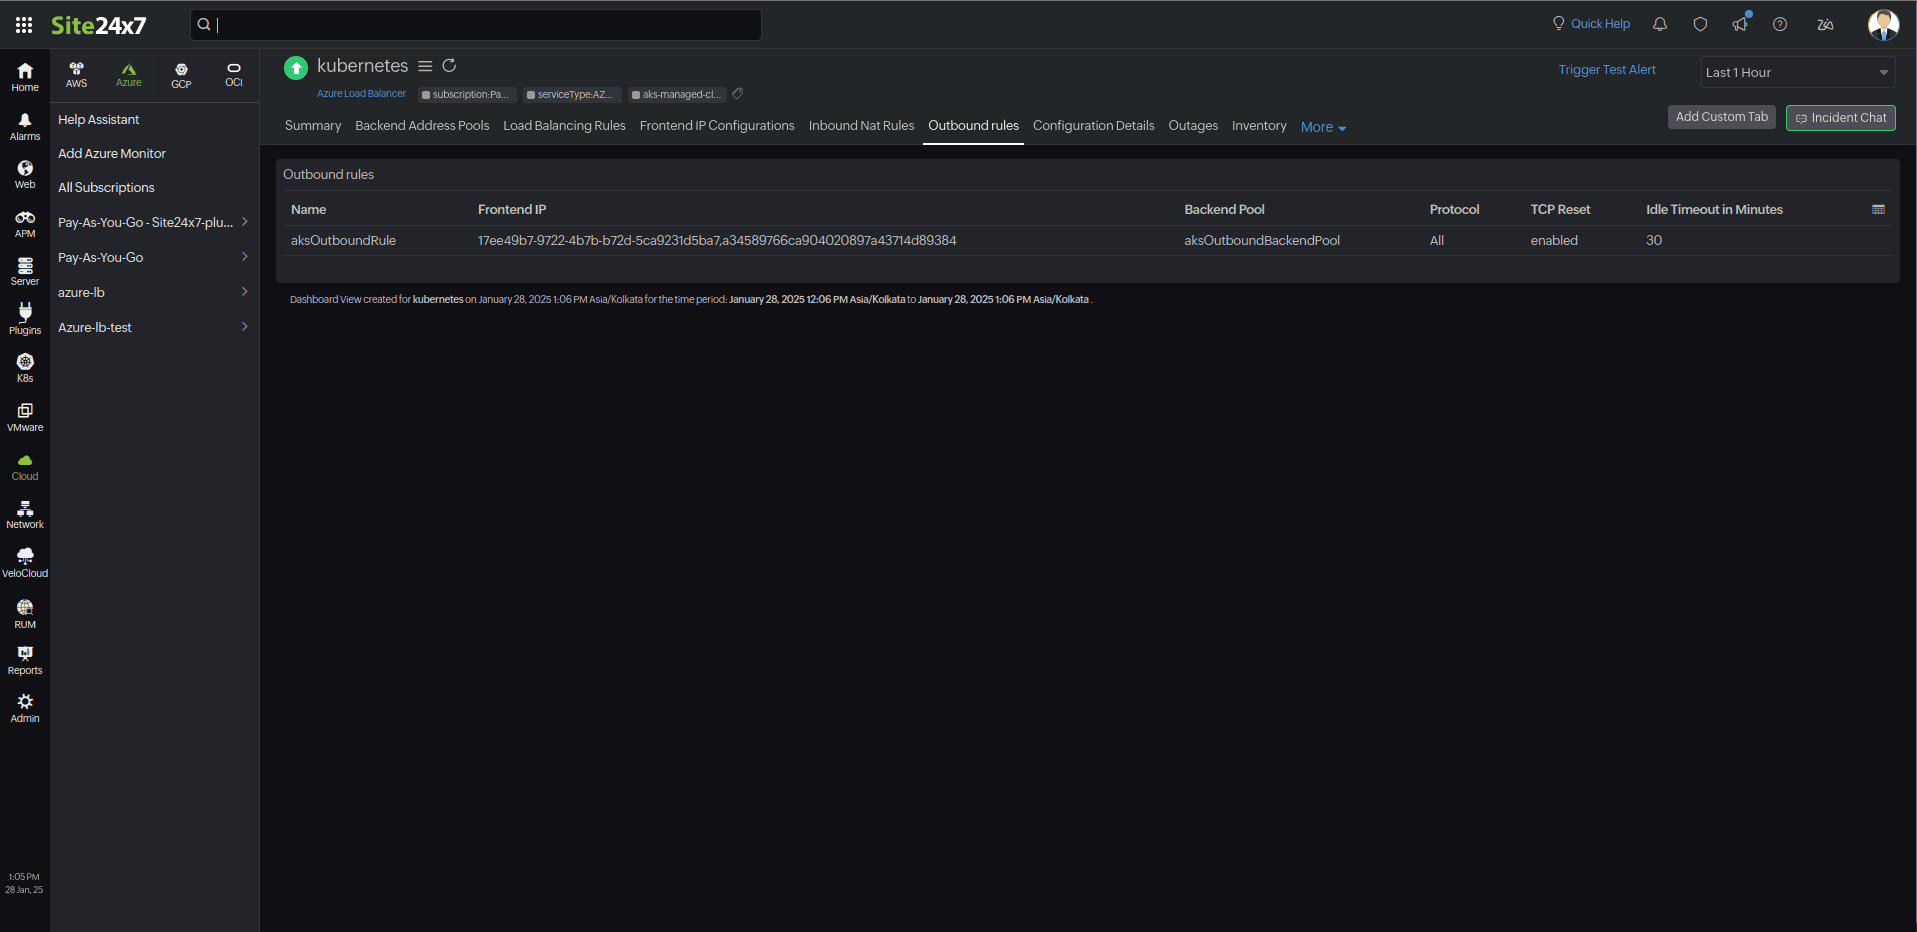
Outbound Rules:
This tab provides the configuration details with which you can review outbound rules to optimize traffic flow.
Configuration details:
This tab provides the configuration details of your Azure Load Balancer. Details on the Compute Size, Pricing Tier, and many more are included in this section.
Zia Forecast
By leveraging the AI-driven Zia framework, you can examine resource consumption measurements through the forecast chart located in the Zia Forecast tab. This chart predicts upcoming performance metrics based on a seven-day historical data analysis, providing insights into the expected metric usage for the next seven days.
Outages
The Outages tab provides the history of Azure AI Search statuses, including Down, Trouble, and Critical.
Inventory
The Inventory tab provides details on licensing, threshold and availability profiles, the set notification profiles, the set user alert group, and the monitor's created time and modified time.
Log Report
The Log Report tab lists all the logs collected during every data collection along with their statuses.
Related links:
How to add an Azure monitor.
How to integrate an Azure App Service monitor.
How to integrate Azure Virtual Machine monitor.
How to configure IT Automations for a monitor.
How to add a Configuration Rule.

