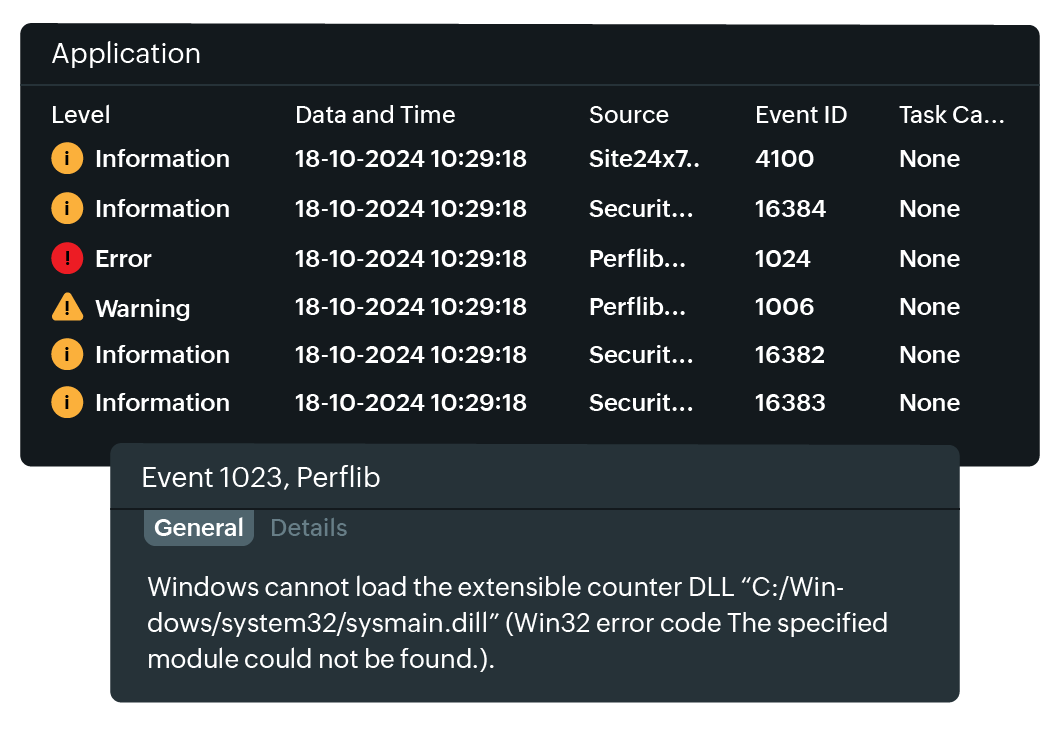
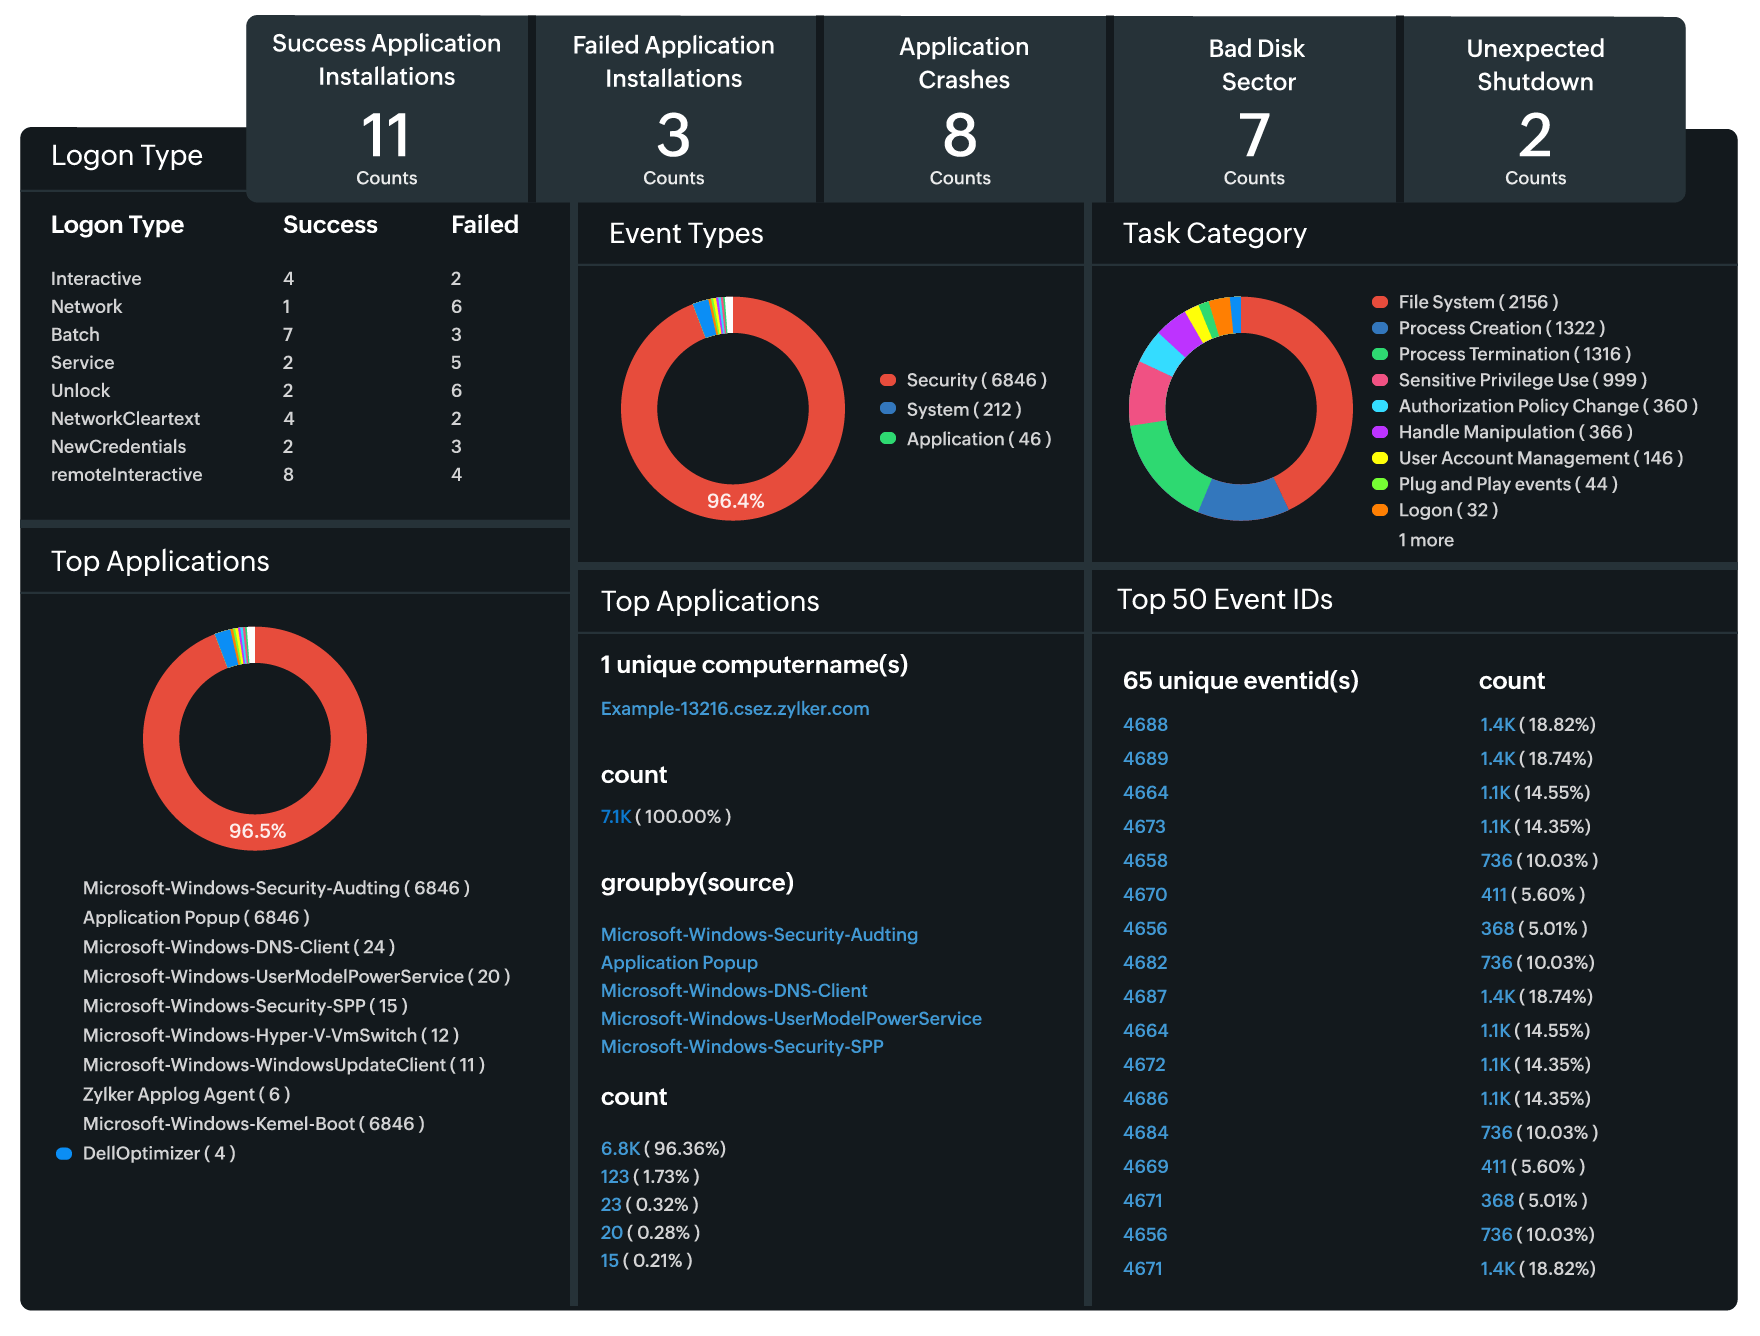
Any event related to the system, applications, and security of a Windows device gets logged in the event log. This powerful utility can help you troubleshoot existing issues and prevent future problems as well. Let's learn how.
The Windows Event Log is the single source of truth for anyone working with servers, including: system administrators, SREs, server managers, and DevOps professionals. This built-in utility helps with troubleshooting and diagnosing issues on Windows-based devices.
You can debug fatal errors, diagnose security breaches with conviction, and observe server performance with the event logs. We'll explain the importance of the Windows Event Logs, the features that make it worth the hype, and a few use cases to help you troubleshoot issues in your Windows servers and devices.
What is Windows Event Log?

Windows Event Log is the detailed record of events related to the applications, operating system, and security of a Windows device. If interpreted properly, Windows Event Log can tell you existing issues and also help you forecast future problems.
Where can you view Windows Event Log?
Windows Event Logs are viewed via Windows Event Viewer. Event Viewer is a built-in Microsoft Management Console (MMC) component. It is used to view and analyze logs on devices running on Windows operating systems. Windows devices keep an entry of all the activities, referred to as events, in the form of event logs.
These logs also contain the type of the event that occurred, whether the event was an error, warning, or information. These entries help you to:
- Know the reason your servers face a fatal error
- Track changes to security settings
- Audit system security and access
- Study the performance of the server
Event logs categories
Event logs contain three categories:
- Application logs: Log entries of events pertaining to the applications or programs running on the system. This includes program crashes, warnings, and performance issues.
- Security logs: Contains audit events like login attempts, user permission changes, and access control changes. These are useful for tracking security breaches.
- System logs: Log entries of events pertaining to the operating system running the server. This includes any problematic events with the hardware, drivers, reboots, and shutdowns.
How can you use Event Logs to troubleshoot Windows server issues?
Knowing where to look for the logs and interpreting them is the key to troubleshooting server issues using Windows Event logs. Here's how you can do that:
Access Event Logs in Windows server
Event logs can be viewed using Windows Event Viewer. To open Even Viewer, press Windows + R to open the Run dialog box. In the input field, enter eventvwr and press the Enter key. The Event Viewer dialog box will display all the available logs on the left.
Sifting through the logs
There are three main categories of Windows Event logs: Application, Security, and System under the Windows Logs section. Choose the appropriate type of log based on the issue you are facing in your Windows system.
Filtering events
Use the Filter Current Log option to drill-down the events based on the issue you are trying to troubleshoot. You can use event IDs for faster troubleshooting since every event has a unique ID.
Analyzing the Event Logs
Every event listed in Windows Event Viewer contains a description that includes:
- Date and time of occurrence
- Source: Origin of the event with the application or service that triggered the event
- Event ID: The unique identifier for each event type
- Details: Information about the event, like whether a package was installed or a user account was created.
Microsoft and many helpful online communities have a repository of event ID specific documentation. When you search for the event ID associated with an issue, you can find solutions to troubleshoot and also recommendations to prevent the issue from recurring again.
Create Custom Views to make the searches faster and easier once you have an idea of the recurring issues and event log entries you frequently search for.
Use cases for Event Logs in troubleshooting
No response from a server
Consider 100s of servers in a datacenter. The application running on the server is responsible for processing data and sending it to another team. Out of the blue, the processed data is not received. Now, you have two options after performing the basic checks like network connectivity, RBAC permissions, and server availability:
- Log in to the server, do trial runs, sift through hundreds of lines of application logs, and possibly find the reason
- Open Event Viewer from any connected server and look for Event ID 1000, which indicates an application crash.
Option No. 2 saves a lot of time and effort.
Fix a disk before it fails
Event logs can help you proactively fix hardware issues as well. The system logs can indicate hardware issues like memory errors and disk failures. If your event log has multiple instances of Event ID 7, it suggests the disk is about to fail and cause data loss. It is wise to replace the disk before any untoward incidents.
Detect suspicious login attempts
Consider a case where the user ID or email ID of an employee has been leaked into unwanted hands. They may try to log in to the network by guessing the password. Many organizations have users who still prefer password123 in their login credentials. This can be detected by seeing multiple entries in the event log with the Event ID 4625.
Event Viewer best practices
The Event Viewer tool is as powerful as the hands that wield it. Here are some best practices:
- Regularly review logs: Set a routine for reviewing the event logs, especially the security and system logs.
- Centralize, if possible: In enterprise conditions, manual log monitoring is time-consuming and inefficient. A centralized log repository is highly beneficial.
- Alerts for critical Event IDs: Set up a workflow to get instant alerts for critical events like server crashes or security violations.
How can Site24x7 help?

Manual analysis of event logs in an enterprise setup is a painful, and more importantly, an inefficient task. Let Site24x7—an enterprise grade AI-powered observability tool—help you multiply the capabilities of event logs with automated monitoring and instant alert capabilities.
If you would like to get alerts only when a specific Event ID or Event Severity occurs in the event logs without uploading your logs anywhere, our resource check profile is the tailor-made solution.
If you would like complete log observability, our AppLogs can help you sift through logs of 1,000s of servers in an instant, fetch errors, show problematic events in a dashboard, and so many more in just one browser tab.
About Site24x7
Site24x7 is a unified monitoring solution that can replace your disparate IT monitoring tools. A comprehensive AI-powered observability platform, Site24x7 collects and converges observability insights from metrics, traces, and logs, to help you gain actionable insights on a single platform.
With centralized dashboards, flexible alerts, and detailed reports, Site24x7 helps visualize, analyze, and identify the root cause of incidents. Site24x7 observes your entire IT environment, including websites and servers, network and application performance, FinOps, and hosted status communication pages. With powerful AI-led analytics and forecasts, automated actions, and exhaustive integrations, Site24x7 serves as an indispensable tool for DevOps and IT managers to maintain a healthy, high-performing, and resilient IT ecosystem.